Table of Contents
Valuation Scans is a metric to ascertain the right price to enter into a stock. It determines when and why to invest in a stock. It estimates the worth of the stock and thus ascertains the price related to the worth. Thus it gives the fair valuation of the stock price and hence lets us analyze the value it can generate for the Investor if one invests in it at fair value. In StockEdge App all the stocks are analyzed using PE Ratio, Book Value etc. to ascertain whether they are undervalued or overvalued.
What does PE indicate?
PE means the price to earnings ratio. It means the ratio of market price per share to earnings per share. It means the price the market is willing to pay for a company’s earnings. Thus better the earnings more the price. The PE is calculated by dividing the market cap by the company’s earnings and market cap is derived by multiplying the market price of the stock with the number of outstanding shares. The outstanding shares are those which are shown as the total number of shares in the shareholding pattern. Thus higher the PE the more expensive the stock and lower the PE the stock has more potential to grow.
What is a comfortable PE Ratio?
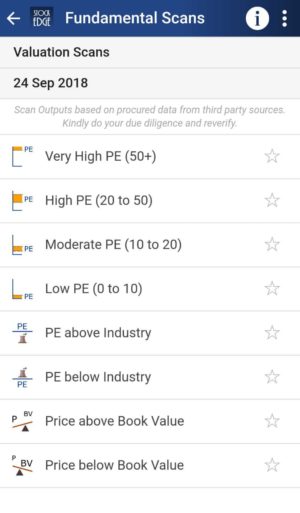
In the app Stocks are divided into 4 categories : Very high PE, High PE, Moderate PE, Low PE.
- Very high PE Ratio means a stock is trading not only above its Industry PE but also above its Peers PE in the same Industry thus is termed overvalued. Stocks with PE Ratio above their Industry PE are best avoided being at expensive valuations. Though the PE ratio varies from Industry to Industry but still a generalized view is much followed in the Industry. Thus a PE ratio above 50 is called as having a very high PE which mostly consumption themed stocks command.
- A PE ratio between 20-50 is called as High PE but varies from Industry to Industry. Auto Industry commands a high PE.
- Moderate PE ratio is between 10-20. Pharma and I.T sector normally fall under this PE. Mid-caps mostly under this PE are the best buys for the long term.
- Low PE ratio is generally seen in the small-cap space thus they become undervalued stocks which is a value buy if trading between 0-10 PE levels. Stocks with low PE generally trades at a PE below their Industry PE as well as their Peers PE and thus become a value buy for decent returns.
You can also watch the below video on Everything you want to know about Valuation Scans
PE Ratio Formula
PE Ratio = Mkt cap/Earnings per share where
Mkt cap = Price of the share * total number of outstanding shares
PE Ratio = Price of the share/ Earnings per share (EPS) where
EPS=(Net Profit-Preferred Dividends)/Weighted average number of outstanding shares

What do you mean by Industry PE?
5000+ stocks are classified into 130+ industries in the StockEdge App for better study. Every Industry has a different PE assigned to it based on various criteria. PE is one of the criteria to ascertain undervaluation or overvaluation of stocks but it’s not the only criteria to ascertain this. Among high PE the consumption Industry holds the highest PE.
- Stocks which trades above its Industry PE are expected to be overvalued and thus returns from these kinds of stocks can be limited.
- Stocks which trades below its Industry PE are expected to be undervalued thus returns from these kinds of stocks can be more in percentage terms.
See also: Price to Earnings Ratio (PE Ratio)
What does a Book Value Indicate?
Book value means it’s that price which the shareholders will receive in the event of any liquidation of the company. Book Value takes into account all the Assets as well as the Liabilities of the company. It takes only the tangible assets like land and building, plant and machinery etc. into account and not the intangible assets like goodwill, patent etc. while calculating Book Value. Price to Book Value means how many times the stock is trading above or below its book value.
Book Value Formula
Book Value= Total Assets – Total Liabilities – Intangible Assets
Book Value per Share Formula
Book Value per share = (Total Equity – Preferred Equity)/ Total shares outstanding
What does Price and Book Value tell about a company?
- Price above book value means that the stock is trading at a higher price compared to the amount of tangible assets it holds per share in its Balance Sheet. Thus financially sound companies and monopoly companies normally trade above their book value. These kinds of companies are normally fairly valued or overvalued.
- Price below Book value means that the value of tangible assets in the books of the company is more than its price per share. It also means that if the company is liquidated anytime than the shareholders to receive more value for the shares held by them than the price at which the company is currently trading.
What do you mean by Enterprise Value (EV)?
Enterprise value (EV) is a measure of a company’s total value, often used as a more comprehensive alternative to equity market capitalization. EV includes in its calculation the market capitalization of a company but also short-term and long-term debt as well as any cash on the company’s balance sheet. Enterprise value is a popular metric used to value a company for a potential takeover.
Enterprise Value= Market Capitalization+Total Debt-Cash and cash equivalents
Impact of EV/ EBITDA
EV/ EBITDA or Enterprise Multiple is used to determine the value of a company. This popular metric is used as a tool to compare the value of a company, debt included, to the company’s cash earnings less non-cash expenses. It’s ideal for analysts and investors looking to compare companies within the same industry. Just like P/E ratio (price-to-earnings), the lower the EV/EBITDA, the cheaper the valuation for a company.
EV/EBIDTA = Enterprise Value/ EBITDA
Consistently increasing EV to EBITDA Ratio means that the stock is overvalued and investors should reduce its holding on that stock. Generally, EV/EBITDA values above 10 are considered to be high-value stock. However, a comparison of relative values among companies within the industry is the best way to take a decision.
Consistently decreasing EV to EBITDA Ratio means the stock is undervalued and investors should go long on such stocks. Generally, EV/EBITDA values below 10 are seen as healthy. However, a comparison of relative values among companies within the industry is the best way to take a decision.
Also Read : How to Use Enterprise Value for Searching Stocks for Investment.
Bottomline
Valuation ratios are a very important tool for determining entry or exit for a stock. Any strong company will give you the best returns on your investments and the tool which will help you to filter out all these and much more is the Stockedge app.
In fact, StockEdge is the only app where you get all this data in the simplest and easiest possible way, that too with just the click of a button. You can also do peer study of PE Ratio and Price/BV from Sector page in StockEdge app. So what are you waiting for? If you still do not have the StockEdge app, download it right now to use this feature. It is a part of the premium offering of StockEdge App.
Click here to know StockEdge Premium


