StockEdge.com
  • Products
    • StockEdge Premium
    • StockEdge Pro
    • StockEdge Club
    • Compare Plans
StockEdge Blog
  • Trending Stocks
  • Insights
    • All
    • Business Houses
    • Markets themes
    • Stock Insights
    Top 5 Textile stocks

    Top 5 Textile Stocks in India: From Cotton to Cash

    multi-bagger stocks for 2025

    5 Multibagger Stocks to keep an eagle-eye for 2025

    Jindal Saw – Strong Earnings Momentum Ahead

    Jindal Saw – Strong Earnings Momentum Ahead

    Kirloskar Group- A Legacy of 134 Years

    Kirloskar Group- A Legacy of 134 Years

    renewable energy stocks in india

    Top Renewable Energy Stocks in India

    blue chip stocks

    Top 5 Blue Chip Stocks to Buy and Invest in 2023

    Budget 2023: Stocks to keep an eye on

    Budget 2023: Stocks to keep an eye on

    Adani Enterprises FPO: Detailed Analysis, GMP and Review?

    Adani Enterprises FPO: Detailed Analysis, GMP and Review?

    Top 5 Defence Stocks to Invest in India

    Top 5 Defence Stocks to Invest in India

  • Technical Analysis
    Chart Patterns – Holy grail of Stock Market Analysis

    Chart Patterns – Holy grail of Stock Market Analysis

    StockEdge Version Update : 9.0

    StockEdge Version Update : 9.0

    Beat the street with Sector Rotation Strategy

    Beat the street with Sector Rotation Strategy

    StockEdge Version Update 8.2

    StockEdge Version Update 8.2

    Derivative Analytics

    An Insightful Research Tool For Derivative Analytics

    Introducing Put-Call Ratio a Derivative Indicator in the Market

    Introducing Put-Call Ratio a Derivative Indicator in the Market

    A Powerful Technical Indicator Beta & Beta Scans

    A Powerful Technical Indicator Beta & Beta Scans

    Technical Analysis using Edge Charts

    Technical Analysis using Edge Charts

    adaptive relative strength and static relative strength scans

    What is Adaptive Relative Strength & Static Relative Strength Scans?

  • Fundamental Analysis
    • All
    • Cash Flow Ratios
    • Efficiency ratios
    • Growth Ratios
    • Liquidity Ratios
    • Return Ratios
    • Solvency ratios
    • Valuation Ratios
    high dividend paying stocks

    Identifying High Dividend Paying Stocks

    Understanding the Importance of creating Fundamental Scans

    Understanding the Importance of creating Fundamental Scans

    Using My Combination Scan to Identify best in an Industry

    Using My Combination Scan to Identify best in an Industry

    Cost Income ratio

    Cost to Income Ratio(%)

    Cost of Liability

    Cost of Liabilities (%)

    Operating Cost to Assets Ratio (%)

    Operating Cost to Assets Ratio (%)

  • StockEdge Tutorials
    StockEdge Club: An Exclusive Investors Hub & Analytics platform

    StockEdge Club: An Exclusive Investors Hub & Analytics platform

    FII/DII Data: Leading Indicators of Stock Market

    FII/DII Data: Leading Indicators of Stock Market

    Chart Patterns – Holy grail of Stock Market Analysis

    Chart Patterns – Holy grail of Stock Market Analysis

    StockEdge Version Update : 9.0

    StockEdge Version Update : 9.0

    Powerful Investment Themes for Retail Investors

    Powerful Investment Themes for Retail Investors

    Beat the street with Sector Rotation Strategy

    Beat the street with Sector Rotation Strategy

    StockEdge Version Update 8.3

    StockEdge Version Update 8.3

    StockEdge Version Update 8.2

    StockEdge Version Update 8.2

    Using Investor Portfolios Section to track Big Bulls like Rakesh Jhunjhunwala

    Using Investor Portfolios Section to track Big Bulls like Rakesh Jhunjhunwala

  • Mutual Fund
    Top 5 Mutual Funds for 2022 where you can start your SIP

    Top 5 Mutual Funds for 2022 where you can start your SIP

    What are Value Funds and its Advantages?

    What are Value Funds and its Advantages?

    thematic funds

    Thematic Funds : Everything you need to know

    Understanding Sector Funds and their Benefits to our Portfolio

    Understanding Sector Funds and their Benefits to our Portfolio

    Are Dividend Yield Funds a good option to invest in?

    Are Dividend Yield Funds a good option to invest in?

    What are Contra Funds and their advantages?

    What are Contra Funds and their advantages?

    Trending Tags

    No Result
    View All Result
    • Trending Stocks
    • Insights
      • All
      • Business Houses
      • Markets themes
      • Stock Insights
      Top 5 Textile stocks

      Top 5 Textile Stocks in India: From Cotton to Cash

      multi-bagger stocks for 2025

      5 Multibagger Stocks to keep an eagle-eye for 2025

      Jindal Saw – Strong Earnings Momentum Ahead

      Jindal Saw – Strong Earnings Momentum Ahead

      Kirloskar Group- A Legacy of 134 Years

      Kirloskar Group- A Legacy of 134 Years

      renewable energy stocks in india

      Top Renewable Energy Stocks in India

      blue chip stocks

      Top 5 Blue Chip Stocks to Buy and Invest in 2023

      Budget 2023: Stocks to keep an eye on

      Budget 2023: Stocks to keep an eye on

      Adani Enterprises FPO: Detailed Analysis, GMP and Review?

      Adani Enterprises FPO: Detailed Analysis, GMP and Review?

      Top 5 Defence Stocks to Invest in India

      Top 5 Defence Stocks to Invest in India

    • Technical Analysis
      Chart Patterns – Holy grail of Stock Market Analysis

      Chart Patterns – Holy grail of Stock Market Analysis

      StockEdge Version Update : 9.0

      StockEdge Version Update : 9.0

      Beat the street with Sector Rotation Strategy

      Beat the street with Sector Rotation Strategy

      StockEdge Version Update 8.2

      StockEdge Version Update 8.2

      Derivative Analytics

      An Insightful Research Tool For Derivative Analytics

      Introducing Put-Call Ratio a Derivative Indicator in the Market

      Introducing Put-Call Ratio a Derivative Indicator in the Market

      A Powerful Technical Indicator Beta & Beta Scans

      A Powerful Technical Indicator Beta & Beta Scans

      Technical Analysis using Edge Charts

      Technical Analysis using Edge Charts

      adaptive relative strength and static relative strength scans

      What is Adaptive Relative Strength & Static Relative Strength Scans?

    • Fundamental Analysis
      • All
      • Cash Flow Ratios
      • Efficiency ratios
      • Growth Ratios
      • Liquidity Ratios
      • Return Ratios
      • Solvency ratios
      • Valuation Ratios
      high dividend paying stocks

      Identifying High Dividend Paying Stocks

      Understanding the Importance of creating Fundamental Scans

      Understanding the Importance of creating Fundamental Scans

      Using My Combination Scan to Identify best in an Industry

      Using My Combination Scan to Identify best in an Industry

      Cost Income ratio

      Cost to Income Ratio(%)

      Cost of Liability

      Cost of Liabilities (%)

      Operating Cost to Assets Ratio (%)

      Operating Cost to Assets Ratio (%)

    • StockEdge Tutorials
      StockEdge Club: An Exclusive Investors Hub & Analytics platform

      StockEdge Club: An Exclusive Investors Hub & Analytics platform

      FII/DII Data: Leading Indicators of Stock Market

      FII/DII Data: Leading Indicators of Stock Market

      Chart Patterns – Holy grail of Stock Market Analysis

      Chart Patterns – Holy grail of Stock Market Analysis

      StockEdge Version Update : 9.0

      StockEdge Version Update : 9.0

      Powerful Investment Themes for Retail Investors

      Powerful Investment Themes for Retail Investors

      Beat the street with Sector Rotation Strategy

      Beat the street with Sector Rotation Strategy

      StockEdge Version Update 8.3

      StockEdge Version Update 8.3

      StockEdge Version Update 8.2

      StockEdge Version Update 8.2

      Using Investor Portfolios Section to track Big Bulls like Rakesh Jhunjhunwala

      Using Investor Portfolios Section to track Big Bulls like Rakesh Jhunjhunwala

    • Mutual Fund
      Top 5 Mutual Funds for 2022 where you can start your SIP

      Top 5 Mutual Funds for 2022 where you can start your SIP

      What are Value Funds and its Advantages?

      What are Value Funds and its Advantages?

      thematic funds

      Thematic Funds : Everything you need to know

      Understanding Sector Funds and their Benefits to our Portfolio

      Understanding Sector Funds and their Benefits to our Portfolio

      Are Dividend Yield Funds a good option to invest in?

      Are Dividend Yield Funds a good option to invest in?

      What are Contra Funds and their advantages?

      What are Contra Funds and their advantages?

      Trending Tags

      No Result
      View All Result
      StockEdge Blog
      Home Tutorials
      Book Value per share

      Book Value (BV) Per Share

      StockEdge by StockEdge
      November 8, 2018
      Reading Time: 3 mins read
      2.3k
      VIEWS
      Share on FacebookShare on TwitterShare On WhatsApp

      Table of Contents

      • Impact of Book Value per Share
      • How does Book Value increase or decrease
      • Exceptions
      • Formula
      • Stockedge App
      • Bottomline

      Book value is the value of the company’s assets which can be received by the shareholders in the event of company’s liquidation or during bankruptcy. Thus its the residual value after paying off all the liabilities (debt, borrowings and payables) and preference holders in the event of liquidation. Thus it’s a true value of a business. Positive BV means that the assets are more than the liabilities and vice a versa. If BV is negative, that means the company will go in for insolvency proceedings.

      You can also watch the below video on Everything you want to know about Book value per share:

      Impact of Book Value per Share

      BV is a company’s net asset value. At the time of liquidation of a company, the book value indicates the amount each shareholder will receive after all assets are liquidated and all the liabilities are settled. This ratio is used by investors to determine whether a stock price is undervalued or overvalued. If the price to book value per share is less than one, it means that the stock is trading below its book value.

      If a business can increase its Book Value per share, investors may view the stock as more valuable, and the stock price may increase further. BV is majorly arrived at taking into account historical prices of assets thus market value should be the best judge for any investment or liquidation decision. Market value takes into account the future growth prospects of the company.

      How does Book Value increase or decrease

      If the company goes in for buybacks or open offer then the book value of the share decreases. This increase or decrease happens due to change in Total Outstanding shares. Again if the Total Assets increases or liabilities reduces then also the BV increases and if the Investments (a part of Assets) are sold off or debt is increased (in the liabilities side) then the BV decreases.

      Exceptions

      The BV per share of different companies from different sectors cannot be compared since it shows a major variation. Hence, the formula is restricted to different companies in the same sector. If we compare between sectors it will show a major aberration. Secondly, the Assets under management are not valued at market price in the balance sheet and thus represents the value at the time of its purchase and also the depreciation shown can be more than what is actually shown.

      Formula

      Book Value per share = Total Equity – Preferred Equity/ Total Outstanding Shares

      Suppose a company’s total assets is Rs 12 crores and liabilities is Rs 2 crores, its preferred Equity is Rs 3 crores and the total outstanding shares are 3.5 crores, then its book value per share = {(12-2)-3}/3.5= Rs 2
      Book Value per Share

      Check Out Also: Difference Between Face Value, Book Value And Market Value

      Stockedge App

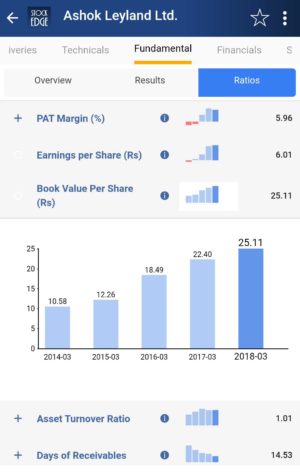
      Hey, with the StockEdge app we don’t have to calculate BV per Share. StockEdge gives us Book Value per Share of the last 5 years of any company listed in the stock exchange. We can look and compare BV per Share of any company and filter out stocks accordingly.

      Suppose we want to look at the Book Value per Share of Ashok Leyland of last year. In the Fundamental tab of Ashok Leyland, click on the fundamentals tab, we will get the Ratios tab. Then in the Ratios tab click on Efficiency Ratios, and we get the Book Value per Share in minuscule of a second.

      Bottomline

      Book Value per share is an important barometer to look at how the company is valued with respect to its assets. With the help, of these ready-made scans you can with the click of a button filter out good companies. So, what are you waiting for? Subscribe now to use this free feature for your investment clarity.

      Visit StockEdge website to explore more.

      If you want to know more then visit our YouTube channel.

      Tags: Book ValueEfficiency Ratiosfinancial analysisFinancial ratiosfinancial strengthFundamental analysisfundamental ratioFundamental scansStockedge appStockEdge Scanvaluation ratio
      ShareTweetSend
      Subscribe On Telegram Subscribe On Telegram Subscribe On Telegram
      Previous Post

      DIWALI DOUBLE DHAMAKA LAUNCH VERSION 4.0

      Next Post

      Operating Income Growth(%) Ratio

      StockEdge

      StockEdge

      StockEdge is a self-help Equity and Mutual Fund research tool. It empowers retail investors to identify investment opportunity with all the necessary data and analytics.

      Next Post
      Operating Income growth

      Operating Income Growth(%) Ratio

      Credit to deposit

      Credit to Deposit (%): Explanation, Impact & Formula

      Advances Growth(%) : Impacts & Definition

      Advances Growth(%) : Impacts & Definition

      Leave a Reply Cancel reply

      Your email address will not be published. Required fields are marked *

      Contact Us
      • Timing (Mon-Sat): 10 am to 7 pm
      • Sales: +919830994463
      • Support: +919830994402
      • Club Support: +916289906895
      • Affiliate: +917003567131
      Recent Posts
      Top 5 Textile stocks
      Top 5 Textile Stocks in India: From Cotton to Cash
      multi-bagger stocks for 2025
      5 Multibagger Stocks to keep an eagle-eye for 2025
      Important Links
      • StockEdge.com
      • StockEdge Premium
      • - Quarterly Membership
      • - Annual Membership
      • StockEdge Analyst
      • StockEdge Club
      • Compare Plans
      An Initiative Of

      © 2023 Kredent InfoEdge Pvt Ltd.

      Facebook-f Twitter Instagram Linkedin-in Youtube Pinterest-p

      Get StockEdge App

      No Result
      View All Result
      • Home
      • Article Categories
        • Fundamental Analysis
        • Technical Analysis
        • Market Themes
        • StockEdge Tutorials
        • StockEdge Version Updates
      • Products
        • StockEdge Premium
        • StockEdge Pro
        • StockEdge Club
        • Compare Plans
      • Visit StockEdge.com

      © 2023 Kredent InfoEdge Pvt Ltd.