StockEdge.com
  • Products
    • StockEdge Premium
    • StockEdge Pro
    • StockEdge Club
    • Compare Plans
StockEdge Blog
  • Trending Stocks
  • Insights
    • All
    • Business Houses
    • Markets themes
    • Stock Insights
    Top performing blue chip stocks to buy and invest in 2023

    Top 5 Blue Chip Stocks to Buy and Invest in 2023

    Budget 2023: Stocks to keep an eye on

    Budget 2023: Stocks to keep an eye on

    Top performing blue chip stocks to buy and invest in 2023

    Top 5 Blue Chip Stocks to Buy and Invest in 2023

    Adani Enterprises FPO: Detailed Analysis, GMP and Review?

    Adani Enterprises FPO: Detailed Analysis, GMP and Review?

    Top 5 Defence Stocks to Invest in India

    Top 5 Defence Stocks to Invest in India

    best stocks to invest in india

    2023: Best Stocks to invest in India

    Cochin Shipyard – A strong defense play for India

    Cochin Shipyard – A strong defense play for India

    Avanti Feeds – Shrimply Irresistible

    Avanti Feeds – Shrimply Irresistible

    Gati Ltd. – Can it ride the Logistic Industry’s Tailwinds?

    Gati Ltd. – Can it ride the Logistic Industry’s Tailwinds?

  • Technical Analysis
    Chart Patterns – Holy grail of Stock Market Analysis

    Chart Patterns – Holy grail of Stock Market Analysis

    StockEdge Version Update : 9.0

    StockEdge Version Update : 9.0

    SE Blog- How to beat the street with Sector Rotation Strategy.

    SE Blog- How to beat the street with Sector Rotation Strategy.

    StockEdge Version Update 8.2

    StockEdge Version Update 8.2

    Derivative Analytics

    An Insightful Research Tool For Derivative Analytics

    Introducing Put-Call Ratio a Derivative Indicator in the Market

    Introducing Put-Call Ratio a Derivative Indicator in the Market

    A Powerful Technical Indicator Beta & Beta Scans

    A Powerful Technical Indicator Beta & Beta Scans

    Technical Analysis using Edge Charts

    Technical Analysis using Edge Charts

    What is Adaptive Relative Strength & Static Relative Strength Scans?

    What is Adaptive Relative Strength & Static Relative Strength Scans?

  • Fundamental Analysis
    • All
    • Cash Flow Ratios
    • Efficiency ratios
    • Growth Ratios
    • Liquidity Ratios
    • Return Ratios
    • Solvency ratios
    • Valuation Ratios
    StockEdge Version Update 8.2

    StockEdge Version Update 8.2

    Understanding the Importance of creating Fundamental Scans

    Understanding the Importance of creating Fundamental Scans

    Using My Combination Scan to Identify best in an Industry

    Using My Combination Scan to Identify best in an Industry

    Cost Income ratio

    Cost to Income Ratio(%)

    Cost of Liability

    Cost of Liabilities (%)

    Operating Cost to Assets Ratio (%)

    Operating Cost to Assets Ratio (%)

  • StockEdge Tutorials
    Chart Patterns – Holy grail of Stock Market Analysis

    Chart Patterns – Holy grail of Stock Market Analysis

    StockEdge Version Update : 9.0

    StockEdge Version Update : 9.0

    Powerful Investment Themes for Retail Investors

    Powerful Investment Themes for Retail Investors

    SE Blog- How to beat the street with Sector Rotation Strategy.

    SE Blog- How to beat the street with Sector Rotation Strategy.

    StockEdge Version Update 8.3

    StockEdge Version Update 8.3

    StockEdge Version Update 8.2

    StockEdge Version Update 8.2

    Using Investor Portfolios Section to track Big Bulls like Rakesh Jhunjhunwala

    Using Investor Portfolios Section to track Big Bulls like Rakesh Jhunjhunwala

    StockEdge Version 8.1 – It keeps getting Better & Better

    StockEdge Version 8.1 – It keeps getting Better & Better

    StockEdge Version Update 8.0 – Like never before

    StockEdge Version Update 8.0 – Like never before

  • Mutual Fund
    Top 5 Mutual Funds for 2022 where you can start your SIP

    Top 5 Mutual Funds for 2022 where you can start your SIP

    What are Value Funds and its Advantages?

    What are Value Funds and its Advantages?

    A Beginners Guide to Thematic Funds

    A Beginners Guide to Thematic Funds

    Understanding Sector Funds and their Benefits to our Portfolio

    Understanding Sector Funds and their Benefits to our Portfolio

    Are Dividend Yield Funds a good option to invest in?

    Are Dividend Yield Funds a good option to invest in?

    What are Contra Funds and their advantages?

    What are Contra Funds and their advantages?

    Trending Tags

    No Result
    View All Result
    • Trending Stocks
    • Insights
      • All
      • Business Houses
      • Markets themes
      • Stock Insights
      Top performing blue chip stocks to buy and invest in 2023

      Top 5 Blue Chip Stocks to Buy and Invest in 2023

      Budget 2023: Stocks to keep an eye on

      Budget 2023: Stocks to keep an eye on

      Top performing blue chip stocks to buy and invest in 2023

      Top 5 Blue Chip Stocks to Buy and Invest in 2023

      Adani Enterprises FPO: Detailed Analysis, GMP and Review?

      Adani Enterprises FPO: Detailed Analysis, GMP and Review?

      Top 5 Defence Stocks to Invest in India

      Top 5 Defence Stocks to Invest in India

      best stocks to invest in india

      2023: Best Stocks to invest in India

      Cochin Shipyard – A strong defense play for India

      Cochin Shipyard – A strong defense play for India

      Avanti Feeds – Shrimply Irresistible

      Avanti Feeds – Shrimply Irresistible

      Gati Ltd. – Can it ride the Logistic Industry’s Tailwinds?

      Gati Ltd. – Can it ride the Logistic Industry’s Tailwinds?

    • Technical Analysis
      Chart Patterns – Holy grail of Stock Market Analysis

      Chart Patterns – Holy grail of Stock Market Analysis

      StockEdge Version Update : 9.0

      StockEdge Version Update : 9.0

      SE Blog- How to beat the street with Sector Rotation Strategy.

      SE Blog- How to beat the street with Sector Rotation Strategy.

      StockEdge Version Update 8.2

      StockEdge Version Update 8.2

      Derivative Analytics

      An Insightful Research Tool For Derivative Analytics

      Introducing Put-Call Ratio a Derivative Indicator in the Market

      Introducing Put-Call Ratio a Derivative Indicator in the Market

      A Powerful Technical Indicator Beta & Beta Scans

      A Powerful Technical Indicator Beta & Beta Scans

      Technical Analysis using Edge Charts

      Technical Analysis using Edge Charts

      What is Adaptive Relative Strength & Static Relative Strength Scans?

      What is Adaptive Relative Strength & Static Relative Strength Scans?

    • Fundamental Analysis
      • All
      • Cash Flow Ratios
      • Efficiency ratios
      • Growth Ratios
      • Liquidity Ratios
      • Return Ratios
      • Solvency ratios
      • Valuation Ratios
      StockEdge Version Update 8.2

      StockEdge Version Update 8.2

      Understanding the Importance of creating Fundamental Scans

      Understanding the Importance of creating Fundamental Scans

      Using My Combination Scan to Identify best in an Industry

      Using My Combination Scan to Identify best in an Industry

      Cost Income ratio

      Cost to Income Ratio(%)

      Cost of Liability

      Cost of Liabilities (%)

      Operating Cost to Assets Ratio (%)

      Operating Cost to Assets Ratio (%)

    • StockEdge Tutorials
      Chart Patterns – Holy grail of Stock Market Analysis

      Chart Patterns – Holy grail of Stock Market Analysis

      StockEdge Version Update : 9.0

      StockEdge Version Update : 9.0

      Powerful Investment Themes for Retail Investors

      Powerful Investment Themes for Retail Investors

      SE Blog- How to beat the street with Sector Rotation Strategy.

      SE Blog- How to beat the street with Sector Rotation Strategy.

      StockEdge Version Update 8.3

      StockEdge Version Update 8.3

      StockEdge Version Update 8.2

      StockEdge Version Update 8.2

      Using Investor Portfolios Section to track Big Bulls like Rakesh Jhunjhunwala

      Using Investor Portfolios Section to track Big Bulls like Rakesh Jhunjhunwala

      StockEdge Version 8.1 – It keeps getting Better & Better

      StockEdge Version 8.1 – It keeps getting Better & Better

      StockEdge Version Update 8.0 – Like never before

      StockEdge Version Update 8.0 – Like never before

    • Mutual Fund
      Top 5 Mutual Funds for 2022 where you can start your SIP

      Top 5 Mutual Funds for 2022 where you can start your SIP

      What are Value Funds and its Advantages?

      What are Value Funds and its Advantages?

      A Beginners Guide to Thematic Funds

      A Beginners Guide to Thematic Funds

      Understanding Sector Funds and their Benefits to our Portfolio

      Understanding Sector Funds and their Benefits to our Portfolio

      Are Dividend Yield Funds a good option to invest in?

      Are Dividend Yield Funds a good option to invest in?

      What are Contra Funds and their advantages?

      What are Contra Funds and their advantages?

      Trending Tags

      No Result
      View All Result
      StockEdge Blog
      Home Tutorials
      differences between values

      Relationship between Face Value, Book Value and Market Value

      StockEdge by StockEdge
      January 11, 2019
      Reading Time: 6 mins read
      17.1k
      VIEWS
      Share on FacebookShare on TwitterShare On WhatsApp

      Table of Contents

      • Face Value (FV)
        • Face Value = Equity share capital / Number of shares outstanding
      • Book Value (BV)
      • Market Value
      • The relationship between market value, face value, and book value:
      • Comparing Book Value and Market Value
      • StockEdge App
      • Bottom line
      Introducing StockEdge Pro Introducing StockEdge Pro Introducing StockEdge Pro

      We often come across terms like Face Value, Book Value, and Market Value in finance. Many really get confused while others consider all three terms to be the same. So let us understand:

      What these terms mean?

       Whether they can be used interchangeably and if not then what is the book value, face value, and market value difference?

      How important it is to understand the difference and whether these terms help us to pick better stocks?

      Face Value (FV)

      Face Value is the nominal value or par value of the stock at the time of issuing. It is the value of a company’s common stock on the balance sheet and is determined during the initial stages of the offering. It can be termed as the original cost of the stock. It does not denote the actual market value.

      The FV of a stock does not fluctuate and undergoes changes if the company goes in for a stock split or reverse stock split. The stock is split keeping in mind the face value and not market value. For instance, if the stock’s face value is Rs 10, and there is a 1:2 split, its face value will change to Rs 2. Accordingly, market value also gets adjusted.

      The dividend is usually quoted per share or as a percentage of the face value of the share and not on market value. For instance, if a company declares a dividend of 100% with a face value of Rs 10, then the dividend amount will be Rs 10 per share. Thus, it is always in the interest of the investors to look at the dividend amount and not dividend percentage.

      Face Value is calculated using two important numbers: (i) Equity share capital (ii) Number of shares outstanding.

      Face Value = Equity share capital / Number of shares outstanding

      Thus, face value is nothing but Equity Share Capital per share. It is a static theoretical number.

      Book Value (BV)

      Book value literally means the value of a business according to its books (accounts) that is reflected through its financial statements or its net worth. Theoretically, it represents the total amount a company is worth if all its assets are sold and all the liabilities are paid back. In other words, it reflects the firm’s Free equity. Fluctuation in Book Value is infrequent and changes annually, as per business performance.

      BV can be helpful in determining whether the company’s stock is overvalued, undervalued or fairly valued. One must note that if the company is having a component of minority interest that is profit in the books because of any sister concern under it, that value must be further deducted to arrive at the right book value.

      Book Value can be calculated in two ways:

      (i) Book Value = Total Assets – (Total Liabilities – Current Liabilities)

      (ii) Book Value per share = Face Value + Reserve per share

      The second formula establishes a relationship between Book Value and Face Value.

      Few issues with book value are that the figure is reported at an annual frequency. It is only after the reporting that an investor would know how the company’s book value has changed over time. It is an accounting item and is subject to adjustments which may not be easy to understand and assess. For the calculation of book value, only tangible assets are taken into consideration so it is not very useful for businesses relying heavily on human capital.

      See also: Book Value Per Share

      Market Value

      Market Value is the current price of the stock quoted on exchange and may or may not reflect the fair value of the stock. It represents the company’s worth. MV constantly changes with the movement in the stock market. In the short term it will change every moment as per the whims of the market sentiment and in the long term, it is driven by business performance. It is the market price of the stock at which we buy or sell the stock. Hence, this is the most important data when it comes to stock trading. Market Value of a company is calculated as:

      Market Value = Current Stock Price * Number of shares outstanding

      MV is also known as Market Capitalization.

      Market value considers both tangible as well as intangible assets. However, the basis of market value is not definite. There are n numbers of factors that influence the market value of a company like profitability, performance, liquidity or even simple news which can increase or decrease its market value. Thus, one can say that the market value of a company reflects its current trend.

      The relationship between market value, face value, and book value:
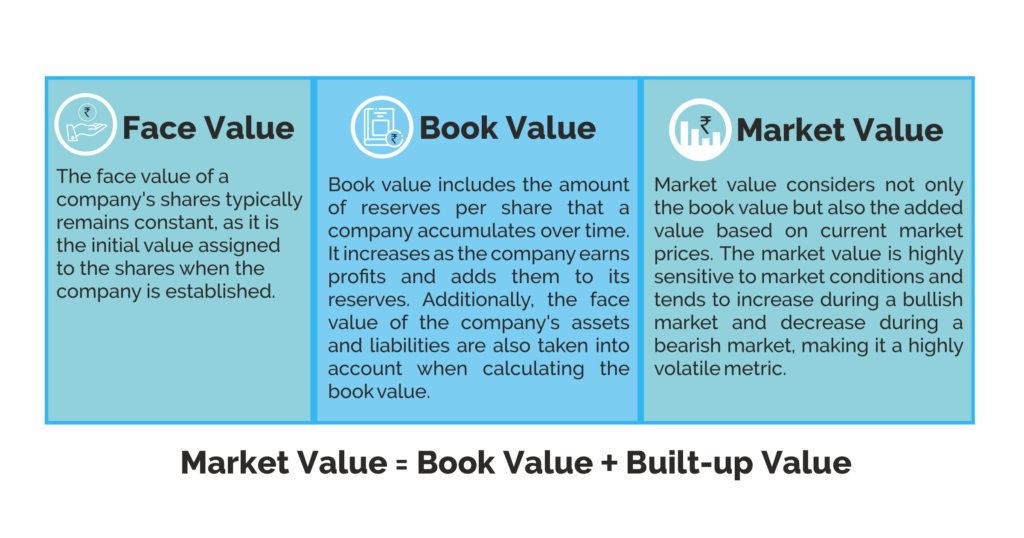
      Face Value:           It remains mostly constant.

                                          It’s the value built during the start of the company.

      Book Value:          It consists of Reserves per share which grows with time.

                                          With the addition of profits of the company the reserves grow.

                                          It also takes into account the Face Value.

      Market Value:     It takes into account Book Value as well as built value or market price.

                                         It is very volatile as it grows in a Bull market and shrinks in a Bear market.

      Thus it can be derived from the above that:

                                        Market Value = Book Value + Built-up Value.

      Comparing Book Value and Market Value

      Book Value and Market Value are compared by investors to determine whether the stock is overvalued, undervalued or fairly valued.

      (i) Market Value is lesser than Book Value: This indicates that the market is not confident about the company’s prospects. In other words, the market feels that the company is not worth the value of its books or there may not be enough future earnings. However, Value Investors look out for such companies as they feel that they are undervalued and the market is wrong about their valuation.

      (ii) Market value greater than book value: This indicates that the market is assigning a higher value to the company and its assets. In other words, investors believe that the company has excellent future prospects for growth, expansion and increased profits that eventually can raise the book value of the company. Growth investors may find such companies promising. However, it may also include overvalued or overbought stocks which are already trading at a high price.

      (iii) Market value equals book value: This indicates that the market sees no compelling reason to believe the company’s assets are better or worse than what is stated on the balance sheet. In other words, that market finds the company to be fairly valued.
      face value overview

      StockEdge App

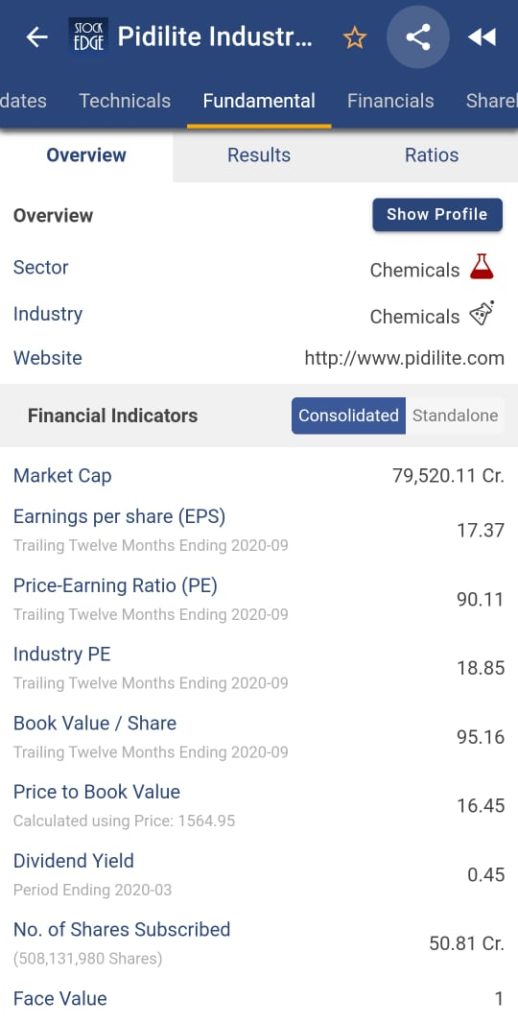
      With StockEdge app we don’t have to calculate Face Value, Book Value and Market Value of any stock. It is readily available in this APP.

      Suppose we want to look at the Face value, Book value and Market Value of Pidilite Industries Limited. First, click on the Fundamental tab and under the overview section we will get all the above-mentioned values for the stock.

      Check out our interesting features at StockEdge Web Version.

      Bottom line

      The face value of the share is least meaningful for the investor and its value is used just for bookkeeping purpose. However, book value and market value help in the determination of market sentiments for the company and provide meaningful insights into a company’s valuation. Comparing the book value to the market value of a company helps investors to determine whether a stock is overvalued or undervalued given its assets, liabilities and its ability to generate income.

      Tags: Financial ratiosfundamental conceptsfundamental ratiomarket capitalisationstock financialsStockedge appvaluation ratio
      ShareTweetSend
      Subscribe On Telegram Subscribe On Telegram Subscribe On Telegram
      Previous Post

      What’s new in version 4.1

      Next Post

      Daily Trading Strategy through Stockedge

      StockEdge

      StockEdge

      StockEdge is a self-help Equity and Mutual Fund research tool. It empowers retail investors to identify investment opportunity with all the necessary data and analytics.

      Next Post
      Daily Trading

      Daily Trading Strategy through Stockedge

      Investor Portfolios

      Investor Portfolios

      Powerful Investment Themes for Retail Investors

      Learning on the go with StockEdge!

      Leave a Reply Cancel reply

      Your email address will not be published. Required fields are marked *

      Contact Us
      • Timing (Mon-Sat): 10 am to 7 pm
      • Sales: +919830994463
      • Support: +919830994402
      • Club Support: +916289906895
      • Affiliate: +917003567131
      Recent Posts
      Top performing blue chip stocks to buy and invest in 2023
      Top 5 Blue Chip Stocks to Buy and Invest in 2023
      Budget 2023: Stocks to keep an eye on
      Important Links
      • StockEdge.com
      • StockEdge Premium
      • - Quarterly Membership
      • - Annual Membership
      • StockEdge Analyst
      • StockEdge Club
      • Compare Plans
      An Initiative Of

      © 2023 Kredent InfoEdge Pvt Ltd.

      Facebook-f Twitter Instagram Linkedin-in Youtube Pinterest-p

      Get StockEdge App

      No Result
      View All Result
      • Home
      • Article Categories
        • Fundamental Analysis
        • Technical Analysis
        • Market Themes
        • StockEdge Tutorials
        • StockEdge Version Updates
      • Products
        • StockEdge Premium
        • StockEdge Pro
        • StockEdge Club
        • Compare Plans
      • Visit StockEdge.com

      © 2023 Kredent InfoEdge Pvt Ltd.