StockEdge.com
  • Products
    • StockEdge Premium
    • StockEdge Pro
    • StockEdge Club
    • Compare Plans
StockEdge Blog
  • Trending Stocks
  • Insights
    • All
    • Business Houses
    • Markets themes
    • Stock Insights
    Top 5 Textile stocks

    Top 5 Textile Stocks in India: From Cotton to Cash

    multi-bagger stocks for 2025

    5 Multibagger Stocks to keep an eagle-eye for 2025

    Jindal Saw – Strong Earnings Momentum Ahead

    Jindal Saw – Strong Earnings Momentum Ahead

    Kirloskar Group- A Legacy of 134 Years

    Kirloskar Group- A Legacy of 134 Years

    renewable energy stocks in india

    Top Renewable Energy Stocks in India

    blue chip stocks

    Top 5 Blue Chip Stocks to Buy and Invest in 2023

    Budget 2023: Stocks to keep an eye on

    Budget 2023: Stocks to keep an eye on

    Adani Enterprises FPO: Detailed Analysis, GMP and Review?

    Adani Enterprises FPO: Detailed Analysis, GMP and Review?

    Top 5 Defence Stocks to Invest in India

    Top 5 Defence Stocks to Invest in India

  • Technical Analysis
    Chart Patterns – Holy grail of Stock Market Analysis

    Chart Patterns – Holy grail of Stock Market Analysis

    StockEdge Version Update : 9.0

    StockEdge Version Update : 9.0

    Beat the street with Sector Rotation Strategy

    Beat the street with Sector Rotation Strategy

    StockEdge Version Update 8.2

    StockEdge Version Update 8.2

    Derivative Analytics

    An Insightful Research Tool For Derivative Analytics

    Introducing Put-Call Ratio a Derivative Indicator in the Market

    Introducing Put-Call Ratio a Derivative Indicator in the Market

    A Powerful Technical Indicator Beta & Beta Scans

    A Powerful Technical Indicator Beta & Beta Scans

    Technical Analysis using Edge Charts

    Technical Analysis using Edge Charts

    adaptive relative strength and static relative strength scans

    What is Adaptive Relative Strength & Static Relative Strength Scans?

  • Fundamental Analysis
    • All
    • Cash Flow Ratios
    • Efficiency ratios
    • Growth Ratios
    • Liquidity Ratios
    • Return Ratios
    • Solvency ratios
    • Valuation Ratios
    high dividend paying stocks

    Identifying High Dividend Paying Stocks

    Understanding the Importance of creating Fundamental Scans

    Understanding the Importance of creating Fundamental Scans

    Using My Combination Scan to Identify best in an Industry

    Using My Combination Scan to Identify best in an Industry

    Cost Income ratio

    Cost to Income Ratio(%)

    Cost of Liability

    Cost of Liabilities (%)

    Operating Cost to Assets Ratio (%)

    Operating Cost to Assets Ratio (%)

  • StockEdge Tutorials
    StockEdge Club: An Exclusive Investors Hub & Analytics platform

    StockEdge Club: An Exclusive Investors Hub & Analytics platform

    FII/DII Data: Leading Indicators of Stock Market

    FII/DII Data: Leading Indicators of Stock Market

    Chart Patterns – Holy grail of Stock Market Analysis

    Chart Patterns – Holy grail of Stock Market Analysis

    StockEdge Version Update : 9.0

    StockEdge Version Update : 9.0

    Powerful Investment Themes for Retail Investors

    Powerful Investment Themes for Retail Investors

    Beat the street with Sector Rotation Strategy

    Beat the street with Sector Rotation Strategy

    StockEdge Version Update 8.3

    StockEdge Version Update 8.3

    StockEdge Version Update 8.2

    StockEdge Version Update 8.2

    Using Investor Portfolios Section to track Big Bulls like Rakesh Jhunjhunwala

    Using Investor Portfolios Section to track Big Bulls like Rakesh Jhunjhunwala

  • Mutual Fund
    Top 5 Mutual Funds for 2022 where you can start your SIP

    Top 5 Mutual Funds for 2022 where you can start your SIP

    What are Value Funds and its Advantages?

    What are Value Funds and its Advantages?

    thematic funds

    Thematic Funds : Everything you need to know

    Understanding Sector Funds and their Benefits to our Portfolio

    Understanding Sector Funds and their Benefits to our Portfolio

    Are Dividend Yield Funds a good option to invest in?

    Are Dividend Yield Funds a good option to invest in?

    What are Contra Funds and their advantages?

    What are Contra Funds and their advantages?

    Trending Tags

    No Result
    View All Result
    • Trending Stocks
    • Insights
      • All
      • Business Houses
      • Markets themes
      • Stock Insights
      Top 5 Textile stocks

      Top 5 Textile Stocks in India: From Cotton to Cash

      multi-bagger stocks for 2025

      5 Multibagger Stocks to keep an eagle-eye for 2025

      Jindal Saw – Strong Earnings Momentum Ahead

      Jindal Saw – Strong Earnings Momentum Ahead

      Kirloskar Group- A Legacy of 134 Years

      Kirloskar Group- A Legacy of 134 Years

      renewable energy stocks in india

      Top Renewable Energy Stocks in India

      blue chip stocks

      Top 5 Blue Chip Stocks to Buy and Invest in 2023

      Budget 2023: Stocks to keep an eye on

      Budget 2023: Stocks to keep an eye on

      Adani Enterprises FPO: Detailed Analysis, GMP and Review?

      Adani Enterprises FPO: Detailed Analysis, GMP and Review?

      Top 5 Defence Stocks to Invest in India

      Top 5 Defence Stocks to Invest in India

    • Technical Analysis
      Chart Patterns – Holy grail of Stock Market Analysis

      Chart Patterns – Holy grail of Stock Market Analysis

      StockEdge Version Update : 9.0

      StockEdge Version Update : 9.0

      Beat the street with Sector Rotation Strategy

      Beat the street with Sector Rotation Strategy

      StockEdge Version Update 8.2

      StockEdge Version Update 8.2

      Derivative Analytics

      An Insightful Research Tool For Derivative Analytics

      Introducing Put-Call Ratio a Derivative Indicator in the Market

      Introducing Put-Call Ratio a Derivative Indicator in the Market

      A Powerful Technical Indicator Beta & Beta Scans

      A Powerful Technical Indicator Beta & Beta Scans

      Technical Analysis using Edge Charts

      Technical Analysis using Edge Charts

      adaptive relative strength and static relative strength scans

      What is Adaptive Relative Strength & Static Relative Strength Scans?

    • Fundamental Analysis
      • All
      • Cash Flow Ratios
      • Efficiency ratios
      • Growth Ratios
      • Liquidity Ratios
      • Return Ratios
      • Solvency ratios
      • Valuation Ratios
      high dividend paying stocks

      Identifying High Dividend Paying Stocks

      Understanding the Importance of creating Fundamental Scans

      Understanding the Importance of creating Fundamental Scans

      Using My Combination Scan to Identify best in an Industry

      Using My Combination Scan to Identify best in an Industry

      Cost Income ratio

      Cost to Income Ratio(%)

      Cost of Liability

      Cost of Liabilities (%)

      Operating Cost to Assets Ratio (%)

      Operating Cost to Assets Ratio (%)

    • StockEdge Tutorials
      StockEdge Club: An Exclusive Investors Hub & Analytics platform

      StockEdge Club: An Exclusive Investors Hub & Analytics platform

      FII/DII Data: Leading Indicators of Stock Market

      FII/DII Data: Leading Indicators of Stock Market

      Chart Patterns – Holy grail of Stock Market Analysis

      Chart Patterns – Holy grail of Stock Market Analysis

      StockEdge Version Update : 9.0

      StockEdge Version Update : 9.0

      Powerful Investment Themes for Retail Investors

      Powerful Investment Themes for Retail Investors

      Beat the street with Sector Rotation Strategy

      Beat the street with Sector Rotation Strategy

      StockEdge Version Update 8.3

      StockEdge Version Update 8.3

      StockEdge Version Update 8.2

      StockEdge Version Update 8.2

      Using Investor Portfolios Section to track Big Bulls like Rakesh Jhunjhunwala

      Using Investor Portfolios Section to track Big Bulls like Rakesh Jhunjhunwala

    • Mutual Fund
      Top 5 Mutual Funds for 2022 where you can start your SIP

      Top 5 Mutual Funds for 2022 where you can start your SIP

      What are Value Funds and its Advantages?

      What are Value Funds and its Advantages?

      thematic funds

      Thematic Funds : Everything you need to know

      Understanding Sector Funds and their Benefits to our Portfolio

      Understanding Sector Funds and their Benefits to our Portfolio

      Are Dividend Yield Funds a good option to invest in?

      Are Dividend Yield Funds a good option to invest in?

      What are Contra Funds and their advantages?

      What are Contra Funds and their advantages?

      Trending Tags

      No Result
      View All Result
      StockEdge Blog
      Home Tutorials
      Efficiency Scan

      How to Analyse Efficiency Ratios?

      StockEdge by StockEdge
      October 9, 2018
      Reading Time: 6 mins read
      785
      VIEWS
      Share on FacebookShare on TwitterShare On WhatsApp

      Table of Contents

      • What is efficiency?
      • Understanding Efficiency Scan Constituents
      • Understanding the Constituents
      • What is Account Receivables?
      • Formula
      • What is Account Payables
        • Formula
        • What is Inventory
        • Formula
          • See also: Working Capital
        • What is Working Capital
        • Formula

      What is efficiency?

      No, I am not talking about mine or your efficiency.

      I am talking about the efficiency of a company. An efficient company gives better returns. Now I know your next question would be how we can find these kinds of companies.

      Well, let me help you to understand it in detail. If a company is efficient it can stay afloat for a longer period of time.  You can filter efficient companies by using efficiency ratio of our app Stockedge and it will help you with your investment decisions in a flicker of a second.

      Understanding Efficiency Scan Constituents

      The Efficiency scans deals with the efficiency in filtering companies based on their Accounts receivables, Accounts Payables, Inventories and Working Capital. Now Accounts receivables deals with the payments that a company has to receive against services rendered or products sold to clients, which means the credit the client owes. Accounts Payables means the payment that a company has to render against its credits. Inventories take into account the goods remaining with the company after the end of the Quarter or Year. Inventories are those which could not be turned into sales as did not get processed into finished products.

      Understanding the Constituents

      Now I would like to explain what each one explains about the modus operandi about the company.

      A company is said to be efficient if days of receivables are decreasing.
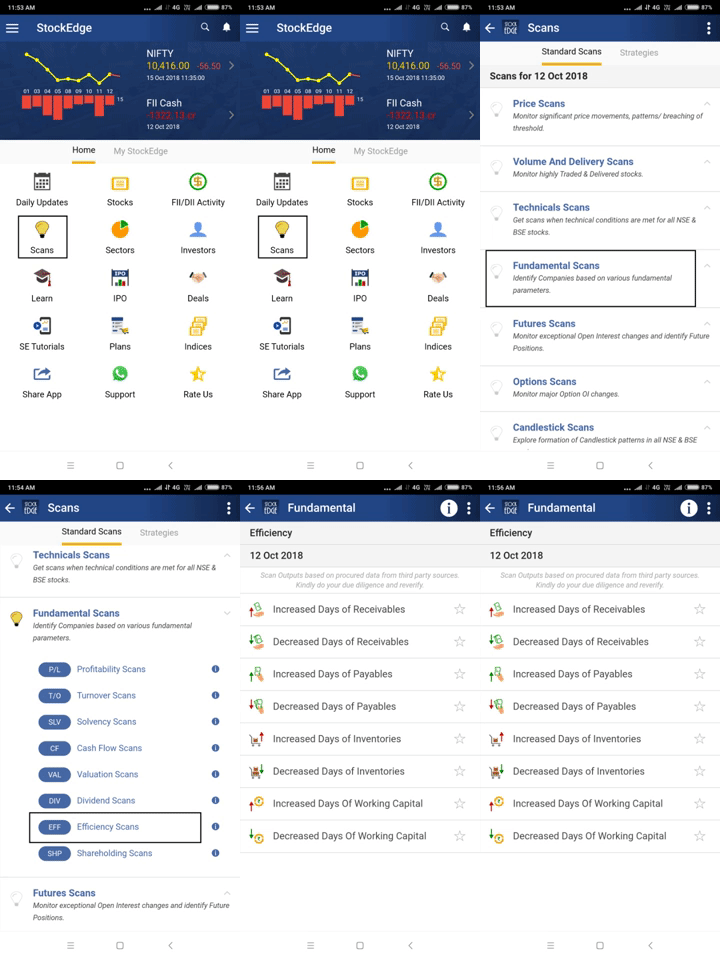
      efficiency ratio on StockEdge

      What is Account Receivables?

      Account Receivables is an accounting term. It is a balance sheet item and comes under the head currents assets. Now understand its impact in detail.

      • Increased days of Receivables means that debtors are taking more time to repay for the goods consumed thus increasing working capital requirement which puts stress in the company’s books. It can also create liquidity crunch for the company. If Account Receivables go on rising it can end in default by some debtors leading to bad debts for the company.
      • Decreased days of receivables means that the debtors are making the payments as per the specified time frame or even early thereby reducing the need for working capital requirement which is a healthy sign for the company’s books. It improves or rather don’t detoriate the liquidity of the company. Thus companies with decreased days of receivables should be filtered for investments.

      Formula

      Days of Accounts Receivables= (Accounts Receivables/Credit Sales)* No. Of days in a year

      What is Account Payables

      Account Payables is an accounting term. It is a balance sheet Item and comes under the head current liabilities. Now understand its impact in detail.

      • Increased days of payables mean that the company is taking longer time to repay for the goods purchased on credits from its suppliers which sends a negative signal about the company’s liquidity position. It means the company does not have the required cash flow to meet its short term debt obligations.
      • Decreased days of payables means the company’s liquidity is strong thus its able to repay its creditors diligently. It also means that the company has the ability to fulfil its short term debt obligations. Thus one should monitor this closely to understand the company’s financial strength.

      Thus companies with decreased days of payables should be filtered for good returns.

      Formula

      Days of Accounts Payables= (Account Payables/Cost of goods sold) * No of days in a year

      What is Inventory

      Inventory is the term used for the raw materials which is in turn used to make finished product for sale purpose. Thus the goods which could not be sold are termed as Inventory. Thus turnover of Inventory represents how fast it can be converted to sales to generate earnings for the company. Inventory is a balance sheet item.

      • Increased days of Inventories mean that the company is unable to convert its goods into sales as it has purchased more than it can sell. Thus the cash flow is impacted negatively if Inventory turnover ratio increases. It raises concern about the company’s ability to convert its inventory to sales if the Inventory turnover ratio continues to increase.
      • Decreased days of Inventory mean that the demand for the product is robust and thus company is able to convert its inventory into sales and thus decreasing inventory turnover ratio hence increasing earning as well as cash flow.

      Thus companies with decreased days of Inventory should be filtered to make investments.

      Formula

      Inventory Turnover ratio=Cost of goods Sold/ Average Inventory

      See also: Working Capital

      What is Working Capital

      Working Capital is the short term component required to meet the daily requirements of a business from purchasing of Inventory to sales of goods. It is a measure of a company’s liquidity and operating efficiencies and its short-term financial health.

      Formula

      Working Capital= Current Assets – Current Liabilities

      • If the working capital is positive, it implies that the current assets are greater than current liabilities and the company is able to meet all its current obligations and run the company operation. It is a positive for the company.
      • If the working capital of the company is negative, it implies that the current assets are or sufficient enough to cover the current liabilities and hence these are affecting the operation of the company. This is viewed as a negative for the company and the business of the company will be affected.

      Bottomline

      Thus to filter out Efficient stocks and stay safe in volatile times and make good investment decisions subscribe to Stockedge. If you still do not have the StockEdge app, download it right now to use this feature. It is a part of the premium offering of StockEdge App.

      Click here to know more about the Premium offering of StockEdge.

      You can check out the desktop version of StockEdge using this link.

      Tags: Accounts PayablesAccounts receivablesEfficiency ScanInventory Turnover ratioStockEdge
      ShareTweetSend
      Subscribe On Telegram Subscribe On Telegram Subscribe On Telegram
      Previous Post

      What is Valuation Scans?

      Next Post

      Why is it important invest in Companies with positive Cash Flow

      StockEdge

      StockEdge

      StockEdge is a self-help Equity and Mutual Fund research tool. It empowers retail investors to identify investment opportunity with all the necessary data and analytics.

      Next Post
      Cash Flow Scan

      Why is it important invest in Companies with positive Cash Flow

      days of payables

      Days of Payables

      Earnings per Share

      Earnings per Share

      Leave a Reply Cancel reply

      Your email address will not be published. Required fields are marked *

      Contact Us
      • Timing (Mon-Sat): 10 am to 7 pm
      • Sales: +919830994463
      • Support: +919830994402
      • Club Support: +916289906895
      • Affiliate: +917003567131
      Recent Posts
      Top 5 Textile stocks
      Top 5 Textile Stocks in India: From Cotton to Cash
      multi-bagger stocks for 2025
      5 Multibagger Stocks to keep an eagle-eye for 2025
      Important Links
      • StockEdge.com
      • StockEdge Premium
      • - Quarterly Membership
      • - Annual Membership
      • StockEdge Analyst
      • StockEdge Club
      • Compare Plans
      An Initiative Of

      © 2023 Kredent InfoEdge Pvt Ltd.

      Facebook-f Twitter Instagram Linkedin-in Youtube Pinterest-p

      Get StockEdge App

      No Result
      View All Result
      • Home
      • Article Categories
        • Fundamental Analysis
        • Technical Analysis
        • Market Themes
        • StockEdge Tutorials
        • StockEdge Version Updates
      • Products
        • StockEdge Premium
        • StockEdge Pro
        • StockEdge Club
        • Compare Plans
      • Visit StockEdge.com

      © 2023 Kredent InfoEdge Pvt Ltd.