StockEdge.com
  • Products
    • StockEdge Premium
    • StockEdge Pro
    • StockEdge Club
    • Compare Plans
StockEdge Blog
  • Trending Stocks
  • Insights
    • All
    • Business Houses
    • Markets themes
    • Stock Insights
    Top 5 Textile stocks

    Top 5 Textile Stocks in India: From Cotton to Cash

    multi-bagger stocks for 2025

    5 Multibagger Stocks to keep an eagle-eye for 2025

    Jindal Saw – Strong Earnings Momentum Ahead

    Jindal Saw – Strong Earnings Momentum Ahead

    Kirloskar Group- A Legacy of 134 Years

    Kirloskar Group- A Legacy of 134 Years

    renewable energy stocks in india

    Top Renewable Energy Stocks in India

    blue chip stocks

    Top 5 Blue Chip Stocks to Buy and Invest in 2023

    Budget 2023: Stocks to keep an eye on

    Budget 2023: Stocks to keep an eye on

    Adani Enterprises FPO: Detailed Analysis, GMP and Review?

    Adani Enterprises FPO: Detailed Analysis, GMP and Review?

    Top 5 Defence Stocks to Invest in India

    Top 5 Defence Stocks to Invest in India

  • Technical Analysis
    Chart Patterns – Holy grail of Stock Market Analysis

    Chart Patterns – Holy grail of Stock Market Analysis

    StockEdge Version Update : 9.0

    StockEdge Version Update : 9.0

    Beat the street with Sector Rotation Strategy

    Beat the street with Sector Rotation Strategy

    StockEdge Version Update 8.2

    StockEdge Version Update 8.2

    Derivative Analytics

    An Insightful Research Tool For Derivative Analytics

    Introducing Put-Call Ratio a Derivative Indicator in the Market

    Introducing Put-Call Ratio a Derivative Indicator in the Market

    A Powerful Technical Indicator Beta & Beta Scans

    A Powerful Technical Indicator Beta & Beta Scans

    Technical Analysis using Edge Charts

    Technical Analysis using Edge Charts

    adaptive relative strength and static relative strength scans

    What is Adaptive Relative Strength & Static Relative Strength Scans?

  • Fundamental Analysis
    • All
    • Cash Flow Ratios
    • Efficiency ratios
    • Growth Ratios
    • Liquidity Ratios
    • Return Ratios
    • Solvency ratios
    • Valuation Ratios
    high dividend paying stocks

    Identifying High Dividend Paying Stocks

    Understanding the Importance of creating Fundamental Scans

    Understanding the Importance of creating Fundamental Scans

    Using My Combination Scan to Identify best in an Industry

    Using My Combination Scan to Identify best in an Industry

    Cost Income ratio

    Cost to Income Ratio(%)

    Cost of Liability

    Cost of Liabilities (%)

    Operating Cost to Assets Ratio (%)

    Operating Cost to Assets Ratio (%)

  • StockEdge Tutorials
    StockEdge Club: An Exclusive Investors Hub & Analytics platform

    StockEdge Club: An Exclusive Investors Hub & Analytics platform

    FII/DII Data: Leading Indicators of Stock Market

    FII/DII Data: Leading Indicators of Stock Market

    Chart Patterns – Holy grail of Stock Market Analysis

    Chart Patterns – Holy grail of Stock Market Analysis

    StockEdge Version Update : 9.0

    StockEdge Version Update : 9.0

    Powerful Investment Themes for Retail Investors

    Powerful Investment Themes for Retail Investors

    Beat the street with Sector Rotation Strategy

    Beat the street with Sector Rotation Strategy

    StockEdge Version Update 8.3

    StockEdge Version Update 8.3

    StockEdge Version Update 8.2

    StockEdge Version Update 8.2

    Using Investor Portfolios Section to track Big Bulls like Rakesh Jhunjhunwala

    Using Investor Portfolios Section to track Big Bulls like Rakesh Jhunjhunwala

  • Mutual Fund
    Top 5 Mutual Funds for 2022 where you can start your SIP

    Top 5 Mutual Funds for 2022 where you can start your SIP

    What are Value Funds and its Advantages?

    What are Value Funds and its Advantages?

    thematic funds

    Thematic Funds : Everything you need to know

    Understanding Sector Funds and their Benefits to our Portfolio

    Understanding Sector Funds and their Benefits to our Portfolio

    Are Dividend Yield Funds a good option to invest in?

    Are Dividend Yield Funds a good option to invest in?

    What are Contra Funds and their advantages?

    What are Contra Funds and their advantages?

    Trending Tags

    No Result
    View All Result
    • Trending Stocks
    • Insights
      • All
      • Business Houses
      • Markets themes
      • Stock Insights
      Top 5 Textile stocks

      Top 5 Textile Stocks in India: From Cotton to Cash

      multi-bagger stocks for 2025

      5 Multibagger Stocks to keep an eagle-eye for 2025

      Jindal Saw – Strong Earnings Momentum Ahead

      Jindal Saw – Strong Earnings Momentum Ahead

      Kirloskar Group- A Legacy of 134 Years

      Kirloskar Group- A Legacy of 134 Years

      renewable energy stocks in india

      Top Renewable Energy Stocks in India

      blue chip stocks

      Top 5 Blue Chip Stocks to Buy and Invest in 2023

      Budget 2023: Stocks to keep an eye on

      Budget 2023: Stocks to keep an eye on

      Adani Enterprises FPO: Detailed Analysis, GMP and Review?

      Adani Enterprises FPO: Detailed Analysis, GMP and Review?

      Top 5 Defence Stocks to Invest in India

      Top 5 Defence Stocks to Invest in India

    • Technical Analysis
      Chart Patterns – Holy grail of Stock Market Analysis

      Chart Patterns – Holy grail of Stock Market Analysis

      StockEdge Version Update : 9.0

      StockEdge Version Update : 9.0

      Beat the street with Sector Rotation Strategy

      Beat the street with Sector Rotation Strategy

      StockEdge Version Update 8.2

      StockEdge Version Update 8.2

      Derivative Analytics

      An Insightful Research Tool For Derivative Analytics

      Introducing Put-Call Ratio a Derivative Indicator in the Market

      Introducing Put-Call Ratio a Derivative Indicator in the Market

      A Powerful Technical Indicator Beta & Beta Scans

      A Powerful Technical Indicator Beta & Beta Scans

      Technical Analysis using Edge Charts

      Technical Analysis using Edge Charts

      adaptive relative strength and static relative strength scans

      What is Adaptive Relative Strength & Static Relative Strength Scans?

    • Fundamental Analysis
      • All
      • Cash Flow Ratios
      • Efficiency ratios
      • Growth Ratios
      • Liquidity Ratios
      • Return Ratios
      • Solvency ratios
      • Valuation Ratios
      high dividend paying stocks

      Identifying High Dividend Paying Stocks

      Understanding the Importance of creating Fundamental Scans

      Understanding the Importance of creating Fundamental Scans

      Using My Combination Scan to Identify best in an Industry

      Using My Combination Scan to Identify best in an Industry

      Cost Income ratio

      Cost to Income Ratio(%)

      Cost of Liability

      Cost of Liabilities (%)

      Operating Cost to Assets Ratio (%)

      Operating Cost to Assets Ratio (%)

    • StockEdge Tutorials
      StockEdge Club: An Exclusive Investors Hub & Analytics platform

      StockEdge Club: An Exclusive Investors Hub & Analytics platform

      FII/DII Data: Leading Indicators of Stock Market

      FII/DII Data: Leading Indicators of Stock Market

      Chart Patterns – Holy grail of Stock Market Analysis

      Chart Patterns – Holy grail of Stock Market Analysis

      StockEdge Version Update : 9.0

      StockEdge Version Update : 9.0

      Powerful Investment Themes for Retail Investors

      Powerful Investment Themes for Retail Investors

      Beat the street with Sector Rotation Strategy

      Beat the street with Sector Rotation Strategy

      StockEdge Version Update 8.3

      StockEdge Version Update 8.3

      StockEdge Version Update 8.2

      StockEdge Version Update 8.2

      Using Investor Portfolios Section to track Big Bulls like Rakesh Jhunjhunwala

      Using Investor Portfolios Section to track Big Bulls like Rakesh Jhunjhunwala

    • Mutual Fund
      Top 5 Mutual Funds for 2022 where you can start your SIP

      Top 5 Mutual Funds for 2022 where you can start your SIP

      What are Value Funds and its Advantages?

      What are Value Funds and its Advantages?

      thematic funds

      Thematic Funds : Everything you need to know

      Understanding Sector Funds and their Benefits to our Portfolio

      Understanding Sector Funds and their Benefits to our Portfolio

      Are Dividend Yield Funds a good option to invest in?

      Are Dividend Yield Funds a good option to invest in?

      What are Contra Funds and their advantages?

      What are Contra Funds and their advantages?

      Trending Tags

      No Result
      View All Result
      StockEdge Blog
      Home Tutorials
      Earnings per Share

      Earnings per Share

      StockEdge by StockEdge
      October 22, 2018
      Reading Time: 3 mins read
      995
      VIEWS
      Share on FacebookShare on TwitterShare On WhatsApp

      Table of Contents

      • Earnings per Share (Rs)
      • Impact of Earnings per Share (Rs)
      • Formula:
        • StockEdge App
        • Bottomline

      Earning per share is a very important parameter in a valuation ratio. It is an important parameter of fundamental analysis. Valuation ratios are used to determine the right price or time to enter into any stock. It is used to measure the right valuation metrics required to generate best return for your investment. We will discuss about one such ratio known as earnings per share which is one of the valued tool to determine the investment rationale behind any stock.

      Earnings per Share (Rs)

      Earnings per Share (Rs) measures the amount of net income earned per share of stock outstanding. In other words, this is the amount of money each share of stock would receive if all of the profits were distributed to the outstanding shares at the end of the year. EPS is calculated as Net profit divided by weighted average shares outstanding (as the number of outstanding shares keeps changing).

      You can also watch the below video on Everything you want to know about Earnings Per Share (EPS):

      Impact of Earnings per Share (Rs)

      Earnings per share is also a calculation that shows how profitable a company is on a shareholder basis. So a larger company’s profits per share can be compared to smaller company’s profits per share. Obviously, this calculation is heavily influenced on how many shares are outstanding. Thus, a larger company will have to split its earning amongst many more shares of stock compared to a smaller company.

      There are basically three types of EPS:

      1. Basic EPS: It is a rough measurement of company’s profit that can be allocated to one share of its stock. It does not factor in the diluted effect of convertible securities. Basic EPS is calculated as follows:

      Basic EPS = (Net income – Preference dividend) / Weighted average no of share outstanding

      1. Diluted EPS: If a company has complex capital structure i.e. they have issued potentially dilutive securities, then diluted EPS is considered to be more precise metric than basic EPS. It takes into account all the outstanding diluted securities that could preferably be exercised and shows how such action would affect earnings per share. It can be calculated as:

      Diluted EPS = {Net income – preference dividend (which are not convertible) + Interest on debenture (if such debenture is convertible)} / (Weighted average no of share outstanding + conversion of diluted securities)

      1. Cash EPS: Cash EPS or more commonly operating cash flow per share measures financial performance of the company. Free from non-cash items like depreciation which is included in basic EPS calculation, cash EPS may prove to be more reliable measure of financial and operational health of the company.

      Higher the company’s cash EPS, better it is considered to have performed over a period. Formula for calculating company’s cash EPS is:

      Cash EPS = Operating cash flow / Diluted shares outstanding

      Formula:

      EPS = (Net Income – Preferred dividends)/ Weighted average number of common shares outstanding

      ABC Ltd has a net income of 1 million in the third quarter. The company announces preferred dividends of Rs 250,000. Total shares issued for the period was 12,000,000, with total shares outstanding at 11,000,000.

      The EPS of ABC Ltd. would be:

      ​EPS = (1,000,000 – 250,000) / 11,000,000
      EPS = Rs 0.068

      StockEdge App

      We don’t have to calculate Earnings per Share on our own. StockEdge gives Earnings per Share of the last five years of any company listed in the stock exchange. We can look and compare Earnings per Share of any company and filter out stocks accordingly.

      Suppose we want to look at Earnings per Share of Just Dial Ltd. of last 5 years. In the Fundamental tab of Just Dial Ltd., click on the fundamentals tab, we will get Ratios tab.  Then in the Ratios tab click on Efficiency Ratios, Earnings per Share of Just Dial Ltd will show in a flicker of a second.
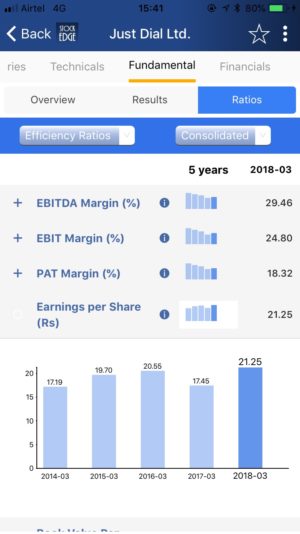
      earnings per share of Just Dial

      Bottomline

      Earnings per Share is considered as the single most important variable determining the share price. It is also used in evaluating the company as it break downs profits per share basis. If you still do not have the StockEdge app, download it right now to use this feature. It is a part of the free offering of StockEdge App.

      Click to subscribe: https://www.stockedge.com

      If you want to know more about this then click on this link: https://www.youtube.com/watch?v=at1FkJE5AjI

      Tags: Earnings per shareEfficiency RatiosEPSStockEdge
      ShareTweetSend
      Subscribe On Telegram Subscribe On Telegram Subscribe On Telegram
      Previous Post

      Days of Payables

      Next Post

      Days of Receivables

      StockEdge

      StockEdge

      StockEdge is a self-help Equity and Mutual Fund research tool. It empowers retail investors to identify investment opportunity with all the necessary data and analytics.

      Next Post
      Asset turnover ratio

      Days of Receivables

      Asset turnover ratio

      Days of Inventory

      EBIDTA growth

      EBITDA Growth (%)

      Comments 2

      1. Suresh Chauhan says:
        4 years ago

        I wish to join online course on stock trading

        Reply
        • Surbhi Lohia says:
          3 years ago

          Hello Sir, for that you can check courses on http://www.elearnmarkets.com

          Reply

      Leave a Reply Cancel reply

      Your email address will not be published. Required fields are marked *

      Contact Us
      • Timing (Mon-Sat): 10 am to 7 pm
      • Sales: +919830994463
      • Support: +919830994402
      • Club Support: +916289906895
      • Affiliate: +917003567131
      Recent Posts
      Top 5 Textile stocks
      Top 5 Textile Stocks in India: From Cotton to Cash
      multi-bagger stocks for 2025
      5 Multibagger Stocks to keep an eagle-eye for 2025
      Important Links
      • StockEdge.com
      • StockEdge Premium
      • - Quarterly Membership
      • - Annual Membership
      • StockEdge Analyst
      • StockEdge Club
      • Compare Plans
      An Initiative Of

      © 2023 Kredent InfoEdge Pvt Ltd.

      Facebook-f Twitter Instagram Linkedin-in Youtube Pinterest-p

      Get StockEdge App

      No Result
      View All Result
      • Home
      • Article Categories
        • Fundamental Analysis
        • Technical Analysis
        • Market Themes
        • StockEdge Tutorials
        • StockEdge Version Updates
      • Products
        • StockEdge Premium
        • StockEdge Pro
        • StockEdge Club
        • Compare Plans
      • Visit StockEdge.com

      © 2023 Kredent InfoEdge Pvt Ltd.