StockEdge.com
  • Products
    • StockEdge Premium
    • StockEdge Pro
    • StockEdge Club
    • Compare Plans
StockEdge Blog
  • Trending Stocks
  • Insights
    • All
    • Business Houses
    • Markets themes
    • Stock Insights
    Top 5 Textile stocks

    Top 5 Textile Stocks in India: From Cotton to Cash

    multi-bagger stocks for 2025

    5 Multibagger Stocks to keep an eagle-eye for 2025

    Jindal Saw – Strong Earnings Momentum Ahead

    Jindal Saw – Strong Earnings Momentum Ahead

    Kirloskar Group- A Legacy of 134 Years

    Kirloskar Group- A Legacy of 134 Years

    renewable energy stocks in india

    Top Renewable Energy Stocks in India

    blue chip stocks

    Top 5 Blue Chip Stocks to Buy and Invest in 2023

    Budget 2023: Stocks to keep an eye on

    Budget 2023: Stocks to keep an eye on

    Adani Enterprises FPO: Detailed Analysis, GMP and Review?

    Adani Enterprises FPO: Detailed Analysis, GMP and Review?

    Top 5 Defence Stocks to Invest in India

    Top 5 Defence Stocks to Invest in India

  • Technical Analysis
    Chart Patterns – Holy grail of Stock Market Analysis

    Chart Patterns – Holy grail of Stock Market Analysis

    StockEdge Version Update : 9.0

    StockEdge Version Update : 9.0

    Beat the street with Sector Rotation Strategy

    Beat the street with Sector Rotation Strategy

    StockEdge Version Update 8.2

    StockEdge Version Update 8.2

    Derivative Analytics

    An Insightful Research Tool For Derivative Analytics

    Introducing Put-Call Ratio a Derivative Indicator in the Market

    Introducing Put-Call Ratio a Derivative Indicator in the Market

    A Powerful Technical Indicator Beta & Beta Scans

    A Powerful Technical Indicator Beta & Beta Scans

    Technical Analysis using Edge Charts

    Technical Analysis using Edge Charts

    adaptive relative strength and static relative strength scans

    What is Adaptive Relative Strength & Static Relative Strength Scans?

  • Fundamental Analysis
    • All
    • Cash Flow Ratios
    • Efficiency ratios
    • Growth Ratios
    • Liquidity Ratios
    • Return Ratios
    • Solvency ratios
    • Valuation Ratios
    high dividend paying stocks

    Identifying High Dividend Paying Stocks

    Understanding the Importance of creating Fundamental Scans

    Understanding the Importance of creating Fundamental Scans

    Using My Combination Scan to Identify best in an Industry

    Using My Combination Scan to Identify best in an Industry

    Cost Income ratio

    Cost to Income Ratio(%)

    Cost of Liability

    Cost of Liabilities (%)

    Operating Cost to Assets Ratio (%)

    Operating Cost to Assets Ratio (%)

  • StockEdge Tutorials
    StockEdge Club: An Exclusive Investors Hub & Analytics platform

    StockEdge Club: An Exclusive Investors Hub & Analytics platform

    FII/DII Data: Leading Indicators of Stock Market

    FII/DII Data: Leading Indicators of Stock Market

    Chart Patterns – Holy grail of Stock Market Analysis

    Chart Patterns – Holy grail of Stock Market Analysis

    StockEdge Version Update : 9.0

    StockEdge Version Update : 9.0

    Powerful Investment Themes for Retail Investors

    Powerful Investment Themes for Retail Investors

    Beat the street with Sector Rotation Strategy

    Beat the street with Sector Rotation Strategy

    StockEdge Version Update 8.3

    StockEdge Version Update 8.3

    StockEdge Version Update 8.2

    StockEdge Version Update 8.2

    Using Investor Portfolios Section to track Big Bulls like Rakesh Jhunjhunwala

    Using Investor Portfolios Section to track Big Bulls like Rakesh Jhunjhunwala

  • Mutual Fund
    Top 5 Mutual Funds for 2022 where you can start your SIP

    Top 5 Mutual Funds for 2022 where you can start your SIP

    What are Value Funds and its Advantages?

    What are Value Funds and its Advantages?

    thematic funds

    Thematic Funds : Everything you need to know

    Understanding Sector Funds and their Benefits to our Portfolio

    Understanding Sector Funds and their Benefits to our Portfolio

    Are Dividend Yield Funds a good option to invest in?

    Are Dividend Yield Funds a good option to invest in?

    What are Contra Funds and their advantages?

    What are Contra Funds and their advantages?

    Trending Tags

    No Result
    View All Result
    • Trending Stocks
    • Insights
      • All
      • Business Houses
      • Markets themes
      • Stock Insights
      Top 5 Textile stocks

      Top 5 Textile Stocks in India: From Cotton to Cash

      multi-bagger stocks for 2025

      5 Multibagger Stocks to keep an eagle-eye for 2025

      Jindal Saw – Strong Earnings Momentum Ahead

      Jindal Saw – Strong Earnings Momentum Ahead

      Kirloskar Group- A Legacy of 134 Years

      Kirloskar Group- A Legacy of 134 Years

      renewable energy stocks in india

      Top Renewable Energy Stocks in India

      blue chip stocks

      Top 5 Blue Chip Stocks to Buy and Invest in 2023

      Budget 2023: Stocks to keep an eye on

      Budget 2023: Stocks to keep an eye on

      Adani Enterprises FPO: Detailed Analysis, GMP and Review?

      Adani Enterprises FPO: Detailed Analysis, GMP and Review?

      Top 5 Defence Stocks to Invest in India

      Top 5 Defence Stocks to Invest in India

    • Technical Analysis
      Chart Patterns – Holy grail of Stock Market Analysis

      Chart Patterns – Holy grail of Stock Market Analysis

      StockEdge Version Update : 9.0

      StockEdge Version Update : 9.0

      Beat the street with Sector Rotation Strategy

      Beat the street with Sector Rotation Strategy

      StockEdge Version Update 8.2

      StockEdge Version Update 8.2

      Derivative Analytics

      An Insightful Research Tool For Derivative Analytics

      Introducing Put-Call Ratio a Derivative Indicator in the Market

      Introducing Put-Call Ratio a Derivative Indicator in the Market

      A Powerful Technical Indicator Beta & Beta Scans

      A Powerful Technical Indicator Beta & Beta Scans

      Technical Analysis using Edge Charts

      Technical Analysis using Edge Charts

      adaptive relative strength and static relative strength scans

      What is Adaptive Relative Strength & Static Relative Strength Scans?

    • Fundamental Analysis
      • All
      • Cash Flow Ratios
      • Efficiency ratios
      • Growth Ratios
      • Liquidity Ratios
      • Return Ratios
      • Solvency ratios
      • Valuation Ratios
      high dividend paying stocks

      Identifying High Dividend Paying Stocks

      Understanding the Importance of creating Fundamental Scans

      Understanding the Importance of creating Fundamental Scans

      Using My Combination Scan to Identify best in an Industry

      Using My Combination Scan to Identify best in an Industry

      Cost Income ratio

      Cost to Income Ratio(%)

      Cost of Liability

      Cost of Liabilities (%)

      Operating Cost to Assets Ratio (%)

      Operating Cost to Assets Ratio (%)

    • StockEdge Tutorials
      StockEdge Club: An Exclusive Investors Hub & Analytics platform

      StockEdge Club: An Exclusive Investors Hub & Analytics platform

      FII/DII Data: Leading Indicators of Stock Market

      FII/DII Data: Leading Indicators of Stock Market

      Chart Patterns – Holy grail of Stock Market Analysis

      Chart Patterns – Holy grail of Stock Market Analysis

      StockEdge Version Update : 9.0

      StockEdge Version Update : 9.0

      Powerful Investment Themes for Retail Investors

      Powerful Investment Themes for Retail Investors

      Beat the street with Sector Rotation Strategy

      Beat the street with Sector Rotation Strategy

      StockEdge Version Update 8.3

      StockEdge Version Update 8.3

      StockEdge Version Update 8.2

      StockEdge Version Update 8.2

      Using Investor Portfolios Section to track Big Bulls like Rakesh Jhunjhunwala

      Using Investor Portfolios Section to track Big Bulls like Rakesh Jhunjhunwala

    • Mutual Fund
      Top 5 Mutual Funds for 2022 where you can start your SIP

      Top 5 Mutual Funds for 2022 where you can start your SIP

      What are Value Funds and its Advantages?

      What are Value Funds and its Advantages?

      thematic funds

      Thematic Funds : Everything you need to know

      Understanding Sector Funds and their Benefits to our Portfolio

      Understanding Sector Funds and their Benefits to our Portfolio

      Are Dividend Yield Funds a good option to invest in?

      Are Dividend Yield Funds a good option to invest in?

      What are Contra Funds and their advantages?

      What are Contra Funds and their advantages?

      Trending Tags

      No Result
      View All Result
      StockEdge Blog
      Home Tutorials
      pe ratio

      Price to Earnings Ratio (PE Ratio)

      StockEdge by StockEdge
      October 26, 2018
      Reading Time: 7 mins read
      3.4k
      VIEWS
      Share on FacebookShare on TwitterShare On WhatsApp

      Table of Contents

      • Impact of PE Ratio
          • See also: What does PE ratio and Book Value tell about a company and Know about Valuation Scans?
      • Types of Price to Earnings Ratio
      • Exceptions
      • PE Ratio Formula
        • Frequently Asked Questions
          • What’s a good PE ratio?
          • What PE ratio is too high?
          • What is PE ratio and PB Ratio?
          • How do you check stock PE ratio?
        • Stock Edge App
        • Bottomline

      Financial ratios are important parameters which help investors to decide on their investment. Any ratios are important in their own manner for a different kind of financial analysis. A financial ratio is a representation of selected numerical values from a company’s financial statements. Financial ratios help in deciding the valuation strength of the company.

      Investors often use PE Ratio to evaluate what a stock’s fair market value should be by predicting future earnings per share. Companies with higher future earnings are usually expected to issue higher dividends or have appreciating stock in the future. Obviously, the fair market value of a stock is based on more than just predicted future earnings. Investor speculation and demand also help increase a share’s price over time. PE Ratio is a valuation ratio to assess whether the company is overvalued or undervalued. There are a lot of ratios used for valuation analysis of a company. Let’s discuss the PE ratio in detail.

      Watch the video below on Everything you want to know about Price to Earnings Ratio:

      Impact of PE Ratio

      P/E Ratio or Price to Earnings Ratio is the ratio of the current price of a company’s share in relation to its earnings per share (EPS). The price to earnings ratio indicates the expected price of a share based on its earnings. As a company’s earnings per share being to rise, so does their market value per share. It signifies the amount of money an investor is willing to invest in a single share of a company for Re. 1 of its earnings.

      A company with a high P/E ratio usually indicated positive future performance and investors are willing to pay more for this company’s shares. A company with a lower ratio, on the other hand, is usually an indication of poor current and future performance. This could prove to be a poor investment. In general, a higher ratio means that investors anticipate higher performance and growth in the future. It also means that companies with losses have poor PE ratios.

      P/E ratio plays a vital role in determining whether the stocks are overvalued or undervalued and helps an investor intensively in taking positions in the market accordingly.

      See also: What does PE ratio and Book Value tell about a company and Know about Valuation Scans?

      Types of Price to Earnings Ratio

      There are primarily two types of P/E Ratio which investors take into consideration – forward P/E ratio and trailing P/E ratio.

      • Forward P/E Ratio – It is calculated by dividing the prices of a single unit of stock of a company and the estimated earnings of a company derived from its future earnings guidance. Investors use forward Price to Earnings Ratio to assess how a company is expected to perform in the future and its estimated growth rate.
      • Trailing P/E Ratio – Trailing P/E Ratio is the most commonly used metrics by investors; wherein past earnings of a company over a period is considered. It provides a more accurate and objective view of a company’s past performance.

      Exceptions

      An important thing to remember is that this ratio is only useful in comparing like companies in the same industry. Since this ratio is based on the earnings per share calculation, management can easily manipulate it with specific accounting techniques.

      PE Ratio Formula

      The PE ratio can be calculated as Market Value per share/Earnings Per Share.

      Where market value is the price of the share and the earnings per share is the net profit divided by the total number of subscribed shares.

      Suppose a company’s market price is Rs 200, the net profit after tax is 20 crores and the number of equity shares is 4 crore. And we are asked to find out its P/E ratio.

      We first have to find out its EPS which is Profit after tax/Number of equity shares which is equal to 20/4= 5.

      Now to find out the P/E ratio we divide Market Price/ EPS which is equal to 200/5 which is equal to 40. Hence the P/E ratio is 40.
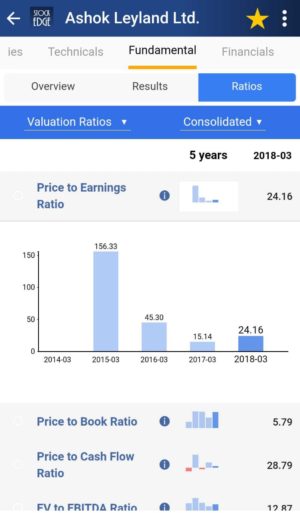
      PE ratio of Ashok Leyland ltd.

      Frequently Asked Questions

      What’s a good PE ratio?

      It is difficult to define a ‘good’ or ‘bad’ PE ratio. For example, a PE of 15 for a real estate company means little unless an investor finds that the average PE for the real estate sector is 27. Then the company is relatively cheaper to the sector and may see outperformance as it exceeds expectations. Or a company with a high PE relative to the sector may struggle, if it fails to meet forecasts.

      What PE ratio is too high?

      If the PE ratio of the stock is higher than the industry PE ratio, it is assumed to be overvalued and vice versa.

      What is PE ratio and PB Ratio?

      The price-to-earnings ratio (P/E) is for valuing a company that measures its current share price relative to its earnings per-share (EPS).  P/E ratios are used to determine the relative value of a company’s shares in peer comparison. 

      The price-to-book ratio (P/B) is used to compare a firm’s market capitalization to its book value. It’s calculated by dividing the company’s stock price per share by its book value per share. The P/B ratio measures the market’s valuation of a company relative to its book value.

      How do you check stock PE ratio?

      In India, if the stock is listed in NSE or BSE, the individual can go to the website of NSE/BSE and type the name of the stock and hit enter, in the information section of the company, the user can get to know the PE ratio. Alternatively, user can also use StockEdge App to check PE ratio and all other relevant information.

      Stock Edge App

      With this app, we don’t have to calculate PE Ratio on our own. StockEdge gives us PE Ratio of the last year of any company listed in the stock exchange. We can look and compare the PE Ratio of any company and filter out stocks accordingly.

      Suppose we want to look at the PE Ratio of Ashok Leyland of last year. In the Fundamental tab of Ashok Leyland, click on the fundamentals tab, we will get the Ratios tab.  Then in the Ratios tab click on Valuation Ratios, and we get the PE Ratio in minuscule of a second.

      Bottomline

      PE Ratio is an important barometer to understand the valuation aspects of a company. With the help of these ready-made scans you can with the click of a button filter out companies with low PE or companies below industry PE.  These scans are part of the premium offerings of StockEdge app.

      Click here to know StockEdge Premium 

      Also Read : Earnings Per Share.

      Tags: company’s earningsEPSFinancial ratiosfundamental conceptsIndustry PEPE RatioStockEdgevaluation ratio
      ShareTweetSend
      Subscribe On Telegram Subscribe On Telegram Subscribe On Telegram
      Previous Post

      Price to Cash Flow

      Next Post

      What is Free Cash Flow per Share

      StockEdge

      StockEdge

      StockEdge is a self-help Equity and Mutual Fund research tool. It empowers retail investors to identify investment opportunity with all the necessary data and analytics.

      Next Post
      fcf per share

      What is Free Cash Flow per Share

      cash flow per share

      Why you should track Cash Flow per Share

      current ratio

      Current Ratio: Definition, Formula & Impacts

      Leave a Reply Cancel reply

      Your email address will not be published. Required fields are marked *

      Contact Us
      • Timing (Mon-Sat): 10 am to 7 pm
      • Sales: +919830994463
      • Support: +919830994402
      • Club Support: +916289906895
      • Affiliate: +917003567131
      Recent Posts
      Top 5 Textile stocks
      Top 5 Textile Stocks in India: From Cotton to Cash
      multi-bagger stocks for 2025
      5 Multibagger Stocks to keep an eagle-eye for 2025
      Important Links
      • StockEdge.com
      • StockEdge Premium
      • - Quarterly Membership
      • - Annual Membership
      • StockEdge Analyst
      • StockEdge Club
      • Compare Plans
      An Initiative Of

      © 2023 Kredent InfoEdge Pvt Ltd.

      Facebook-f Twitter Instagram Linkedin-in Youtube Pinterest-p

      Get StockEdge App

      No Result
      View All Result
      • Home
      • Article Categories
        • Fundamental Analysis
        • Technical Analysis
        • Market Themes
        • StockEdge Tutorials
        • StockEdge Version Updates
      • Products
        • StockEdge Premium
        • StockEdge Pro
        • StockEdge Club
        • Compare Plans
      • Visit StockEdge.com

      © 2023 Kredent InfoEdge Pvt Ltd.