Table of Contents
Financial ratios are important parameters which helps investors to decide on their investment. Any ratios are important in their own manner for different kind of Financial analysis. A financial ratio is a representation of selected numerical values from a company’s financial statements. Financial ratios help in deciding the valuation strength of the company. There are a lot of ratios such as PE Ratio, Net profit margin, interest coverage ratio etc. used for valuation analysis of a company. We will discuss about the impact of Price to Cash Flow.
Price to Cash flow is an often used parameter when it comes to studying the fundamentals of a company. A Cash Flow is a representation of selected numerical values from a company’s financial statements. Financial ratios help in deciding the financial valuation of the company. There are a lot of ratios such as PE Ratio, Net profit margin, interest coverage ratio etc. used for valuation analysis of a company. Lets understand Price to cash flow ratio.
Watch the video below on Everything you want to know about Price to Cash Flow ratio:
What is Price to Cash Flow?
Price/cash-flow represents the amount an investor is willing to pay for a rupee generated from a particular company’s operations. Price/cash-flow shows the ability of a business to generate cash and acts as an assurance of liquidity and solvency. Because accounting conventions differ among nations, reported earnings (and P/E ratios) may not be comparable across national boundaries. Price/cash-flow attempts to provide an internationally standard measure of a firm’s stock price relative to its financial performance. It also helps an investor in identifying overvalued and undervalued stocks.
Impact of Price to Cash Flow Ratio
This is used by investors to evaluate the attractiveness of investing in a company’s shares. This ratio considers cash flows only and removes the effect of non cash items like depreciation. This ratio is preferred by investors since it is difficult to manipulate the cash figures as compared to earnings figures. It is especially useful for valuing stocks that have positive cash flow but are not profitable due to large non cash charges. Thus it is more preferred over PE Ratio by analysts and investors because some companies appear unprofitable due to large non-cash expenses despite having positive cash flow.
See also: What is Cash Flow?
Exceptions
The amount to be received for cash sales of the current period might be received the next year. Hence when it comes to calculation, the figure does not show the correct representation at times as compared to actual sales/purchases. There is no single figure which points the optimal price to cash flow but a lower figure generally indicates the stock is undervalued and a higher figure generally suggest it is overvalued.
Price to Cash Flow Formula
Price to Cash Flow= Share Price/Operating Cash Flow per share.
Suppose a company‘s market price is Rs 50. The operating cash flow is 20 crores and the number of shares is 2 crores. Hence the operating cash flow per share= 20/2=10. Therefore Price to cash flow per share= 50/10= 5.

StockEdge App
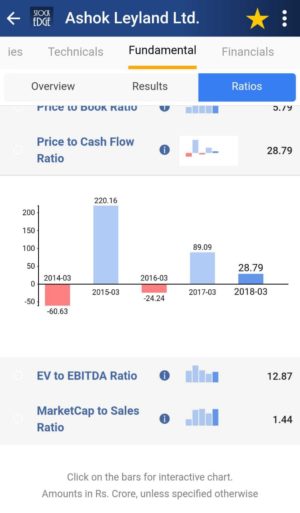
Now we don’t have to calculate Price to Cash Ratio on our own. StockEdge gives us Price to Cash Ratio of the last 5 years of any company listed in the stock exchange. We can look and compare Price to Cash Ratio of any company in the same Industry and filter out stocks accordingly.
Suppose we want to look at the Price to Cash Ratio of Ashok Leyland of last year. In the Fundamental tab of Ashok Leyland, click on the fundamentals tab, we will get the Ratios tab. Then in the Ratios tab click on Valuation Ratios, and we get the Price to Cash Ratio in a second.
Frequently Asked Questions
What is a good price to cash flow?
There is no single figure that points to an optimal price-to-cash flow ratio, a ratio in the low single digits may indicate that the stock is undervalued, while a higher ratio may suggest that it is overvalued.
Do you want a high or low price to cash flow?
There is no single figure that points to an optimal price-to-cash flow ratio, a ratio in the low single digits may indicate that the stock is undervalued, while a higher ratio may suggest that it is overvalued. The price-to-cash flow multiple works well for companies that have large non-cash expenses such as depreciation.
What does price to cash flow mean?
The price-to-cash flow (P/CF) ratio is a stock valuation indicator or multiple that measures the value of a stock’s price relative to its operating cash flow per share. The ratio uses operating cash flow which adds back non-cash expenses such as depreciation and amortization to net income. It is especially useful for valuing stocks that have positive cash flow but are not profitable because of large non-cash charges.
How do you calculate price to cash flow ratio?
The Formula for the Price-to-Cash Flow Ratio Is
Price to Cash Flow Ratio = Share Price/Operating Cash Flow per Share
Bottomline
Price to Cash Ratio is an important barometer to understand if the company is generating enough cash from its operations or not. With the help of these ready-made parameters you can with the click of a button filter out cash rich companies. These parameters are part of the free offerings of StockEdge app. If you still do not have the StockEdge app, download it right now to use this feature.
Join StockEdge Club to get more such Stock Insights. Click to know more!
You can check out the desktop version of StockEdge.


