StockEdge.com
  • Go Premium
    • StockEdge Quarterly Plan
    • StockEdge Annual Plan
    • StockEdge Analyst
    • StockEdge Club
    • Compare Plans
StockEdge Blog
  • Trending Stocks
  • Insights
    • All
    • Business Houses
    • Markets themes
    • Stock Insights
    Piramal Enterprises: Demerger to unlock value

    Piramal Enterprises: Demerger to unlock value

    Top 5 High-Quality Small-Cap Stocks for H2 FY23

    Top 5 High-Quality Small-Cap Stocks for H2 FY23

    Top 3 High Growth Stocks for wealth creation in the next ten years

    Top 3 High Growth Stocks for wealth creation in the next ten years

    Top 5 High-Quality Mid-Cap Stocks for 2022

    Top 5 High-Quality Mid-Cap Stocks for 2022

    How Page Industries is creating a “branded” opportunity in a fragmented market

    How Page Industries is creating a “branded” opportunity in a fragmented market

    5 Stocks which are Consistently Paying Dividend

    5 Stocks which are Consistently Paying Dividend

    Elgi Equipments – Enjoying Strong Tailwinds

    Elgi Equipments – Enjoying Strong Tailwinds

    J.B. Chemicals & Pharmaceuticals – One of India’s fastest-growing pharmaceutical companies

    J.B. Chemicals & Pharmaceuticals – One of India’s fastest-growing pharmaceutical companies

    Blue Dart Express – A market leader in Air Express Industry

    Blue Dart Express – A market leader in Air Express Industry

  • Technical Analysis
    Derivative Analytics

    Derivative Analytics – An Insightful Research Tool

    Put-Call Ratio – A Powerful Derivatives Indicator

    Put-Call Ratio – A Powerful Derivatives Indicator

    Beta & Beta Scans – A Powerful Technical Indicator

    Beta & Beta Scans – A Powerful Technical Indicator

    Technical Analysis using Edge Charts

    Technical Analysis using Edge Charts

    Adaptive Relative Strength & Static Relative Strength Scans

    Adaptive Relative Strength & Static Relative Strength Scans

    SuperTrend Indicator : Sell or Buy Signals

    SuperTrend Indicator : Sell or Buy Signals

    2 year and 5 year Price Breakout Scans

    2 year and 5 year Price Breakout Scans

    What is Narrow Range Scans (NR)

    What is Narrow Range Scans (NR)

    Relative Strength (RS)

    Relative Strength (RS)

  • Fundamental Analysis
    • All
    • Cash Flow Ratios
    • Efficiency ratios
    • Growth Ratios
    • Liquidity Ratios
    • Return Ratios
    • Solvency ratios
    • Valuation Ratios
    Understanding the Importance of creating Fundamental Scans

    Understanding the Importance of creating Fundamental Scans

    Using My Combination Scan to Identify best in an Industry

    Using My Combination Scan to Identify best in an Industry

    Cost Income ratio

    Cost to Income Ratio(%)

    Cost of Liability

    Cost of Liabilities (%)

    Operating Cost to Assets Ratio (%)

    Operating Cost to Assets Ratio (%)

    Promoter pledge

    Promoter Pledge: Know Everything about it

  • StockEdge Tutorials
    Using Investor Portfolios Section to track Big Bulls like Rakesh Jhunjhunwala

    Using Investor Portfolios Section to track Big Bulls like Rakesh Jhunjhunwala

    StockEdge Version 8.1 – It keeps getting Better & Better

    StockEdge Version 8.1 – It keeps getting Better & Better

    StockEdge Version Update 8.0 – Like never before

    StockEdge Version Update 8.0 – Like never before

    Derivative Analytics

    Derivative Analytics – An Insightful Research Tool

    Market Breadth – A Bird’s Eye View of the Market at 1 place

    Market Breadth – A Bird’s Eye View of the Market at 1 place

    StockEdge Version 7.6 released – Enhancing your investment journey further!

    StockEdge Version 7.6 released – Enhancing your investment journey further!

    Beta & Beta Scans – A Powerful Technical Indicator

    Beta & Beta Scans – A Powerful Technical Indicator

    StockEdge Version Update 7.4 – Enhancing your Investment Journey

    StockEdge Version Update 7.4 – Enhancing your Investment Journey

    StockEdge 7.3 Release

    StockEdge 7.3 Release

  • Mutual Fund
    Top 5 Mutual Funds for 2022 where you can start your SIP

    Top 5 Mutual Funds for 2022 where you can start your SIP

    What are Value Funds and its Advantages?

    What are Value Funds and its Advantages?

    A Beginners Guide to Thematic Funds

    A Beginners Guide to Thematic Funds

    Understanding Sector Funds and their Benefits to our Portfolio

    Understanding Sector Funds and their Benefits to our Portfolio

    Are Dividend Yield Funds a good option to invest in?

    Are Dividend Yield Funds a good option to invest in?

    What are Contra Funds and their advantages?

    What are Contra Funds and their advantages?

    Trending Tags

    No Result
    View All Result
    • Trending Stocks
    • Insights
      • All
      • Business Houses
      • Markets themes
      • Stock Insights
      Piramal Enterprises: Demerger to unlock value

      Piramal Enterprises: Demerger to unlock value

      Top 5 High-Quality Small-Cap Stocks for H2 FY23

      Top 5 High-Quality Small-Cap Stocks for H2 FY23

      Top 3 High Growth Stocks for wealth creation in the next ten years

      Top 3 High Growth Stocks for wealth creation in the next ten years

      Top 5 High-Quality Mid-Cap Stocks for 2022

      Top 5 High-Quality Mid-Cap Stocks for 2022

      How Page Industries is creating a “branded” opportunity in a fragmented market

      How Page Industries is creating a “branded” opportunity in a fragmented market

      5 Stocks which are Consistently Paying Dividend

      5 Stocks which are Consistently Paying Dividend

      Elgi Equipments – Enjoying Strong Tailwinds

      Elgi Equipments – Enjoying Strong Tailwinds

      J.B. Chemicals & Pharmaceuticals – One of India’s fastest-growing pharmaceutical companies

      J.B. Chemicals & Pharmaceuticals – One of India’s fastest-growing pharmaceutical companies

      Blue Dart Express – A market leader in Air Express Industry

      Blue Dart Express – A market leader in Air Express Industry

    • Technical Analysis
      Derivative Analytics

      Derivative Analytics – An Insightful Research Tool

      Put-Call Ratio – A Powerful Derivatives Indicator

      Put-Call Ratio – A Powerful Derivatives Indicator

      Beta & Beta Scans – A Powerful Technical Indicator

      Beta & Beta Scans – A Powerful Technical Indicator

      Technical Analysis using Edge Charts

      Technical Analysis using Edge Charts

      Adaptive Relative Strength & Static Relative Strength Scans

      Adaptive Relative Strength & Static Relative Strength Scans

      SuperTrend Indicator : Sell or Buy Signals

      SuperTrend Indicator : Sell or Buy Signals

      2 year and 5 year Price Breakout Scans

      2 year and 5 year Price Breakout Scans

      What is Narrow Range Scans (NR)

      What is Narrow Range Scans (NR)

      Relative Strength (RS)

      Relative Strength (RS)

    • Fundamental Analysis
      • All
      • Cash Flow Ratios
      • Efficiency ratios
      • Growth Ratios
      • Liquidity Ratios
      • Return Ratios
      • Solvency ratios
      • Valuation Ratios
      Understanding the Importance of creating Fundamental Scans

      Understanding the Importance of creating Fundamental Scans

      Using My Combination Scan to Identify best in an Industry

      Using My Combination Scan to Identify best in an Industry

      Cost Income ratio

      Cost to Income Ratio(%)

      Cost of Liability

      Cost of Liabilities (%)

      Operating Cost to Assets Ratio (%)

      Operating Cost to Assets Ratio (%)

      Promoter pledge

      Promoter Pledge: Know Everything about it

    • StockEdge Tutorials
      Using Investor Portfolios Section to track Big Bulls like Rakesh Jhunjhunwala

      Using Investor Portfolios Section to track Big Bulls like Rakesh Jhunjhunwala

      StockEdge Version 8.1 – It keeps getting Better & Better

      StockEdge Version 8.1 – It keeps getting Better & Better

      StockEdge Version Update 8.0 – Like never before

      StockEdge Version Update 8.0 – Like never before

      Derivative Analytics

      Derivative Analytics – An Insightful Research Tool

      Market Breadth – A Bird’s Eye View of the Market at 1 place

      Market Breadth – A Bird’s Eye View of the Market at 1 place

      StockEdge Version 7.6 released – Enhancing your investment journey further!

      StockEdge Version 7.6 released – Enhancing your investment journey further!

      Beta & Beta Scans – A Powerful Technical Indicator

      Beta & Beta Scans – A Powerful Technical Indicator

      StockEdge Version Update 7.4 – Enhancing your Investment Journey

      StockEdge Version Update 7.4 – Enhancing your Investment Journey

      StockEdge 7.3 Release

      StockEdge 7.3 Release

    • Mutual Fund
      Top 5 Mutual Funds for 2022 where you can start your SIP

      Top 5 Mutual Funds for 2022 where you can start your SIP

      What are Value Funds and its Advantages?

      What are Value Funds and its Advantages?

      A Beginners Guide to Thematic Funds

      A Beginners Guide to Thematic Funds

      Understanding Sector Funds and their Benefits to our Portfolio

      Understanding Sector Funds and their Benefits to our Portfolio

      Are Dividend Yield Funds a good option to invest in?

      Are Dividend Yield Funds a good option to invest in?

      What are Contra Funds and their advantages?

      What are Contra Funds and their advantages?

      Trending Tags

      No Result
      View All Result
      StockEdge Blog
      Home Tutorials
      Stockedge Solvency scan

      Solvency Ratio: Definition, Formula & Scan

      StockEdge by StockEdge
      September 21, 2018
      Reading Time: 8 mins read
      4.5k
      VIEWS
      Share on FacebookShare on TwitterShare On WhatsApp

      Table of Contents

      • What does Leverage mean?
      • What does the Interest Coverage Ratio Mean?
        • See also: EBIT Margin (%)
      • Solvency Ratio Formula
      • Kinds of Interest Coverage ratio
      • What does Current Ratio Depict?
      • Current Ratio formula to calculate
      • How does Solvency Scan Help
      • Frequently Asked Questions
        • What is solvency ratio formula?
        • What is a good solvency ratio?
        • What is solvency ratio for banks?
      • Bottomline

      Solvency Ratio is an important tool to measure a company’s financial stability and strength. Investors investing decision is based on this being a major criterion. Solvency means the total assets a company is left with after paying off its current liabilities. Current Ratio or Quick ratio or liquidity ratio defines how quickly can a company liquefy its assets to pay off its debt. Thus current Assets divided by current liabilities gives us the current ratio of a company. If a company’s current ratio or Solvency Ratio is greater than 1 then its debt servicing obligation is expected to be very good.

      What does Leverage mean?

      Leverage means the amount of debt taken to run the company. It can be a short-term debt or working capital requirement or long-term debt.

      • No Leverage means that the company is debt-free and has taken no loan for the working of the company which means the company is working on its internal accruals and is very sound.  Thus these types of company’s do not get affected by macro factors like interest rates.
      • Low Leverage means that the company’s debt to equity ratio is negligible i.e less than 0.5 and thus is not viewed negatively for the company under any adverse macro conditions.
      • Moderate Leverage means the company has taken debt which is more than 1 and less than 2. Thus rising interest rates or input costs to have a minor impact on its running.
      • High Leverage means debt Equity ratio is more than 2 that means any macro or micro-changes in the industry to hugely affect the company’s performance. Investors tend to stay away from highly leveraged companies.

      Consistently increasing leverage is not a good sign, as interest payment burden increases and hence the company’s operation suffers. The high-interest cost gets difficult to service and hence affects the financials.

      Consistently decreasing leverage is considered good as the company is heading towards a debt-free model which reduces the interest burden, thus improving profitability margin. Also, the debt to equity ratio tends to fall.

      ALSO READ: Business Risk Analysis & Leverage.
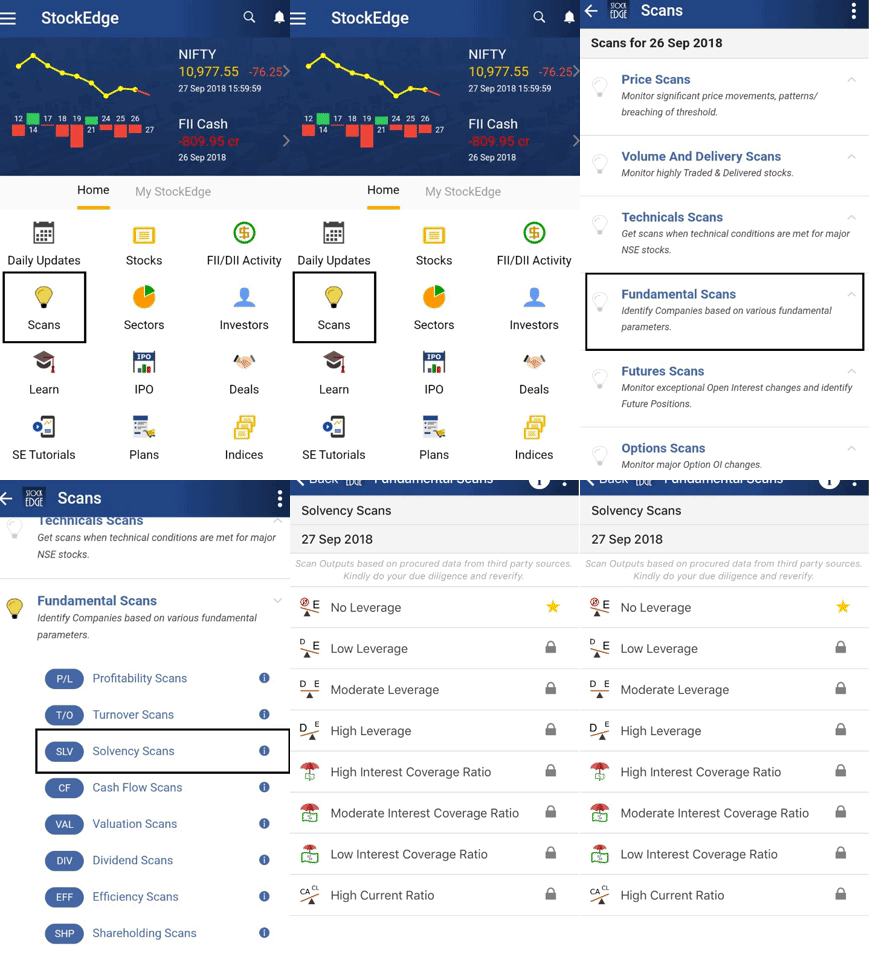
      Solvency Ratio on StockEdge

      What does the Interest Coverage Ratio Mean?

      The interest coverage ratio is the ability of the company to service their debt obligation which is a key factor in determining a company’s solvency metric and is an important statistic for shareholders and prospective investors to determine how sound a company’s book is for meeting its debt requirements.

      Download StockEdge App Download StockEdge App Download StockEdge App

      See also: EBIT Margin (%)

      Solvency Ratio Formula

      Solvency ratio = EBIT / Interest expenses.

      Kinds of Interest Coverage ratio

      • High-interest coverage ratio means that the company can easily pare down its debts and the ratio is more than 2.
      • Moderate Interest coverage ratio means that the company will not face much problem in servicing its net interest obligations,  the interest coverage ratio is more than 1 and less than 2.
      • Low-interest coverage ratio means that the company to face difficulty during adverse times to meet its interest obligations as Interest coverage ratio is below

      You can also watch the below video on Everything you want to know about Solvency Ratio:

      What does Current Ratio Depict?

      The Current ratio of any company depicts how fast its assets can be liquidated to pay off its liabilities in case of any contingency. The Current assets divided by the current liabilities gives us the measure of the current ratio.

      • High current ratio means the company is expected to be financially strong. These companies remain attractive for most of the investors., the ratio is more than 1.75.
      • Companies having a Moderate current ratio are analyzed by different investors on various other parameters before taking an investment decision, the ratio is more than 1 and less than 2.
      • Low current ratio means the chances for the company to have deficiency in liquidating its assets for payments of debts obligations is high. Thus they are those laggards from which the Investor forums tend to stay away, the ratio is less than 0.75.

      Current Ratio formula to calculate

      CURRENT RATIO= Current Assets/Current Liabilities.

      How does Solvency Scan Help

      This scan helps to filter out companies based on debt, interest coverage ratio and current ratio.

      Frequently Asked Questions

      What is solvency ratio formula?

      The solvency ratio helps us assess a company’s long-term financial performance as determined by its debt repayments. To calculate the ratio, divide a company’s net income – after subtracting its tax obligations – by the sum of its liabilities (short-term and long-term).

      The formula for calculating the solvency ratio is as follows:

      Solvency Ratio = (Net Income + Depreciation) / All Liabilities (Short-term + Long-term Liabilities)

      What is a good solvency ratio?

      Solvency ratios varies from industry to industry, but in general, a solvency ratio of greater than 20% is considered financially healthy. The lower a company’s solvency ratio, the greater the probability that the company will default on its debt obligations.

      What is solvency ratio for banks?

      Solvency ratio measures the long term ability of the bank to meet its obligations which involves understanding the capacity of the bank to meet its obligations.

      Debt to Equity Ratio: The financial business is a leveraged business and hence this will be high.

      So for the banking sector, this ratio will be high and therefore the most appropriate manner to analyze the bank on this parameter will be to compare it with its peers.

      Financial leverage: Financial leverage is the ratio of banks total debt to its total assets. It implies amount of assets in comparison to its debt.

      For the banking sector analysis, it is of utmost importance in understanding the banks Business strength. As lending is one of the most important businesses of the Banks.

      Capital Adequacy Ratio: This ratio helps us understand the amount of losses the bank can absorb before becoming insolvent. It is a measurement of banks available capital expressed as a percentage of bank’s risk weighted credit exposure.

      Bottomline

      Solvency is an important tool which measures the strength or weaknesses of a company. Any strong company will give you best returns on your investments and the tool which will help you to filter out all these and much more is the Stockedge app. If you still do not have the StockEdge app, download it right now to use this feature. It is a part of the premium offering of StockEdge App.

      Join StockEdge Club to get more such Stock Insights. Click to know more!

      You can check out the desktop version of StockEdge.

      Tags: Current RatioCurrent ReceivablesInterest Coverage RatioleverageQuick ratioSolvencyStockedge app
      ShareTweetSend
      Subscribe On Telegram Subscribe On Telegram Subscribe On Telegram
      Previous Post

      Use Sales Growth Ratio to Identify Good Companies

      Next Post

      What is Valuation Scans?

      StockEdge

      StockEdge

      StockEdge is a self-help Equity and Mutual Fund research tool. It empowers retail investors to identify investment opportunity with all the necessary data and analytics.

      Related Posts

      Using Investor Portfolios Section to track Big Bulls like Rakesh Jhunjhunwala
      StockEdge Tutorials

      Using Investor Portfolios Section to track Big Bulls like Rakesh Jhunjhunwala

      July 25, 2022
      16.5k
      StockEdge Version 8.1 – It keeps getting Better & Better
      StockEdge Tutorials

      StockEdge Version 8.1 – It keeps getting Better & Better

      June 13, 2022
      3.2k
      StockEdge Version Update 8.0 – Like never before
      StockEdge Tutorials

      StockEdge Version Update 8.0 – Like never before

      April 28, 2022
      7.5k
      Next Post
      Valuation scan

      What is Valuation Scans?

      Solvency scan Stockedge

      How to Identify Dividend Paying Companies?

      Efficiency Scan

      How to analyse Efficiency Ratios?

      Comments 6

      1. SESHADRI G says:
        4 years ago

        Very useful and gud article. Thanks

        Reply
        • Ganga says:
          2 years ago

          thank you

          Reply
      2. Rasesh Shukla says:
        4 years ago

        Very good effort.To make investor aware
        market jargon. Keep it up. thanks

        Reply
        • Ganga says:
          2 years ago

          thanks, we will be providing more quality content in future also

          Reply
      3. satya prakash gannavarapu says:
        2 years ago

        Excellent insight of companies for investors, keep it up

        Reply
        • Ganga says:
          2 years ago

          thank you

          Reply

      Leave a Reply Cancel reply

      Your email address will not be published. Required fields are marked *

      Contact Us

      • Timing (Mon-Sat): 10 am to 7 pm
      • Sales: +919830994463
      • Support: +919830994402
      • Club Support: +916289906895
      • Affiliate: +917003567131

      Recent Posts

      Piramal Enterprises: Demerger to unlock value

      August 14, 2022

      Top 5 High-Quality Small-Cap Stocks for H2 FY23

      August 1, 2022

      Important Links

      • StockEdge.com
      • StockEdge Premium
      • - Quarterly Membership
      • - Annual Membership
      • StockEdge Analyst
      • StockEdge Club
      • Compare Plans

      An Initiative Of

      © 2021 Kredent InfoEdge Pvt Ltd.

      Facebook-f Twitter Instagram Linkedin-in Youtube Pinterest-p

      Get StockEdge App

      No Result
      View All Result
      • Home
      • Article Categories
        • Fundamental Analysis
        • Technical Analysis
        • Market Themes
        • StockEdge Tutorials
        • StockEdge Version Updates
      • StockEdge Premium
        • Quarterly Membership
        • Annual Membership
        • StockEdge Analyst
        • StockEdge Club
        • Compare Plans
      • Visit StockEdge.com

      © 2021 Kredent InfoEdge Pvt Ltd.