StockEdge.com
  • Products
    • StockEdge Premium
    • StockEdge Pro
    • StockEdge Club
  • Stories
StockEdge Blog
  • Trending Stocks
  • Insights
  • Technical Analysis
  • Fundamental Analysis
  • StockEdge Tutorials
  • Mutual Fund
No Result
View All Result
  • Trending Stocks
  • Insights
  • Technical Analysis
  • Fundamental Analysis
  • StockEdge Tutorials
  • Mutual Fund
No Result
View All Result
StockEdge
Home StockEdge Version Updates
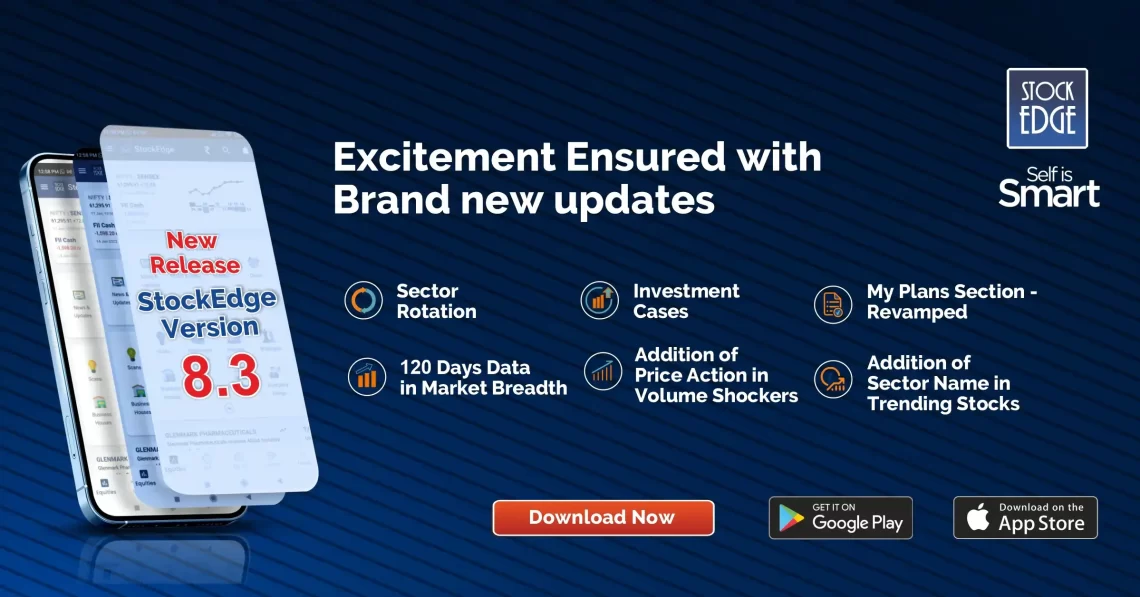
Promotional image for stockedge version 8. 3 showcasing brand new updates including sector rotation, investment cases, and a revamped my plans section. The background is dark blue with options to download the app from google play and the app store

StockEdge Version Update 8.3

StockEdge by StockEdge
January 4, 2024
Reading Time: 7 mins read
3.2k
VIEWS
Share on FacebookShare on XShare On WhatsApp

Table of Contents

  • Sector Rotation:
    • Breadth:
    • Delivery:
    • VWAP:
    • Investment Cases:
    • My Plans Section – Revamped:
    • 120 Days of Data in Market Breadth:
    • Additional Facts in Trending Stocks:

StockEdge is delighted to release StockEdge Version 8.3.

With every release, we onboard a few features that add significant value to our users of StockEdge in understanding the financial markets better. 

In this release, we introduce the following features to our users: 

  1. Sector Rotation
  2. Investment Cases
  3. My Plans Section – Revamped
  4. 120 Days of Data in Market Breadth
  5. Additional Facts in Trending Stocks

Continue reading below to learn more about these fantastic features:

Sector Rotation:

A sector is a group of stocks representing companies in similar lines of business. The basic premise is that these stocks can be expected to perform similarly. Sector rotation is a unique feature that will enable you to identify the movement of money invested in stocks from one sector to another as investors and traders anticipate the next stage of the economic cycle.

StockEdge facilitates analysis of sector rotation through three channels: 1) Breadth, 2) Delivery, and 3) VWAP

Breadth:

Market Breadth gives a bird’s eye view of the sector’s performance considering different indicators. It shows the percent/count of the stocks from the sectors that have a value above the value of the indicators like RS55, RSI 50, SMA 20, SMA 50, and SMA 100.

If the count or percent is high, it is shaded in green, in yellow if it is neutral, and in shades of red for a low count. Green shades indicate a positive stand, yellow shades indicate a neutral stand, and red shades indicate a negative stand. You will be redirected to the selected sector page when clicking any sector stock.

The image is a screenshot of a stock market app called “stocks edge”. The app is displaying sector rotation data for various industries for november 3, 2022. The industries shown are banking, photographic, ship building, gas, transmission, capital, and hospitality.

Delivery:

Delivery trading is when you buy a stock and take it into your demat account or sell a stock you hold via a debit to your Demat account.  Intraday trading refers to buying and selling stocks the same day before the market closes.

In StockEdge, you get sector-wise total MCap and change compared to the previous trading day, volume (traded value), and delivery value compared with the average of the previous 5 days’ volume and delivery value. You can analyze the sectors’ activities by comparing changes in MCap, Volume, and Delivery. You will be redirected to the selected sector page when clicking any sector.

The image is a screenshot of stockedge app. He app is showing the performance of various sectors. The sectors are listed in a table with the following columns: sector, mcap (cr. ), avg. Vol. (cr. ), avg. Delivery (%),  the sectors listed are ship building, other, consumer durables, hospitality, finance, electricals, and fmcg.

VWAP:

The volume-weighted average price (VWAP) is a measurement that shows the average price of a security, adjusted for its volume. It is calculated during a specific trading session by taking the total value of trading in the security and dividing it by the volume of trades. Traders and analysts use the VWAP to eliminate the noise throughout the day, so they can gauge what prices buyers and sellers are trading at on the stock or the market.

In StockEdge, you get sector-wise stock above or below their VWAP. VWAP column displays the number & percentage of stocks out of total stocks in the particular sector that satisfies the condition. This can be used to know the pricing insight into a sector’s trend and value. You can understand how the sector performs depending on how many stocks in the sector follow the same upward or downward trend. You will be redirected to the selected sector page when clicking any sector.

A snap about the sector rotation of various stocks in the market and their volume - weighted average price (vwap) from stockedge app as of 03 nov,2022.

Investment Cases:

We are introducing “Investment Cases,” a new section for all our users to help them invest in the basket of stocks that reflect an idea. StockEdge platform now provides an option to invest in ready-made portfolios created by SEBI registered Investment Advisors and Research Analysts. Investing in Stocks/ETFs (Exchange Traded Funds) is subject to market risks. Read all the related documents before investing. Investors should consider all risk factors and consult their financial advisors before investing.

This is a screenshot of the stockedge app. The top of the image shows the nifty fii +64. 45 and a graph of the stock’s performance. The graph is a line graph with blue dots representing the stock’s performance over time. Below the graph, there are several icons for different sections of the app, including “updates”, “deals”, “investors”, and “trending stocks”. The bottom of the image shows a tab bar with options for “equities”, “m. F. ”, “my se”, and “learn”.
A image from stockedge app that appears to be related to investing. The top of the screen has a search bar and a green logo with a tree and “top 10” written on it. Below the search bar, there is a list of investment options. The first option is “optimal size 5l-30l. Past cagr=15%”. The second option is “omskara manufacturing. India’s best small cap”. The third option is “ro manufacturing. 29% returns. High volatility.

My Plans Section – Revamped:

To provide the most hassle-free experience to our users, StockEdge now allows renew and upgrade plans directly from the “My Plans” section. With the “Renew” button, you will be able to resume your plan or extend the period of validity of your plan. With the “Upgrade” button, you can upgrade to a higher plan. Users also get details of their plan- both current and past transactions and other relevant details in “View Details.”

A screenshot of a stockedge app screen showing a list of plans and their expiry dates. The screen is titled “my plans”. The screen shows a list of plans and their expiry dates. The first plan is “stockedge club - annual” and it is expired. The second plan is “stockedge premium” and it is valid till 19 nov 2022. There is a button to renew the expired plan. There is a link to restore purchases.

120 Days of Data in Market Breadth:

Market Breadth is a premium feature introduced by StockEdge, which gives an overall sentiment of the NIFTY 50 and NIFTY 500 stocks over different periods. To provide our users with enhanced analytics, StockEdge now provides market breadth analysis of the last 120 days.

The image of a stock market analysis 
 from stockedge app. The app is displaying the performance of nifty 50 and nifty 500 stocks. The table has columns for date, rs, sma, and sma. The table has rows for different dates from october 27 to november 3. The table has green and yellow cells indicating the stock performance.

Additional Facts in Trending Stocks:

To provide our users with more details on stocks that are trending, StockEdge has added the following facts 1) Sector Name, 2) Last traded price 3) Percentage change in the stock prices.

Daily updates of various kinds of trending stocks as of friday,04 nov 2022 from the stockedge app.

This is it for now from Team StockEdge. We hope these features enhance your investment journey and make StockEdge more valuable.

If you enjoy using StockEdge, don’t hold back from sharing the platform with your near and dear ones.

Check out StockEdge’s Premium Plans to get the most out of it. Also, watch this space for our midweek and weekend editions of ‘Stock Insights‘.

Tags: Investment Casesmarket breadthSector RotationStockEdge Version Updatetrending stocks
ShareTweetSend
Open A Zero Brokerage Account In Kotak Open A Zero Brokerage Account In Kotak Open A Zero Brokerage Account In Kotak
Previous Post

Saregama India Ltd. – Bringing back the melody

Next Post

Dalmia Bharat Ltd. – Building the nation brick by brick

StockEdge

StockEdge

StockEdge is a self-help Equity and Mutual Fund research tool. It empowers retail investors to identify investment opportunity with all the necessary data and analytics.

Next Post
Dalmia bharat ltd logo

Dalmia Bharat Ltd. - Building the nation brick by brick

A grey background with the text "stock insights" and the atul auto ltd. Logo.

Atul Auto: A Curious Case of Value Investing

A graphic of a plant n a pot with a coin on top and an arrow pointing upwards. It represents investment themes in a blue background.

Powerful Investment Themes for Retail Investors

Comments 2

  1. Avatar of mahesh khatu Mahesh Khatu says:
    2 years ago

    Please add the Pivot scan in your scan section. Also add the feature of portfolio so that it is not required to visit other websites like money control for to check our portfolio value. With this we get all information in stock edge only

  2. Avatar of vishav bandhu patni VISHAV BANDHU Patni says:
    2 years ago

    please upload on playstore early. then advertise on you tube. I love ❤ stock edge

Disclaimer

StockEdge (Kredent InfoEdge Pvt. Ltd.) is a SEBI-registered Research Analyst (RA) entity (SEBI Registration No: INH300007493). The information provided in this article is for educational and informational purposes only and should not be considered as an offer to buy or sell any securities or investment products.

The stocks, securities, and investment instruments mentioned herein are not recommendations under SEBI (Research Analysts) Regulations, 2014. Readers are advised to conduct their own due diligence and seek independent financial advice before making any investment decisions.

Investments in securities markets are subject to market risks. Please read all related documents carefully before investing. Investing in Equity Shares,
Derivatives, Mutual Funds, or other instruments carry inherent risks, including potential loss of capital. StockEdge (Kredent InfoEdge Pvt. Ltd.) does not provide any guarantee or assurance of returns on any investments. Past performance is not indicative of future performance.

Contact Us
  • Timing (Mon-Sat): 10 am to 7 pm
  • Sales: +919830994463
  • Support: +919830994402
  • Club Support: +916289906895
  • Affiliate: +917003567131
Recent Posts
Top 3 Pharma stocks in India
Top 3 Pharma Stocks in India
3 Telecom Stocks in India
Top 3 Telecom Stocks in India
Important Links
  • StockEdge.com
  • StockEdge Premium
  • StockEdge Pro
  • StockEdge Club
  • Compare Plans
An Initiative Of
Logo of KREDENT INFOEDGE with SEBI Registration no.

© 2025 Kredent InfoEdge Pvt Ltd.

Facebook-f Twitter Instagram Linkedin-in Youtube Pinterest-p Whatsapp Telegram

Get StockEdge App

No Result
View All Result
  • Home
  • Article Categories
    • Trending Stocks
    • Insights
    • Technical Analysis
    • Fundamental Analysis
    • StockEdge Tutorials
    • Mutual Fund
  • Stories
  • Products
    • StockEdge Premium
    • StockEdge Pro
    • StockEdge Club
  • Visit StockEdge.com

© 2024 Kredent InfoEdge Pvt Ltd.

Super Summer Saver