Table of Contents
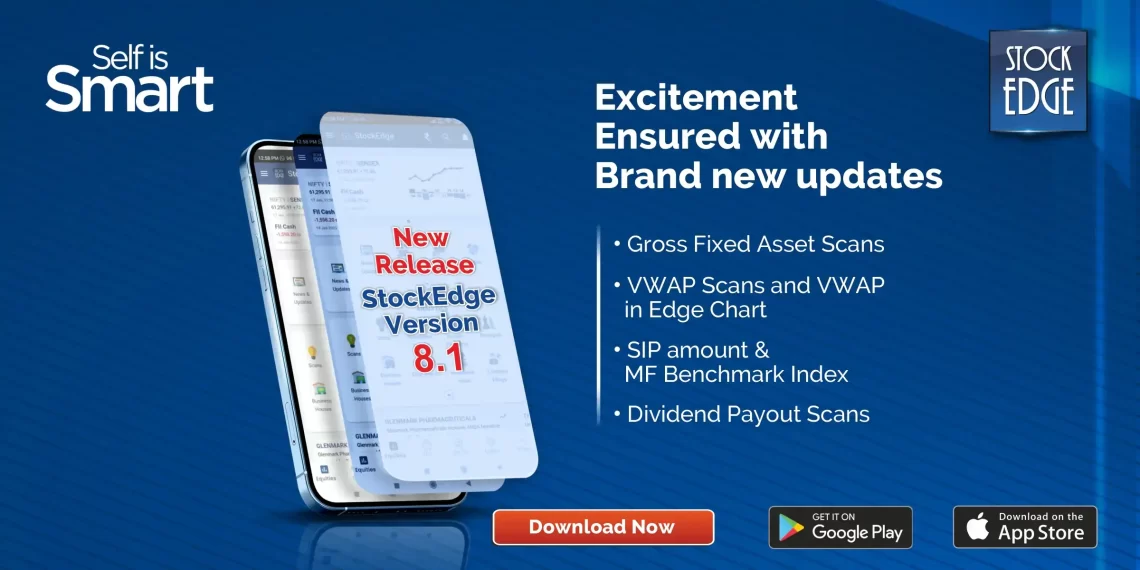
StockEdge is happy to release StockEdge Version Update 8.1. We believe that with every update, the user experience just keeps getting better. Continue reading to know what’s in store for you this time!
Following are the new features being released:
- Gross Fixed Asset Scans
- VWAP Scans & VWAP in Edge Chart
- SIP amount for Mutual Fund & Benchmark Index
- Dividend Payout Scan
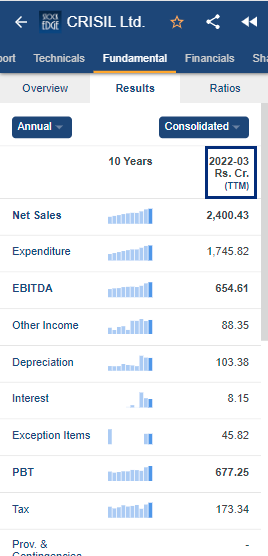
- Trailing Twelve Months (TTM) in Results
Let’s dive into the features without further ado:
Gross Fixed Asset Scans:
Gross Block refers to the Total Value of Assets, which is the total of the original purchase price and any Capital Expenditure made while Net Block refers to the actual value of the asset, which is net of depreciation charged. Higher values of Gross Fixed Assets are favorable. Increase in the value of Fixed Assets implies considerable investments in upcoming projects which include expansion of operations, entry into new markets, technology upgrades, etc. Capital expenditures are more commonly found in manufacturing industries and other capital intensive industries
2 new Gross Fixed Asset scans are introduced that will help users filter out companies with high future growth prospects due to high increase in Gross Fixed Assets. They are:
- High Increase in Gross Fixed Assets in 1 Year
- High Increase in Gross Fixed Assets in 3 Years

Volume Weighted Average Price (VWAP):
The Volume Weighted Average Price (VWAP) of a stock is the price of the stock adjusted for its volume. It is calculated during a specific period by dividing the total value of shares traded by the number of shares traded. VWAP is a technical analysis indicator. It represents the average price a stock has traded at throughout the day, both based on volume and price. It gives traders an insight into the trend and value of a security. 6 new scans related to VWAP are being released:
- Close Crossing Above VWAP
- Close Crossing Below VWAP
- Closing Above VWAP for 2 days
- Closing Below VWAP for 2 days
- Closing Above VWAP for 3 days
- Closing Below VWAP for 3 days

Along with the above scans, users will now be able to plot the VWAP of a stock on the Edge Chart. This will enhance equity research and will provide users with more insight into a stock.
SIP Amount & Benchmark Index for Mutual Funds:
Information about the minimum investment amount, lump sum and SIP is now available for every fund on StockEdge along with the benchmark it tracks. This gives a more compact idea about the fund to the users.

Dividend Payout Scan:
Dividend paid by a company increases shareholder’s total return. Dividend can be Final, Interim or Special in nature. Regular dividend provides shareholders with an increase in Cash Flow. Shareholders generally seek those stocks which pay dividends on a consistent basis. Dividend Payout Ratio is the ratio of the dividend paid out by the company to its net profit. Higher Dividend Payout Ratio suggests that the company is sharing a high proportion of its earnings with shareholders. To help users identify stocks with high Dividend Payout Ratio, we have introduced the following scan:
- Consistently High Dividend Payout Ratio

Trailing Twelve Months (TTM) in Results:
Trailing Twelve Months (TTM) refers to the previous 12 month’s financial statements. It allows investors to analyze the financial performance for the immediate previous 12 months. Users can now view the TTM Results in the results tab to get the most up to date information about the company.

This is it for now from Team StockEdge. We hope these features enhance your investment journey and make StockEdge more valuable to you. If you enjoy using StockEdge, don’t hold back from sharing the platform with your near and dear ones.
Check out StockEdge’s Premium Plans to get the most out of it.
Also, keep watching this space for our midweek and weekend editions of ‘Trending Stocks‘ and ‘Stock Insights‘.


Nice