StockEdge.com
  • Go Premium
    • StockEdge Quarterly Plan
    • StockEdge Annual Plan
    • StockEdge Analyst
    • StockEdge Club
    • Compare Plans
StockEdge Blog
  • Trending Stocks
  • Insights
    • All
    • Business Houses
    • Markets themes
    • Stock Insights
    How Page Industries is creating a “branded” opportunity in a fragmented market

    How Page Industries is creating a “branded” opportunity in a fragmented market

    5 Stocks which are Consistently Paying Dividend

    5 Stocks which are Consistently Paying Dividend

    Elgi Equipments – Enjoying Strong Tailwinds

    Elgi Equipments – Enjoying Strong Tailwinds

    J.B. Chemicals & Pharmaceuticals – One of India’s fastest-growing pharmaceutical companies

    J.B. Chemicals & Pharmaceuticals – One of India’s fastest-growing pharmaceutical companies

    Blue Dart Express – A market leader in Air Express Industry

    Blue Dart Express – A market leader in Air Express Industry

    Hindustan Foods – A market leader in FMCG contract manufacturing

    Hindustan Foods – A market leader in FMCG contract manufacturing

    Sharda Cropchem – Ending the year with a strong performance in Q4FY22

    Sharda Cropchem – Ending the year with a strong performance in Q4FY22

    ABB India – An outstanding overall performance

    ABB India – An outstanding overall performance

    Apcotex Industries Ltd. – Strongly Outperforming

    Apcotex Industries Ltd. – Strongly Outperforming

  • Technical Analysis
    Derivative Analytics

    Derivative Analytics – An Insightful Research Tool

    Put-Call Ratio – A Powerful Derivatives Indicator

    Put-Call Ratio – A Powerful Derivatives Indicator

    Beta & Beta Scans – A Powerful Technical Indicator

    Beta & Beta Scans – A Powerful Technical Indicator

    Technical Analysis using Edge Charts

    Technical Analysis using Edge Charts

    Adaptive Relative Strength & Static Relative Strength Scans

    Adaptive Relative Strength & Static Relative Strength Scans

    SuperTrend Indicator : Sell or Buy Signals

    SuperTrend Indicator : Sell or Buy Signals

    2 year and 5 year Price Breakout Scans

    2 year and 5 year Price Breakout Scans

    What is Narrow Range Scans (NR)

    What is Narrow Range Scans (NR)

    Relative Strength (RS)

    Relative Strength (RS)

  • Fundamental Analysis
    • All
    • Cash Flow Ratios
    • Efficiency ratios
    • Growth Ratios
    • Liquidity Ratios
    • Return Ratios
    • Solvency ratios
    • Valuation Ratios
    Understanding the Importance of creating Fundamental Scans

    Understanding the Importance of creating Fundamental Scans

    Using My Combination Scan to Identify best in an Industry

    Using My Combination Scan to Identify best in an Industry

    Cost Income ratio

    Cost to Income Ratio(%)

    Cost of Liability

    Cost of Liabilities (%)

    Operating Cost to Assets Ratio (%)

    Operating Cost to Assets Ratio (%)

    Promoter pledge

    Promoter Pledge: Know Everything about it

  • StockEdge Tutorials
    StockEdge Version 8.1 – It keeps getting Better & Better

    StockEdge Version 8.1 – It keeps getting Better & Better

    StockEdge Version Update 8.0 – Like never before

    StockEdge Version Update 8.0 – Like never before

    Derivative Analytics

    Derivative Analytics – An Insightful Research Tool

    Market Breadth – A Bird’s Eye View of the Market at 1 place

    Market Breadth – A Bird’s Eye View of the Market at 1 place

    StockEdge Version 7.6 released – Enhancing your investment journey further!

    StockEdge Version 7.6 released – Enhancing your investment journey further!

    Using Investor Portfolios Section to track Big Bulls like Rakesh Jhunjhunwala

    Using Investor Portfolios Section to track Big Bulls like Rakesh Jhunjhunwala

    Beta & Beta Scans – A Powerful Technical Indicator

    Beta & Beta Scans – A Powerful Technical Indicator

    StockEdge Version Update 7.4 – Enhancing your Investment Journey

    StockEdge Version Update 7.4 – Enhancing your Investment Journey

    StockEdge 7.3 Release

    StockEdge 7.3 Release

  • Mutual Fund
    Top 5 Mutual Funds for 2022 where you can start your SIP

    Top 5 Mutual Funds for 2022 where you can start your SIP

    What are Value Funds and its Advantages?

    What are Value Funds and its Advantages?

    A Beginners Guide to Thematic Funds

    A Beginners Guide to Thematic Funds

    Understanding Sector Funds and their Benefits to our Portfolio

    Understanding Sector Funds and their Benefits to our Portfolio

    Are Dividend Yield Funds a good option to invest in?

    Are Dividend Yield Funds a good option to invest in?

    What are Contra Funds and their advantages?

    What are Contra Funds and their advantages?

    Trending Tags

    No Result
    View All Result
    • Trending Stocks
    • Insights
      • All
      • Business Houses
      • Markets themes
      • Stock Insights
      How Page Industries is creating a “branded” opportunity in a fragmented market

      How Page Industries is creating a “branded” opportunity in a fragmented market

      5 Stocks which are Consistently Paying Dividend

      5 Stocks which are Consistently Paying Dividend

      Elgi Equipments – Enjoying Strong Tailwinds

      Elgi Equipments – Enjoying Strong Tailwinds

      J.B. Chemicals & Pharmaceuticals – One of India’s fastest-growing pharmaceutical companies

      J.B. Chemicals & Pharmaceuticals – One of India’s fastest-growing pharmaceutical companies

      Blue Dart Express – A market leader in Air Express Industry

      Blue Dart Express – A market leader in Air Express Industry

      Hindustan Foods – A market leader in FMCG contract manufacturing

      Hindustan Foods – A market leader in FMCG contract manufacturing

      Sharda Cropchem – Ending the year with a strong performance in Q4FY22

      Sharda Cropchem – Ending the year with a strong performance in Q4FY22

      ABB India – An outstanding overall performance

      ABB India – An outstanding overall performance

      Apcotex Industries Ltd. – Strongly Outperforming

      Apcotex Industries Ltd. – Strongly Outperforming

    • Technical Analysis
      Derivative Analytics

      Derivative Analytics – An Insightful Research Tool

      Put-Call Ratio – A Powerful Derivatives Indicator

      Put-Call Ratio – A Powerful Derivatives Indicator

      Beta & Beta Scans – A Powerful Technical Indicator

      Beta & Beta Scans – A Powerful Technical Indicator

      Technical Analysis using Edge Charts

      Technical Analysis using Edge Charts

      Adaptive Relative Strength & Static Relative Strength Scans

      Adaptive Relative Strength & Static Relative Strength Scans

      SuperTrend Indicator : Sell or Buy Signals

      SuperTrend Indicator : Sell or Buy Signals

      2 year and 5 year Price Breakout Scans

      2 year and 5 year Price Breakout Scans

      What is Narrow Range Scans (NR)

      What is Narrow Range Scans (NR)

      Relative Strength (RS)

      Relative Strength (RS)

    • Fundamental Analysis
      • All
      • Cash Flow Ratios
      • Efficiency ratios
      • Growth Ratios
      • Liquidity Ratios
      • Return Ratios
      • Solvency ratios
      • Valuation Ratios
      Understanding the Importance of creating Fundamental Scans

      Understanding the Importance of creating Fundamental Scans

      Using My Combination Scan to Identify best in an Industry

      Using My Combination Scan to Identify best in an Industry

      Cost Income ratio

      Cost to Income Ratio(%)

      Cost of Liability

      Cost of Liabilities (%)

      Operating Cost to Assets Ratio (%)

      Operating Cost to Assets Ratio (%)

      Promoter pledge

      Promoter Pledge: Know Everything about it

    • StockEdge Tutorials
      StockEdge Version 8.1 – It keeps getting Better & Better

      StockEdge Version 8.1 – It keeps getting Better & Better

      StockEdge Version Update 8.0 – Like never before

      StockEdge Version Update 8.0 – Like never before

      Derivative Analytics

      Derivative Analytics – An Insightful Research Tool

      Market Breadth – A Bird’s Eye View of the Market at 1 place

      Market Breadth – A Bird’s Eye View of the Market at 1 place

      StockEdge Version 7.6 released – Enhancing your investment journey further!

      StockEdge Version 7.6 released – Enhancing your investment journey further!

      Using Investor Portfolios Section to track Big Bulls like Rakesh Jhunjhunwala

      Using Investor Portfolios Section to track Big Bulls like Rakesh Jhunjhunwala

      Beta & Beta Scans – A Powerful Technical Indicator

      Beta & Beta Scans – A Powerful Technical Indicator

      StockEdge Version Update 7.4 – Enhancing your Investment Journey

      StockEdge Version Update 7.4 – Enhancing your Investment Journey

      StockEdge 7.3 Release

      StockEdge 7.3 Release

    • Mutual Fund
      Top 5 Mutual Funds for 2022 where you can start your SIP

      Top 5 Mutual Funds for 2022 where you can start your SIP

      What are Value Funds and its Advantages?

      What are Value Funds and its Advantages?

      A Beginners Guide to Thematic Funds

      A Beginners Guide to Thematic Funds

      Understanding Sector Funds and their Benefits to our Portfolio

      Understanding Sector Funds and their Benefits to our Portfolio

      Are Dividend Yield Funds a good option to invest in?

      Are Dividend Yield Funds a good option to invest in?

      What are Contra Funds and their advantages?

      What are Contra Funds and their advantages?

      Trending Tags

      No Result
      View All Result
      StockEdge Blog
      Home Tutorials StockEdge Tutorials
      StockEdge Version 7.6 released – Enhancing your investment journey further!

      StockEdge Version 7.6 released – Enhancing your investment journey further!

      StockEdge by StockEdge
      March 30, 2022
      Reading Time: 6 mins read
      2.1k
      VIEWS
      Share on FacebookShare on TwitterShare On WhatsApp

      Table of Contents

      • NSE Prices updated every minute
      • 6 new Profitability Scans by StockEdge
      • Price/Earning to Growth (PEG) Ratio & Scans by StockEdge
      • 10 Year timeframe in Price Chart
      • Price Change data in Forthcoming Results Tab

      Time to update!
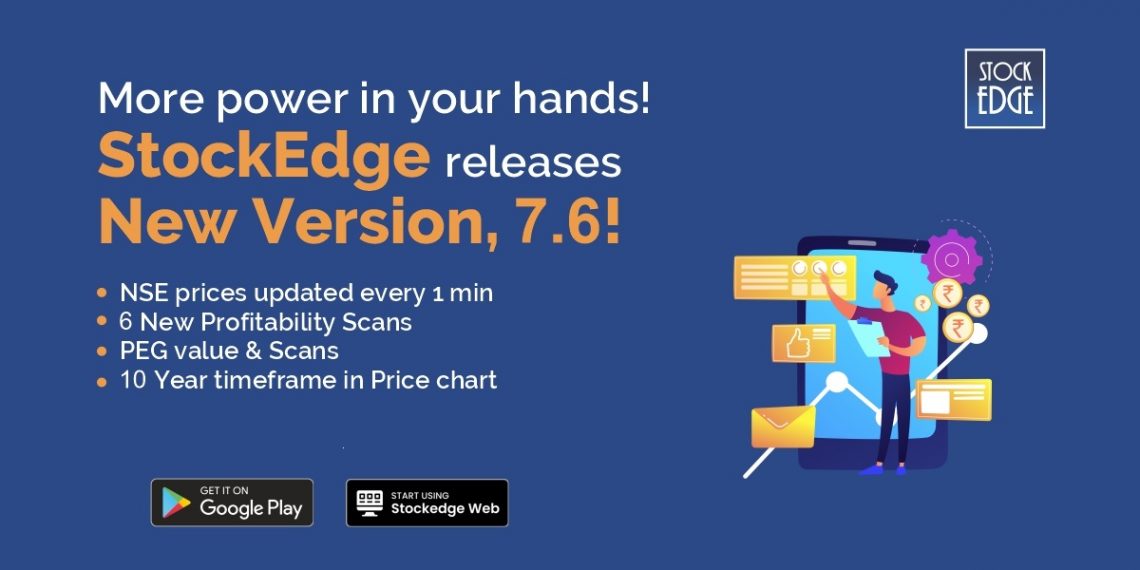
      StockEdge is happy to release Version 7.6. With this update, we have onboarded features that will make financial research more efficient and improve the user experience. 

      The new features introduced by StockEdge are: 

      • NSE Prices updated every minute
      • 6 new Profitability Scans
      • Price-Earning/Growth (PEG) Ratio & Scans
      • 10 Year timeframe in Price Chart. 
      • Price Change data in Forthcoming Results Tab

      Let’s take a look at each of these StockEdge features individually to understand how they help users. 

      NSE Prices updated every minute

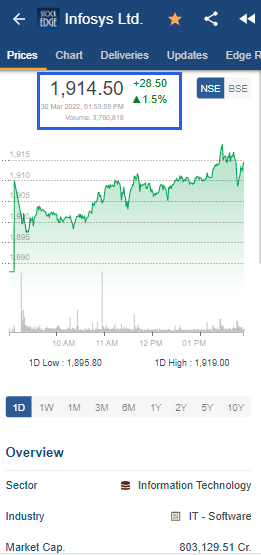
      With this version update, stock prices of NSE listed stocks will be updated close to real-time i.e at an interval of 1 minute. Since, the NSE prices are updated every minute, users will now be able to keep a better track of the markets using StockEdge. This addition will benefit intraday traders as well. 
      stockedge

      6 new Profitability Scans by StockEdge

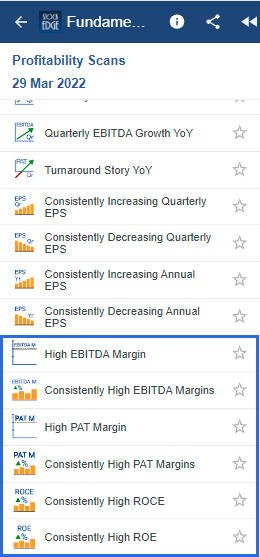
      The profitability metric evaluates a company’s ability to generate profits from sales or operations, balance sheet assets, or capital. They show how efficiently a company can generate profits and value for its shareholders. For most profitability indicators, having a high value compared to the values of competitors or relative to the same ratios of the previous period indicates that the company is performing well. Profitability metrics are most useful when compared to average metrics for similar companies, company history, or the company’s industry.

      Download StockEdge App Download StockEdge App Download StockEdge App
      1. High EBITDA Margin: Earnings before Interest, Tax, Depreciation and Amortization (EBITDA) Margin measures the operational efficiency of the company in terms of operating profit as a percentage of revenue. Those companies that have an EBITDA Margin greater than 20% for the latest financial year are included in this scan, indicating strong operational efficiency of the company due to lower operating expenses and/or higher revenue.
      2. Consistently High EBITDA Margin: Earnings before Interest, Tax, Depreciation and Amortization (EBITDA) Margin measures the operational efficiency of the company in terms of operating profit as a percentage of revenue. The companies that have an EBITDA Margin greater than 15% for each of the last 4 financial years qualify for this scan, which is an indication of stable cash flows for the company due to operational efficiency. 
      3. High PAT Margin: Profit after Tax (PAT) Margin is a financial performance ratio that is calculated by dividing net income by net sales. Those companies that have a PAT Margin greater than 10% for the latest financial year are included in this scan, indicating higher after tax profits from the given revenue stream due to efficient management of expenses. 
      4. Consistently High PAT Margins: Profit after Tax (PAT) Margin is a financial performance ratio that is calculated by dividing net income by net sales. The companies that have a PAT Margin greater than 10% for each of the last 4 financial years qualify for this scan, which is an indication of stable after tax profits for the company on each unit of revenue earned. 
      5. Consistently High ROCE: Return on Capital Employed (ROCE) is a financial ratio that shows if a company is doing a good job of generating profits from its capital and is calculated by dividing EBIT by total capital employed. The companies that have a ROCE greater than 15% for each of the last 4 financial years qualify for this scan, which is an indication of greater availability of funds to be reinvested for further growth in EPS. 
      6. Consistently High ROE: Return on Equity (ROE) is a measure of financial performance calculated by dividing net income by shareholders’ equity. The companies that have a ROE greater than 15% for each of the last 4 financial years qualify for this scan, which is an indication of stable returns for the equity shareholders due to efficient use of the equity base by the management. 
      stockedge

      Price/Earning to Growth (PEG) Ratio & Scans by StockEdge

      PEG Ratio is used to determine a stock’s value while incorporating the company’s expected earnings growth as well. PEG Ratio is calculated by dividing the PE Ratio of a stock by the earning’s growth rate over a specified time period. The growth rate has to be determined by the analysts. It can be a forward or historical growth rate and the time period chosen may differ between analysts. At StockEdge, we have estimated the growth rate using 5 year historical profit figures. The PEG Ratio of a company can be viewed on the price page of the stock. 

      2 new scans relating to PEG Ratio have been added. They are as follows: 

      1. High PEG Ratio: A high PEG Ratio indicates that the company is overvalued and the growth rates do not justify the price. All stocks that have a PEG Ratio greater than 1 qualify for this scan.  Avid followers of the PEG Ratio have a bearish view on stocks with PEG Ratio greater than 1. 
      2. Low PEG Ratio: A low PEG Ratio indicates that the company is undervalued and the growth rates have not fully been incorporated into the price. All stocks that have a PEG Ratio less than 1 qualify for this scan.  Avid followers of the PEG Ratio look out for stocks having a PEG Ratio less than 1 and form a  bullish view on those stocks.
      stockedge

      10 Year timeframe in Price Chart

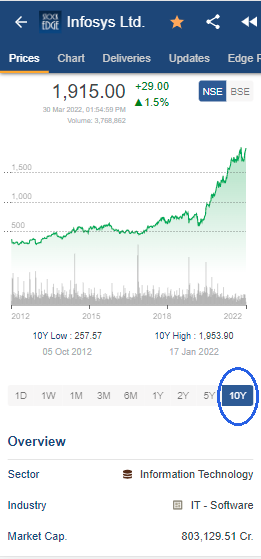
      Users will now be able to see the 10 Year price history of a stock on the price chart. This will provide a long term view of the performance history of a company to the user. 
      stockedge

      Price Change data in Forthcoming Results Tab

      Users can now view the change in the 1 day price and see the 1 week spark line for stocks that will declare results soon in the future. This helps users understand the expectations of the result and the sentiment of the marker participants.

      stockedge

      This is it for now from Team StockEdge. We hope these features enhance your investment journey and make StockEdge more valuable to you. If you enjoy using StockEdge, don’t hold back from sharing the platform with your near and dear ones.

      Check out StockEdge’s Premium Plans to get the most out of it.

      Also, keep watching this space for our midweek and weekend editions of ‘Trending Stocks‘ and ‘Stock Insights‘.

      Tags: NSE Delayed pricesPEG RatioresearchStockEdgestocksVersion update
      ShareTweetSend
      Subscribe On Telegram Subscribe On Telegram Subscribe On Telegram
      Previous Post

      Supreme Petrochem Ltd. – Pioneer in Polystyrene Market

      Next Post

      What Does the Merger of PVR and Inox Imply?

      StockEdge

      StockEdge

      StockEdge is a self-help Equity and Mutual Fund research tool. It empowers retail investors to identify investment opportunity with all the necessary data and analytics.

      Related Posts

      StockEdge Version 8.1 – It keeps getting Better & Better
      StockEdge Tutorials

      StockEdge Version 8.1 – It keeps getting Better & Better

      June 13, 2022
      1.8k
      StockEdge Version Update 8.0 – Like never before
      StockEdge Tutorials

      StockEdge Version Update 8.0 – Like never before

      April 28, 2022
      7.4k
      Derivative Analytics
      StockEdge Tutorials

      Derivative Analytics – An Insightful Research Tool

      April 28, 2022
      2.9k
      Next Post
      What Does the Merger of PVR and Inox Imply?

      What Does the Merger of PVR and Inox Imply?

      How is KEI Industries powering growth?

      How is KEI Industries powering growth?

      Why are HDFC Limited and HDFC Bank joining forces?

      Why are HDFC Limited and HDFC Bank joining forces?

      Leave a Reply Cancel reply

      Your email address will not be published. Required fields are marked *

      Contact Us

      • Timing (Mon-Sat): 10 am to 7 pm
      • Sales: +919830994463
      • Support: +919830994402
      • Club Support: +916289906895
      • Affiliate: +917003567131

      Recent Posts

      How Page Industries is creating a “branded” opportunity in a fragmented market

      June 26, 2022

      5 Stocks which are Consistently Paying Dividend

      June 19, 2022

      Important Links

      • StockEdge.com
      • StockEdge Premium
      • - Quarterly Membership
      • - Annual Membership
      • StockEdge Analyst
      • StockEdge Club
      • Compare Plans

      An Initiative Of

      © 2021 Kredent InfoEdge Pvt Ltd.

      Facebook-f Twitter Instagram Linkedin-in Youtube Pinterest-p

      Get StockEdge App

      No Result
      View All Result
      • Home
      • Article Categories
        • Fundamental Analysis
        • Technical Analysis
        • Market Themes
        • StockEdge Tutorials
        • StockEdge Version Updates
      • StockEdge Premium
        • Quarterly Membership
        • Annual Membership
        • StockEdge Analyst
        • StockEdge Club
        • Compare Plans
      • Visit StockEdge.com

      © 2021 Kredent InfoEdge Pvt Ltd.