There are thousands of stocks to trade and invest, but finding out the right opportunity is a troublesome job. Depending upon the nature of your trading style, stock selection is very tedious and consumes a lot of time. For example, if you are a long term investor, you have to go through company’s fundamentals, industry overview and other micro and macro factors to come to a conclusion, whether to invest in a particular company or not.
On the other hand, if you are a short term trader (one or three months), you will look for momentum, which will generate profit within a very short span of time.
However, there are traders who do their stock trading, based on both technically sound and at the same time backed by good fundamentals. But tracking both technical and fundamental parameters is even more challenging and professional traders cannot afford so much time in analysis before taking a trade. So how to deal with this problem?
StockEdge can help you to solve this problem. Irrespective of the nature of your trading, you will able to choose or identify a potential stock within just 30seconds.
In StockEdge application, there are multiple functions by which you can choose or find out your perfect stock for trading and investment. In the ‘Scan’ section you will get every important component which helps you to find out perfect stocks according to your inputs.
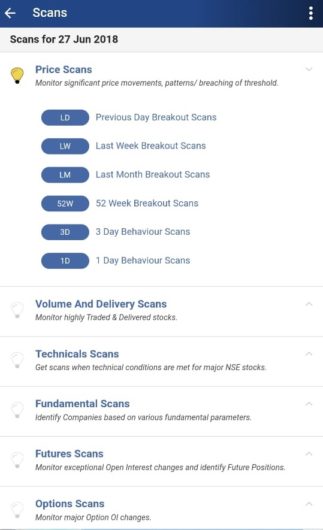
Basically, scans are divided into seven categories as you can see in this image. Each segment represents the different approach of identifying stocks. Every segment has its own unique style of scanning.
There are Price Scans, Volume And Delivery Scans, Technical Scans, Fundamental Scans, Future Scans and Options scans, and Candlestick Scans are available for traders. Similarly, there are Fundamental Scans for investors.
a. The ‘Price Scans’ segment, it has six different types of scan like- Previous Day Breakout Scans, last Week Breakout Scans, Last month breakout Scans etc. The trader can select an appropriate option based upon his/her trading style. (this will be discussed in the later part).
The image below shows pictures of different scans at a glance.
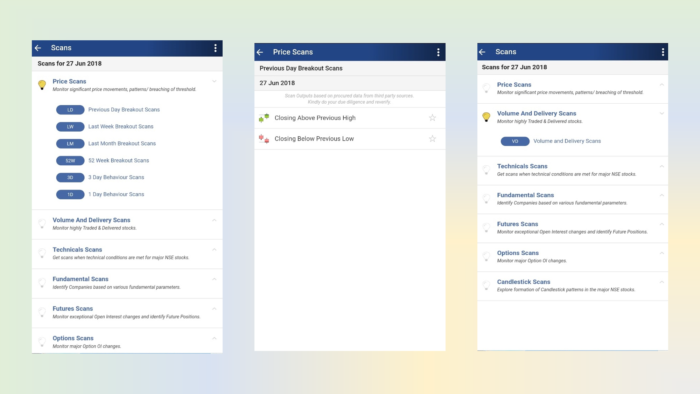
b. Just like the price scan, we have an option to scan stocks based on Volume and delivery. In this segment, stocks can be searched by selecting the specified conditions mentioned below.
- High Delivery Percentage
- Higher Delivery Quantity
- Higher Delivery Quantity and Percentage
- Higher Trade Quantity
- Higher Trade and Delivery Quantity
c. In the Technical scan section, there are indicators available for example, Simple Moving Average (SMA), Exponential Moving Average (EMA), Commodity Channel Index (CCI), Relative Strength Index (RSI), etc. Each indicator having multiple scans like
- Closing near 50 SMA
- Close crossing 100 SMA from below
- 50SMA crossing 100SMA from below, etc.
As per the requirement of the trader, these conditions can be selected.
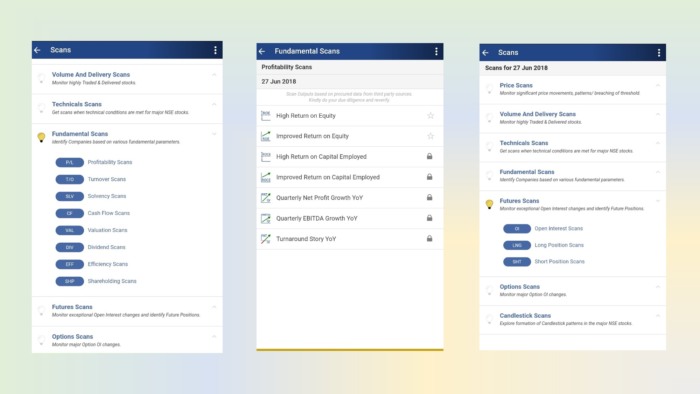
d. Fundamental scans represent Fundamental parameters like-
- Profitability Scan
- Turnover Scan
- Solvency Scan etc.
See also: Solvency Ratio
There are eight sub-categories in the Fundamental Scan tab and each one carrying different set of scans.
To ease your understanding, we are sharing conditions for Profitability Scan-
- High Return on Equity
- Improved return on Equity
- High return on Capital Employed etc.
We know how much it is important to look for the fundamentals of a company while making a long term investment. These Fundamental Scans will help an investment enthusiast to find out stocks based on his/her predefined conditions.
e. Future scan segment will let to identify stocks based on Open Interest decrease or Increase. In this segment –
- Open Interest Scans
- Long Position Scans
- Short Position Scans
These are various option available under the Future scan and each of them carrying different set of scanning criteria. For example, in the Open Interest Scans section we will find- High Increase in Future Open Interest and High Decrease in Future Open Interest.
f. Option Scan segment is best suited for the option trader. There are just two sets of scans available, which makes the search very easy and it also takes very short time to define the criteria.
Both these segment contains unique scans like –
- Index Strike with High increase in Call Open Interest
- Index strike with High Decrease in Call Open Interest
- Index Strikes with High Increase in put open Interest etc.
Also read : How Open Interest Analysis helps to identify market trends?
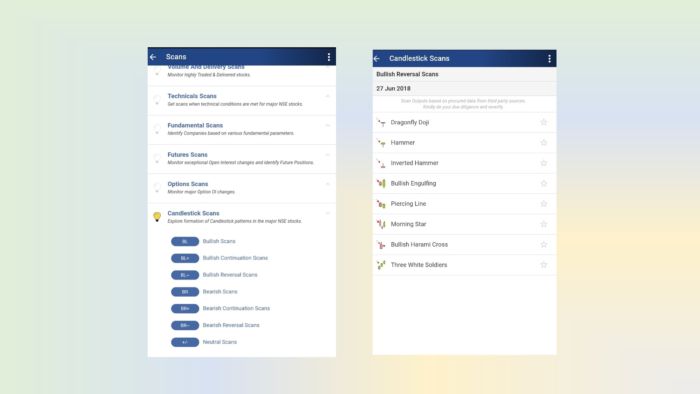
g. Candlestick scans contain seven different types of scan and each of them has multiple sets of conditions. Traders who follow candlestick patterns would really love this scans.
To get the best output from the above scans it is advisable to use Combination Scans where you can combine multiple scans to create your own strategy.
Bottomline
Technical and Fundamental are the main pillar of stock selection. Depending on the situation (Bullish/Bearish) of the market, we should decide what to choose and what not to, it is especially for the traders who follow technical analysis.
A trader who trades based on the news can also take the help of ‘Daily update’ section which provides news only related to the particular stock, but it is little delayed.
We also have a Stockedge club where Stock ideas, knowledge-based content, etc are shared, where all your queries related to market are solved. This club is specially handled by highly experienced people both in the field of technical analysis and fundamental analysis. It is important to mention that only premium member can join this club and if you are willing to learn new things about the market, then Stockedge club is for you.
Join StockEdge Club to get more such Stock Insights. Click to know more!
You can check out the desktop version of StockEdge.


