StockEdge.com
  • Products
    • StockEdge Premium
    • StockEdge Pro
    • StockEdge Club
    • Compare Plans
StockEdge Blog
  • Trending Stocks
  • Insights
    • All
    • Business Houses
    • Markets themes
    • Stock Insights
    Top 5 Textile stocks

    Top 5 Textile Stocks in India: From Cotton to Cash

    multi-bagger stocks for 2025

    5 Multibagger Stocks to keep an eagle-eye for 2025

    Jindal Saw – Strong Earnings Momentum Ahead

    Jindal Saw – Strong Earnings Momentum Ahead

    Kirloskar Group- A Legacy of 134 Years

    Kirloskar Group- A Legacy of 134 Years

    renewable energy stocks in india

    Top Renewable Energy Stocks in India

    blue chip stocks

    Top 5 Blue Chip Stocks to Buy and Invest in 2023

    Budget 2023: Stocks to keep an eye on

    Budget 2023: Stocks to keep an eye on

    Adani Enterprises FPO: Detailed Analysis, GMP and Review?

    Adani Enterprises FPO: Detailed Analysis, GMP and Review?

    Top 5 Defence Stocks to Invest in India

    Top 5 Defence Stocks to Invest in India

  • Technical Analysis
    Chart Patterns – Holy grail of Stock Market Analysis

    Chart Patterns – Holy grail of Stock Market Analysis

    StockEdge Version Update : 9.0

    StockEdge Version Update : 9.0

    Beat the street with Sector Rotation Strategy

    Beat the street with Sector Rotation Strategy

    StockEdge Version Update 8.2

    StockEdge Version Update 8.2

    Derivative Analytics

    An Insightful Research Tool For Derivative Analytics

    Introducing Put-Call Ratio a Derivative Indicator in the Market

    Introducing Put-Call Ratio a Derivative Indicator in the Market

    A Powerful Technical Indicator Beta & Beta Scans

    A Powerful Technical Indicator Beta & Beta Scans

    Technical Analysis using Edge Charts

    Technical Analysis using Edge Charts

    adaptive relative strength and static relative strength scans

    What is Adaptive Relative Strength & Static Relative Strength Scans?

  • Fundamental Analysis
    • All
    • Cash Flow Ratios
    • Efficiency ratios
    • Growth Ratios
    • Liquidity Ratios
    • Return Ratios
    • Solvency ratios
    • Valuation Ratios
    high dividend paying stocks

    Identifying High Dividend Paying Stocks

    Understanding the Importance of creating Fundamental Scans

    Understanding the Importance of creating Fundamental Scans

    Using My Combination Scan to Identify best in an Industry

    Using My Combination Scan to Identify best in an Industry

    Cost Income ratio

    Cost to Income Ratio(%)

    Cost of Liability

    Cost of Liabilities (%)

    Operating Cost to Assets Ratio (%)

    Operating Cost to Assets Ratio (%)

  • StockEdge Tutorials
    StockEdge Club: An Exclusive Investors Hub & Analytics platform

    StockEdge Club: An Exclusive Investors Hub & Analytics platform

    FII/DII Data: Leading Indicators of Stock Market

    FII/DII Data: Leading Indicators of Stock Market

    Chart Patterns – Holy grail of Stock Market Analysis

    Chart Patterns – Holy grail of Stock Market Analysis

    StockEdge Version Update : 9.0

    StockEdge Version Update : 9.0

    Powerful Investment Themes for Retail Investors

    Powerful Investment Themes for Retail Investors

    Beat the street with Sector Rotation Strategy

    Beat the street with Sector Rotation Strategy

    StockEdge Version Update 8.3

    StockEdge Version Update 8.3

    StockEdge Version Update 8.2

    StockEdge Version Update 8.2

    Using Investor Portfolios Section to track Big Bulls like Rakesh Jhunjhunwala

    Using Investor Portfolios Section to track Big Bulls like Rakesh Jhunjhunwala

  • Mutual Fund
    Top 5 Mutual Funds for 2022 where you can start your SIP

    Top 5 Mutual Funds for 2022 where you can start your SIP

    What are Value Funds and its Advantages?

    What are Value Funds and its Advantages?

    thematic funds

    Thematic Funds : Everything you need to know

    Understanding Sector Funds and their Benefits to our Portfolio

    Understanding Sector Funds and their Benefits to our Portfolio

    Are Dividend Yield Funds a good option to invest in?

    Are Dividend Yield Funds a good option to invest in?

    What are Contra Funds and their advantages?

    What are Contra Funds and their advantages?

    Trending Tags

    No Result
    View All Result
    • Trending Stocks
    • Insights
      • All
      • Business Houses
      • Markets themes
      • Stock Insights
      Top 5 Textile stocks

      Top 5 Textile Stocks in India: From Cotton to Cash

      multi-bagger stocks for 2025

      5 Multibagger Stocks to keep an eagle-eye for 2025

      Jindal Saw – Strong Earnings Momentum Ahead

      Jindal Saw – Strong Earnings Momentum Ahead

      Kirloskar Group- A Legacy of 134 Years

      Kirloskar Group- A Legacy of 134 Years

      renewable energy stocks in india

      Top Renewable Energy Stocks in India

      blue chip stocks

      Top 5 Blue Chip Stocks to Buy and Invest in 2023

      Budget 2023: Stocks to keep an eye on

      Budget 2023: Stocks to keep an eye on

      Adani Enterprises FPO: Detailed Analysis, GMP and Review?

      Adani Enterprises FPO: Detailed Analysis, GMP and Review?

      Top 5 Defence Stocks to Invest in India

      Top 5 Defence Stocks to Invest in India

    • Technical Analysis
      Chart Patterns – Holy grail of Stock Market Analysis

      Chart Patterns – Holy grail of Stock Market Analysis

      StockEdge Version Update : 9.0

      StockEdge Version Update : 9.0

      Beat the street with Sector Rotation Strategy

      Beat the street with Sector Rotation Strategy

      StockEdge Version Update 8.2

      StockEdge Version Update 8.2

      Derivative Analytics

      An Insightful Research Tool For Derivative Analytics

      Introducing Put-Call Ratio a Derivative Indicator in the Market

      Introducing Put-Call Ratio a Derivative Indicator in the Market

      A Powerful Technical Indicator Beta & Beta Scans

      A Powerful Technical Indicator Beta & Beta Scans

      Technical Analysis using Edge Charts

      Technical Analysis using Edge Charts

      adaptive relative strength and static relative strength scans

      What is Adaptive Relative Strength & Static Relative Strength Scans?

    • Fundamental Analysis
      • All
      • Cash Flow Ratios
      • Efficiency ratios
      • Growth Ratios
      • Liquidity Ratios
      • Return Ratios
      • Solvency ratios
      • Valuation Ratios
      high dividend paying stocks

      Identifying High Dividend Paying Stocks

      Understanding the Importance of creating Fundamental Scans

      Understanding the Importance of creating Fundamental Scans

      Using My Combination Scan to Identify best in an Industry

      Using My Combination Scan to Identify best in an Industry

      Cost Income ratio

      Cost to Income Ratio(%)

      Cost of Liability

      Cost of Liabilities (%)

      Operating Cost to Assets Ratio (%)

      Operating Cost to Assets Ratio (%)

    • StockEdge Tutorials
      StockEdge Club: An Exclusive Investors Hub & Analytics platform

      StockEdge Club: An Exclusive Investors Hub & Analytics platform

      FII/DII Data: Leading Indicators of Stock Market

      FII/DII Data: Leading Indicators of Stock Market

      Chart Patterns – Holy grail of Stock Market Analysis

      Chart Patterns – Holy grail of Stock Market Analysis

      StockEdge Version Update : 9.0

      StockEdge Version Update : 9.0

      Powerful Investment Themes for Retail Investors

      Powerful Investment Themes for Retail Investors

      Beat the street with Sector Rotation Strategy

      Beat the street with Sector Rotation Strategy

      StockEdge Version Update 8.3

      StockEdge Version Update 8.3

      StockEdge Version Update 8.2

      StockEdge Version Update 8.2

      Using Investor Portfolios Section to track Big Bulls like Rakesh Jhunjhunwala

      Using Investor Portfolios Section to track Big Bulls like Rakesh Jhunjhunwala

    • Mutual Fund
      Top 5 Mutual Funds for 2022 where you can start your SIP

      Top 5 Mutual Funds for 2022 where you can start your SIP

      What are Value Funds and its Advantages?

      What are Value Funds and its Advantages?

      thematic funds

      Thematic Funds : Everything you need to know

      Understanding Sector Funds and their Benefits to our Portfolio

      Understanding Sector Funds and their Benefits to our Portfolio

      Are Dividend Yield Funds a good option to invest in?

      Are Dividend Yield Funds a good option to invest in?

      What are Contra Funds and their advantages?

      What are Contra Funds and their advantages?

      Trending Tags

      No Result
      View All Result
      StockEdge Blog
      Home Tutorials
      How to Identify Stocks to Avoid for Investment?

      How to Identify Stocks to Avoid for Investment?

      StockEdge by StockEdge
      March 28, 2020
      Reading Time: 4 mins read
      4k
      VIEWS
      Share on FacebookShare on TwitterShare On WhatsApp

      Table of Contents

      • Stocks to avoid investment
      • Scans
      • Definition
      • Conclusion

      Sometimes due to lack of knowledge on the subject, the Stock Market participants buy some fundamentally weak stocks and hence end up losing a major part of their capital. In this manner, they start avoiding the markets and thus lose out on a good money-making proposition.

      So what if we can have an instrument or a screener in which we can scrape out those companies which can erode our invested Capital.

      Stocks to avoid investment

      With Stockedge you can scan and identify such companies quite easily by using Combination scans

      So what can be the parameters which can be used under combination scans which can give us the required output of weak stocks to avoid.

      By using just 4 to 5 parameters one can filter out such companies through Combination scans.

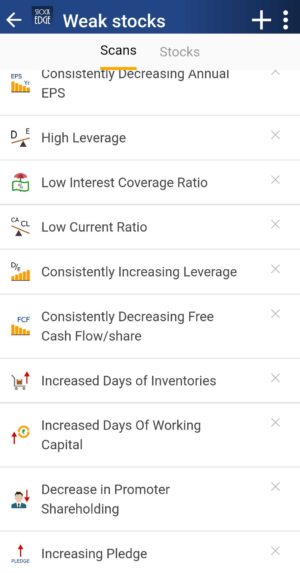
      So the scans which could raise a red flag for such companies are the following

      Scans

      • High Leverage and Consistently Increasing Leverage
      • Low Interest Coverage Ratio
      • Low Current Ratio
      • Consistently decreasing Annual EPS/Quarterly EPS
      • Consistently decreasing Free Cash Flow per share
      • Increased days of Inventories
      • Increased days of Working Capital
      • Decrease in Promoter/FII/DII holding
      • Increasing Pledge and High Pledge

      So these, when put together in different combinations, will give us the knowledge for the stocks to avoid by an Investor or a trader.
      Stocks to avoid

      Definition

      So now let’s understand each one of them.

      High Leverage and Consistently increasing Leverage: High Leverage means debt Equity ratio is more than 2 that means any macro or micro changes in the industry to hugely affect the company’s performance. Investors tend to stay away from highly leveraged companies. Consistently increasing leverage is not a good sign, as interest payment burden increases and hence the company’s operation suffers. The high interest cost gets difficult to service whenever there is any change in the interest rate scenario and hence affects the financials.

      Low Interest Coverage Ratio: It means that the company to face difficulty during adverse times to meet its interest obligations as Interest coverage ratio is low.

      Low Current Ratio:  It means the chances for the company to have a deficiency in liquidating its assets for paying of its debt obligations is high. Thus they are those laggards from which the Investor forums tend to stay away. A ratio lower than 0.75 is called as Low Current Ratio.

      See also: How to track what is going on in your Stocks?

      Consistently decreasing Annual or Quarterly EPS:  The EPS depicts the earning of a company relative to its Price which means how much is an investor willing to pay for a rupee of a company’s earning. Thus if the Annual or Quarterly EPS decreases consistently then it means that the company’s earnings are declining and thus not in line to the company’s price per share.

      Consistently decreasing Free Cash Flow per share: Decreasing FCF might signal that the company is not able to sustain its earnings growth. An insufficient FCF for earnings growth can force a company to increase its debt levels or not have the liquidity to stay in business.

      Increased days of Inventories: It means that the company is unable to convert its goods into sales as it has purchased more than it can sell. Thus the cash flow is impacted negatively if Inventory turnover ratio increases. It raises concern about the company’s ability to convert its inventory to sales in case the ratio continues to increase.

      Increased days of Working Capital: If the working capital days of the company is high, it implies that the current assets are tied up for more period of time and thus it can lead to more working capital loan if it continues to increase in the same pace. This is viewed as a negative for the company as the business of the company will be affected affecting the bottomline.

      Decrease in Promoter/DII/FII holding: If the Promoter of the company starts selling shares then it is viewed as negative as there might be something weak regarding the working of the company or future prospects. Similarly FII and DII are far smarter people who do their indepth research and if found bad discard the shares and get out of them. Thus these kinds of shares should be best avoided.

      Conclusion

      Thus use any of these scans in combination and check out if the stocks to avoid. If you are holding them then get out of them as now you know why they were giving you losses and invest into better opportunities.

      Click here to know more about the offering of StockEdge Premium

      Tags: Efficiency Scanfinancial analysisfinancial leverageFundamental scansMy Combination ScansSolvencyStockEdgeStockedge feature
      ShareTweetSend
      Subscribe On Telegram Subscribe On Telegram Subscribe On Telegram
      Previous Post

      Understanding the Importance of creating Fundamental Scans

      Next Post

      Launching StockEdge Web

      StockEdge

      StockEdge

      StockEdge is a self-help Equity and Mutual Fund research tool. It empowers retail investors to identify investment opportunity with all the necessary data and analytics.

      Next Post
      Launching StockEdge Web

      Launching StockEdge Web

      Identify growth companies for Long term Investment

      Identify growth companies for Long term Investment

      Understand Fundamental Parameter of Combination Scan

      Understand Fundamental Parameter of Combination Scan

      Leave a Reply Cancel reply

      Your email address will not be published. Required fields are marked *

      Contact Us
      • Timing (Mon-Sat): 10 am to 7 pm
      • Sales: +919830994463
      • Support: +919830994402
      • Club Support: +916289906895
      • Affiliate: +917003567131
      Recent Posts
      Top 5 Textile stocks
      Top 5 Textile Stocks in India: From Cotton to Cash
      multi-bagger stocks for 2025
      5 Multibagger Stocks to keep an eagle-eye for 2025
      Important Links
      • StockEdge.com
      • StockEdge Premium
      • - Quarterly Membership
      • - Annual Membership
      • StockEdge Analyst
      • StockEdge Club
      • Compare Plans
      An Initiative Of

      © 2023 Kredent InfoEdge Pvt Ltd.

      Facebook-f Twitter Instagram Linkedin-in Youtube Pinterest-p

      Get StockEdge App

      No Result
      View All Result
      • Home
      • Article Categories
        • Fundamental Analysis
        • Technical Analysis
        • Market Themes
        • StockEdge Tutorials
        • StockEdge Version Updates
      • Products
        • StockEdge Premium
        • StockEdge Pro
        • StockEdge Club
        • Compare Plans
      • Visit StockEdge.com

      © 2023 Kredent InfoEdge Pvt Ltd.