StockEdge.com
  • Products
    • StockEdge Premium
    • StockEdge Pro
    • StockEdge Club
    • Compare Plans
StockEdge Blog
  • Trending Stocks
  • Insights
    • All
    • Business Houses
    • Markets themes
    • Stock Insights
    Top 5 Textile stocks

    Top 5 Textile Stocks in India: From Cotton to Cash

    multi-bagger stocks for 2025

    5 Multibagger Stocks to keep an eagle-eye for 2025

    Jindal Saw – Strong Earnings Momentum Ahead

    Jindal Saw – Strong Earnings Momentum Ahead

    Kirloskar Group- A Legacy of 134 Years

    Kirloskar Group- A Legacy of 134 Years

    renewable energy stocks in india

    Top Renewable Energy Stocks in India

    blue chip stocks

    Top 5 Blue Chip Stocks to Buy and Invest in 2023

    Budget 2023: Stocks to keep an eye on

    Budget 2023: Stocks to keep an eye on

    Adani Enterprises FPO: Detailed Analysis, GMP and Review?

    Adani Enterprises FPO: Detailed Analysis, GMP and Review?

    Top 5 Defence Stocks to Invest in India

    Top 5 Defence Stocks to Invest in India

  • Technical Analysis
    Chart Patterns – Holy grail of Stock Market Analysis

    Chart Patterns – Holy grail of Stock Market Analysis

    StockEdge Version Update : 9.0

    StockEdge Version Update : 9.0

    Beat the street with Sector Rotation Strategy

    Beat the street with Sector Rotation Strategy

    StockEdge Version Update 8.2

    StockEdge Version Update 8.2

    Derivative Analytics

    An Insightful Research Tool For Derivative Analytics

    Introducing Put-Call Ratio a Derivative Indicator in the Market

    Introducing Put-Call Ratio a Derivative Indicator in the Market

    A Powerful Technical Indicator Beta & Beta Scans

    A Powerful Technical Indicator Beta & Beta Scans

    Technical Analysis using Edge Charts

    Technical Analysis using Edge Charts

    adaptive relative strength and static relative strength scans

    What is Adaptive Relative Strength & Static Relative Strength Scans?

  • Fundamental Analysis
    • All
    • Cash Flow Ratios
    • Efficiency ratios
    • Growth Ratios
    • Liquidity Ratios
    • Return Ratios
    • Solvency ratios
    • Valuation Ratios
    high dividend paying stocks

    Identifying High Dividend Paying Stocks

    Understanding the Importance of creating Fundamental Scans

    Understanding the Importance of creating Fundamental Scans

    Using My Combination Scan to Identify best in an Industry

    Using My Combination Scan to Identify best in an Industry

    Cost Income ratio

    Cost to Income Ratio(%)

    Cost of Liability

    Cost of Liabilities (%)

    Operating Cost to Assets Ratio (%)

    Operating Cost to Assets Ratio (%)

  • StockEdge Tutorials
    StockEdge Club: An Exclusive Investors Hub & Analytics platform

    StockEdge Club: An Exclusive Investors Hub & Analytics platform

    FII/DII Data: Leading Indicators of Stock Market

    FII/DII Data: Leading Indicators of Stock Market

    Chart Patterns – Holy grail of Stock Market Analysis

    Chart Patterns – Holy grail of Stock Market Analysis

    StockEdge Version Update : 9.0

    StockEdge Version Update : 9.0

    Powerful Investment Themes for Retail Investors

    Powerful Investment Themes for Retail Investors

    Beat the street with Sector Rotation Strategy

    Beat the street with Sector Rotation Strategy

    StockEdge Version Update 8.3

    StockEdge Version Update 8.3

    StockEdge Version Update 8.2

    StockEdge Version Update 8.2

    Using Investor Portfolios Section to track Big Bulls like Rakesh Jhunjhunwala

    Using Investor Portfolios Section to track Big Bulls like Rakesh Jhunjhunwala

  • Mutual Fund
    Top 5 Mutual Funds for 2022 where you can start your SIP

    Top 5 Mutual Funds for 2022 where you can start your SIP

    What are Value Funds and its Advantages?

    What are Value Funds and its Advantages?

    thematic funds

    Thematic Funds : Everything you need to know

    Understanding Sector Funds and their Benefits to our Portfolio

    Understanding Sector Funds and their Benefits to our Portfolio

    Are Dividend Yield Funds a good option to invest in?

    Are Dividend Yield Funds a good option to invest in?

    What are Contra Funds and their advantages?

    What are Contra Funds and their advantages?

    Trending Tags

    No Result
    View All Result
    • Trending Stocks
    • Insights
      • All
      • Business Houses
      • Markets themes
      • Stock Insights
      Top 5 Textile stocks

      Top 5 Textile Stocks in India: From Cotton to Cash

      multi-bagger stocks for 2025

      5 Multibagger Stocks to keep an eagle-eye for 2025

      Jindal Saw – Strong Earnings Momentum Ahead

      Jindal Saw – Strong Earnings Momentum Ahead

      Kirloskar Group- A Legacy of 134 Years

      Kirloskar Group- A Legacy of 134 Years

      renewable energy stocks in india

      Top Renewable Energy Stocks in India

      blue chip stocks

      Top 5 Blue Chip Stocks to Buy and Invest in 2023

      Budget 2023: Stocks to keep an eye on

      Budget 2023: Stocks to keep an eye on

      Adani Enterprises FPO: Detailed Analysis, GMP and Review?

      Adani Enterprises FPO: Detailed Analysis, GMP and Review?

      Top 5 Defence Stocks to Invest in India

      Top 5 Defence Stocks to Invest in India

    • Technical Analysis
      Chart Patterns – Holy grail of Stock Market Analysis

      Chart Patterns – Holy grail of Stock Market Analysis

      StockEdge Version Update : 9.0

      StockEdge Version Update : 9.0

      Beat the street with Sector Rotation Strategy

      Beat the street with Sector Rotation Strategy

      StockEdge Version Update 8.2

      StockEdge Version Update 8.2

      Derivative Analytics

      An Insightful Research Tool For Derivative Analytics

      Introducing Put-Call Ratio a Derivative Indicator in the Market

      Introducing Put-Call Ratio a Derivative Indicator in the Market

      A Powerful Technical Indicator Beta & Beta Scans

      A Powerful Technical Indicator Beta & Beta Scans

      Technical Analysis using Edge Charts

      Technical Analysis using Edge Charts

      adaptive relative strength and static relative strength scans

      What is Adaptive Relative Strength & Static Relative Strength Scans?

    • Fundamental Analysis
      • All
      • Cash Flow Ratios
      • Efficiency ratios
      • Growth Ratios
      • Liquidity Ratios
      • Return Ratios
      • Solvency ratios
      • Valuation Ratios
      high dividend paying stocks

      Identifying High Dividend Paying Stocks

      Understanding the Importance of creating Fundamental Scans

      Understanding the Importance of creating Fundamental Scans

      Using My Combination Scan to Identify best in an Industry

      Using My Combination Scan to Identify best in an Industry

      Cost Income ratio

      Cost to Income Ratio(%)

      Cost of Liability

      Cost of Liabilities (%)

      Operating Cost to Assets Ratio (%)

      Operating Cost to Assets Ratio (%)

    • StockEdge Tutorials
      StockEdge Club: An Exclusive Investors Hub & Analytics platform

      StockEdge Club: An Exclusive Investors Hub & Analytics platform

      FII/DII Data: Leading Indicators of Stock Market

      FII/DII Data: Leading Indicators of Stock Market

      Chart Patterns – Holy grail of Stock Market Analysis

      Chart Patterns – Holy grail of Stock Market Analysis

      StockEdge Version Update : 9.0

      StockEdge Version Update : 9.0

      Powerful Investment Themes for Retail Investors

      Powerful Investment Themes for Retail Investors

      Beat the street with Sector Rotation Strategy

      Beat the street with Sector Rotation Strategy

      StockEdge Version Update 8.3

      StockEdge Version Update 8.3

      StockEdge Version Update 8.2

      StockEdge Version Update 8.2

      Using Investor Portfolios Section to track Big Bulls like Rakesh Jhunjhunwala

      Using Investor Portfolios Section to track Big Bulls like Rakesh Jhunjhunwala

    • Mutual Fund
      Top 5 Mutual Funds for 2022 where you can start your SIP

      Top 5 Mutual Funds for 2022 where you can start your SIP

      What are Value Funds and its Advantages?

      What are Value Funds and its Advantages?

      thematic funds

      Thematic Funds : Everything you need to know

      Understanding Sector Funds and their Benefits to our Portfolio

      Understanding Sector Funds and their Benefits to our Portfolio

      Are Dividend Yield Funds a good option to invest in?

      Are Dividend Yield Funds a good option to invest in?

      What are Contra Funds and their advantages?

      What are Contra Funds and their advantages?

      Trending Tags

      No Result
      View All Result
      StockEdge Blog
      Home Tutorials StockEdge Tutorials
      Understand Fundamental Parameter of Combination Scan

      Understand Fundamental Parameter of Combination Scan

      StockEdge by StockEdge
      April 3, 2020
      Reading Time: 4 mins read
      3.1k
      VIEWS
      Share on FacebookShare on TwitterShare On WhatsApp

      Table of Contents

      • Combination Scan Steps:
        • Step 1:
        • Step 2:
        • Step 3:
        • Step 4:
        • Step 5:
      • Conclusion:

      StockEdge has this unique feature of Combination Scan, where one can mix and match different types of Scans be it Technical, Fundamental, Price, etc. to build our own set of Investing strategies.

      A combination scan helps in filtering stocks on the basis of multiple criteria, and greatly enhances the utility of scan feature but if we mix it with say Technical or Price Scans, then it would help us to bring out only those stocks which meet the defined criteria.

      As we are right now in the middle of a turmoil, let’s screen out the companies which have a sound fundamental and are trading around the 52-week high zone.

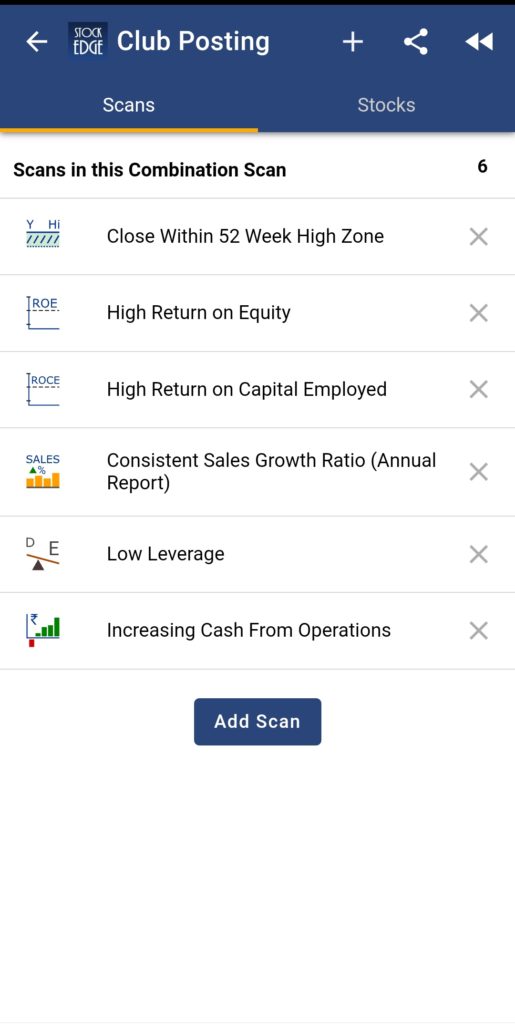
      The first step is to go to the “My Combination Scan” tab and save a Scan name. In my case, I have named it as “Club Posting”.

      Then, the next step is to click on the “+” sign on the top right-hand corner, to bring out the names of the Scans. Here, we would start building the Fundamental scan first.

      Combination Scan Steps:

      Step 1:

      Clicking on the “Fundamental Scan” tab, we would get a list of the variables available. So, the first thing for a good fundamental company is to have good “ROE” and “ROCE”.

      So, as it is related to the profitability of the company, we can find the “Profitability Scans”. We would want a company having a track record of high ROE and ROCE, so we will select “High ROE” and “High ROCE” from the list.

      Step 2:

      Now for good company Topline growth is a must as it shows that it is able to increase the market share of the product or services. There can be cases where topline is growing but market share is decreasing this happens when the Industry growth rate is higher than the company’s growth rate.

      So, we need to put a scan on Sales growth.

      Just below the “Profitability Scan”, we can find the “Turnover Scans”. Under that, we have 4 different options related to Sales growth. We would want a company which has consistent high sales growth ratio.

      So, we will click on “Consistent Sales Growth Ratio (Annual Report)”. This Scan means that on a yearly basis, the companies have a high sales growth ratio.
      combination scans

      Step 3:

      Now, debt forms an important part of any company, but during these times when everywhere there is a threat of revenue loss due to lockdowns, we would want a company with low leverage, which means companies with low Debt to Equity ratio.

      For that, we will go to the “Solvency Scans”. From there it is clear from the name that we have to choose “Low Leverage” Scan.

      Or we can also choose, “Moderate Leverage” but with that, we have to also bring in “High-Interest Coverage Ratio Scan” as for servicing the debts the company must have enough earning capacity. In my case, I have decided to be defensive on this matter and chose low leverage to be a factor.

      Step 4:

      After scanning the earning capacity of the companies, we need to find companies which have a consistent Cash generation capability, as we all know that ‘Cash is king’. During these tough times, the excess cash will help the company pay off the fixed costs. So, we need to find out companies which have been generating cash from operations consistently.

      Just below the Solvency Scans tab, there is a “Cash Flow Scan” tab. Upon clicking that we can find the option “Consistent Cash from Operations”. This scan would bring us the companies which have generated cash from operations consistently over the past 5 years.

      Step 5:

      The above 4 Scans have been completely related to the Fundamentals of a company. There would be many companies which would fall in the above few categories. Now, let’s filter the companies which would satisfy the above fundamental criteria and also would be trading in the 52-week zone.

      For that, we need to go to the “Price Scans”. Under Price Scan, we have to select the option “Close within the 52-week high zone”. These would show the companies which have their closing prices in the 52-week high zone.
      club posting

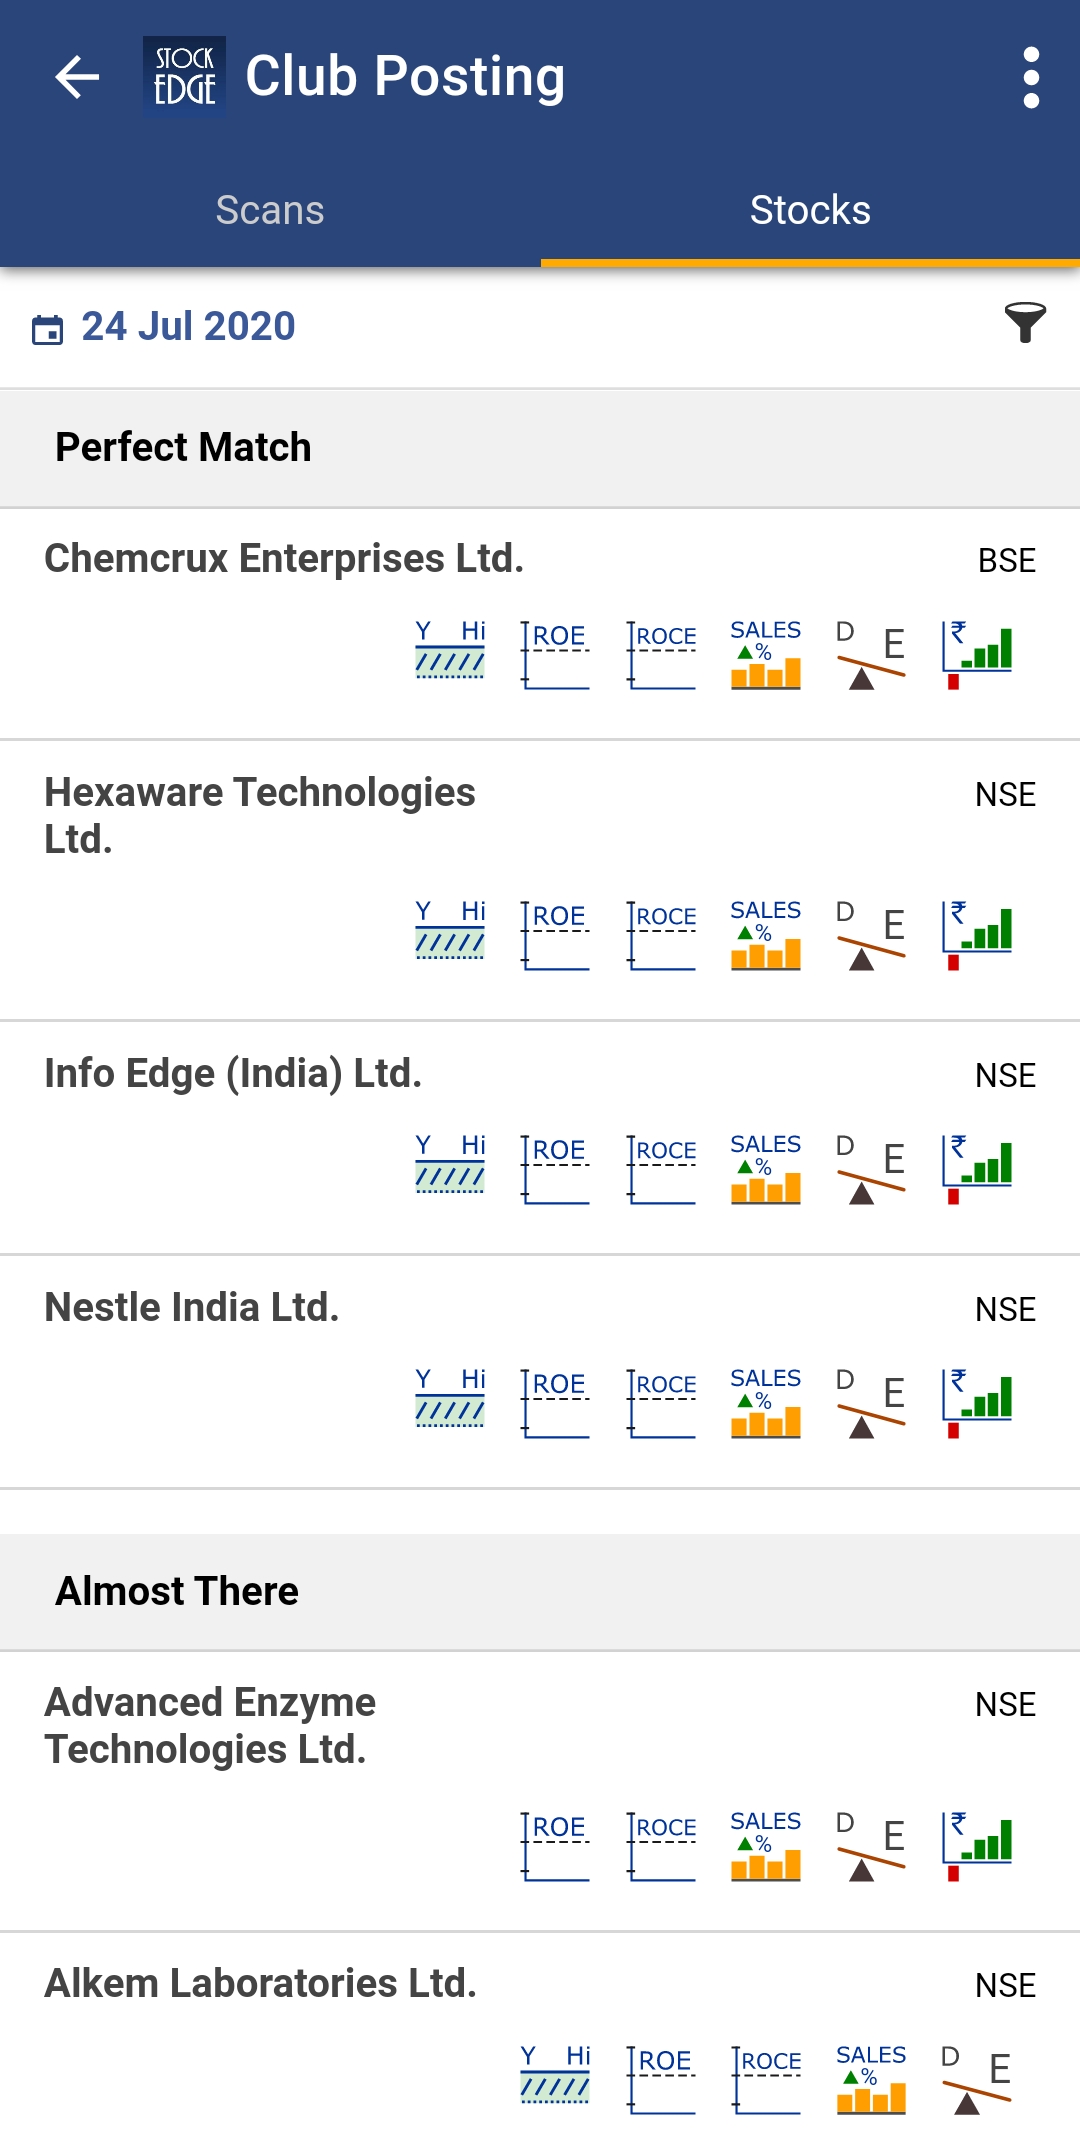
      Upon completing all the above steps, now we can see whether there are any stocks which have actually satisfied the criteria. Under the “Stocks” tab, we can see there will be 2 bifurcations- ‘Perfect Match’ & ‘Almost there’.

      • ‘Perfect Match’ as the name suggests gives the names of the stocks which have satisfied all the given criteria.
      • ‘Almost There’ would show the companies which have not satisfied one or two criteria. Just beside the names of the stocks, you can find the signs of the parameters which has matched your given criteria. By checking that you can analyze as to which criteria have not been matched.

      For example, Abbott India is under ‘Almost there’ tab. Out of 6 parameters, only 1 parameter does not meet. From the signs given on the right-hand side, you can see that it does not have “Low Leverage” sign on it, which means the company does not meet the criteria of low leverage.

      Just like that, you can also check the companies which are meeting the criteria and the ones which are not.

      Please note that these scans just give out the companies which meet the criteria. It is advisable that we do further research ourselves or ask the experts.

      For that, you can also join StockEdgeclub where we have Technical & Fundamental Analysts resolving your stock queries on a real-time basis along with many more features.

      Conclusion:

      Just by the help of these, you can prepare your own combination scans and filter companies according to your strategy. These help you to save a lot of time as compared to manual screening for 5000 companies. The first step is to start with any idea you want. You can mix and match using your own criteria to find out the companies. Just like that, you can use your own thinking and ideas to screen out companies.

      Hope now you can generate ideas for yourself and create wealth from Investment.

      Tags: combination scansfinancial analysisFundamental analysisFundamental scansMy Combination Scansstock financialsStockEdgeStockedge appStockedge featureStockEdge Scan
      ShareTweetSend
      Subscribe On Telegram Subscribe On Telegram Subscribe On Telegram
      Previous Post

      Identify growth companies for Long term Investment

      Next Post

      CANSLIM strategy with StockEdge Scans for quality Stocks

      StockEdge

      StockEdge

      StockEdge is a self-help Equity and Mutual Fund research tool. It empowers retail investors to identify investment opportunity with all the necessary data and analytics.

      Next Post
      CANSLIM strategy with StockEdge Scans for quality Stocks

      CANSLIM strategy with StockEdge Scans for quality Stocks

      StockEdge version 5.0

      StockEdge version 5.0

      Relative Strength scans

      Relative Strength scans

      Leave a Reply Cancel reply

      Your email address will not be published. Required fields are marked *

      Contact Us
      • Timing (Mon-Sat): 10 am to 7 pm
      • Sales: +919830994463
      • Support: +919830994402
      • Club Support: +916289906895
      • Affiliate: +917003567131
      Recent Posts
      Top 5 Textile stocks
      Top 5 Textile Stocks in India: From Cotton to Cash
      multi-bagger stocks for 2025
      5 Multibagger Stocks to keep an eagle-eye for 2025
      Important Links
      • StockEdge.com
      • StockEdge Premium
      • - Quarterly Membership
      • - Annual Membership
      • StockEdge Analyst
      • StockEdge Club
      • Compare Plans
      An Initiative Of

      © 2023 Kredent InfoEdge Pvt Ltd.

      Facebook-f Twitter Instagram Linkedin-in Youtube Pinterest-p

      Get StockEdge App

      No Result
      View All Result
      • Home
      • Article Categories
        • Fundamental Analysis
        • Technical Analysis
        • Market Themes
        • StockEdge Tutorials
        • StockEdge Version Updates
      • Products
        • StockEdge Premium
        • StockEdge Pro
        • StockEdge Club
        • Compare Plans
      • Visit StockEdge.com

      © 2023 Kredent InfoEdge Pvt Ltd.