StockEdge.com
  • Products
    • StockEdge Premium
    • StockEdge Pro
    • StockEdge Club
    • Compare Plans
StockEdge Blog
  • Trending Stocks
  • Insights
    • All
    • Business Houses
    • Markets themes
    • Stock Insights
    Top 5 Textile stocks

    Top 5 Textile Stocks in India: From Cotton to Cash

    multi-bagger stocks for 2025

    5 Multibagger Stocks to keep an eagle-eye for 2025

    Jindal Saw – Strong Earnings Momentum Ahead

    Jindal Saw – Strong Earnings Momentum Ahead

    Kirloskar Group- A Legacy of 134 Years

    Kirloskar Group- A Legacy of 134 Years

    renewable energy stocks in india

    Top Renewable Energy Stocks in India

    blue chip stocks

    Top 5 Blue Chip Stocks to Buy and Invest in 2023

    Budget 2023: Stocks to keep an eye on

    Budget 2023: Stocks to keep an eye on

    Adani Enterprises FPO: Detailed Analysis, GMP and Review?

    Adani Enterprises FPO: Detailed Analysis, GMP and Review?

    Top 5 Defence Stocks to Invest in India

    Top 5 Defence Stocks to Invest in India

  • Technical Analysis
    Chart Patterns – Holy grail of Stock Market Analysis

    Chart Patterns – Holy grail of Stock Market Analysis

    StockEdge Version Update : 9.0

    StockEdge Version Update : 9.0

    Beat the street with Sector Rotation Strategy

    Beat the street with Sector Rotation Strategy

    StockEdge Version Update 8.2

    StockEdge Version Update 8.2

    Derivative Analytics

    An Insightful Research Tool For Derivative Analytics

    Introducing Put-Call Ratio a Derivative Indicator in the Market

    Introducing Put-Call Ratio a Derivative Indicator in the Market

    A Powerful Technical Indicator Beta & Beta Scans

    A Powerful Technical Indicator Beta & Beta Scans

    Technical Analysis using Edge Charts

    Technical Analysis using Edge Charts

    adaptive relative strength and static relative strength scans

    What is Adaptive Relative Strength & Static Relative Strength Scans?

  • Fundamental Analysis
    • All
    • Cash Flow Ratios
    • Efficiency ratios
    • Growth Ratios
    • Liquidity Ratios
    • Return Ratios
    • Solvency ratios
    • Valuation Ratios
    high dividend paying stocks

    Identifying High Dividend Paying Stocks

    Understanding the Importance of creating Fundamental Scans

    Understanding the Importance of creating Fundamental Scans

    Using My Combination Scan to Identify best in an Industry

    Using My Combination Scan to Identify best in an Industry

    Cost Income ratio

    Cost to Income Ratio(%)

    Cost of Liability

    Cost of Liabilities (%)

    Operating Cost to Assets Ratio (%)

    Operating Cost to Assets Ratio (%)

  • StockEdge Tutorials
    StockEdge Club: An Exclusive Investors Hub & Analytics platform

    StockEdge Club: An Exclusive Investors Hub & Analytics platform

    FII/DII Data: Leading Indicators of Stock Market

    FII/DII Data: Leading Indicators of Stock Market

    Chart Patterns – Holy grail of Stock Market Analysis

    Chart Patterns – Holy grail of Stock Market Analysis

    StockEdge Version Update : 9.0

    StockEdge Version Update : 9.0

    Powerful Investment Themes for Retail Investors

    Powerful Investment Themes for Retail Investors

    Beat the street with Sector Rotation Strategy

    Beat the street with Sector Rotation Strategy

    StockEdge Version Update 8.3

    StockEdge Version Update 8.3

    StockEdge Version Update 8.2

    StockEdge Version Update 8.2

    Using Investor Portfolios Section to track Big Bulls like Rakesh Jhunjhunwala

    Using Investor Portfolios Section to track Big Bulls like Rakesh Jhunjhunwala

  • Mutual Fund
    Top 5 Mutual Funds for 2022 where you can start your SIP

    Top 5 Mutual Funds for 2022 where you can start your SIP

    What are Value Funds and its Advantages?

    What are Value Funds and its Advantages?

    thematic funds

    Thematic Funds : Everything you need to know

    Understanding Sector Funds and their Benefits to our Portfolio

    Understanding Sector Funds and their Benefits to our Portfolio

    Are Dividend Yield Funds a good option to invest in?

    Are Dividend Yield Funds a good option to invest in?

    What are Contra Funds and their advantages?

    What are Contra Funds and their advantages?

    Trending Tags

    No Result
    View All Result
    • Trending Stocks
    • Insights
      • All
      • Business Houses
      • Markets themes
      • Stock Insights
      Top 5 Textile stocks

      Top 5 Textile Stocks in India: From Cotton to Cash

      multi-bagger stocks for 2025

      5 Multibagger Stocks to keep an eagle-eye for 2025

      Jindal Saw – Strong Earnings Momentum Ahead

      Jindal Saw – Strong Earnings Momentum Ahead

      Kirloskar Group- A Legacy of 134 Years

      Kirloskar Group- A Legacy of 134 Years

      renewable energy stocks in india

      Top Renewable Energy Stocks in India

      blue chip stocks

      Top 5 Blue Chip Stocks to Buy and Invest in 2023

      Budget 2023: Stocks to keep an eye on

      Budget 2023: Stocks to keep an eye on

      Adani Enterprises FPO: Detailed Analysis, GMP and Review?

      Adani Enterprises FPO: Detailed Analysis, GMP and Review?

      Top 5 Defence Stocks to Invest in India

      Top 5 Defence Stocks to Invest in India

    • Technical Analysis
      Chart Patterns – Holy grail of Stock Market Analysis

      Chart Patterns – Holy grail of Stock Market Analysis

      StockEdge Version Update : 9.0

      StockEdge Version Update : 9.0

      Beat the street with Sector Rotation Strategy

      Beat the street with Sector Rotation Strategy

      StockEdge Version Update 8.2

      StockEdge Version Update 8.2

      Derivative Analytics

      An Insightful Research Tool For Derivative Analytics

      Introducing Put-Call Ratio a Derivative Indicator in the Market

      Introducing Put-Call Ratio a Derivative Indicator in the Market

      A Powerful Technical Indicator Beta & Beta Scans

      A Powerful Technical Indicator Beta & Beta Scans

      Technical Analysis using Edge Charts

      Technical Analysis using Edge Charts

      adaptive relative strength and static relative strength scans

      What is Adaptive Relative Strength & Static Relative Strength Scans?

    • Fundamental Analysis
      • All
      • Cash Flow Ratios
      • Efficiency ratios
      • Growth Ratios
      • Liquidity Ratios
      • Return Ratios
      • Solvency ratios
      • Valuation Ratios
      high dividend paying stocks

      Identifying High Dividend Paying Stocks

      Understanding the Importance of creating Fundamental Scans

      Understanding the Importance of creating Fundamental Scans

      Using My Combination Scan to Identify best in an Industry

      Using My Combination Scan to Identify best in an Industry

      Cost Income ratio

      Cost to Income Ratio(%)

      Cost of Liability

      Cost of Liabilities (%)

      Operating Cost to Assets Ratio (%)

      Operating Cost to Assets Ratio (%)

    • StockEdge Tutorials
      StockEdge Club: An Exclusive Investors Hub & Analytics platform

      StockEdge Club: An Exclusive Investors Hub & Analytics platform

      FII/DII Data: Leading Indicators of Stock Market

      FII/DII Data: Leading Indicators of Stock Market

      Chart Patterns – Holy grail of Stock Market Analysis

      Chart Patterns – Holy grail of Stock Market Analysis

      StockEdge Version Update : 9.0

      StockEdge Version Update : 9.0

      Powerful Investment Themes for Retail Investors

      Powerful Investment Themes for Retail Investors

      Beat the street with Sector Rotation Strategy

      Beat the street with Sector Rotation Strategy

      StockEdge Version Update 8.3

      StockEdge Version Update 8.3

      StockEdge Version Update 8.2

      StockEdge Version Update 8.2

      Using Investor Portfolios Section to track Big Bulls like Rakesh Jhunjhunwala

      Using Investor Portfolios Section to track Big Bulls like Rakesh Jhunjhunwala

    • Mutual Fund
      Top 5 Mutual Funds for 2022 where you can start your SIP

      Top 5 Mutual Funds for 2022 where you can start your SIP

      What are Value Funds and its Advantages?

      What are Value Funds and its Advantages?

      thematic funds

      Thematic Funds : Everything you need to know

      Understanding Sector Funds and their Benefits to our Portfolio

      Understanding Sector Funds and their Benefits to our Portfolio

      Are Dividend Yield Funds a good option to invest in?

      Are Dividend Yield Funds a good option to invest in?

      What are Contra Funds and their advantages?

      What are Contra Funds and their advantages?

      Trending Tags

      No Result
      View All Result
      StockEdge Blog
      Home Tutorials SE Blogs- Technical Tutorials
      Relative Strength scans

      Relative Strength scans

      StockEdge by StockEdge
      June 20, 2020
      Reading Time: 6 mins read
      35k
      VIEWS
      Share on FacebookShare on TwitterShare On WhatsApp

      Table of Contents

      • What Is Relative Strength(RS)?
      • Using Relative Strength in StockEdge App:
      • Strongly Outperforming Benchmark Index :
          • See also: Average True Range (ATR)
      • Increasing Relative Strength- Benchmark index: 
          • See also: Learn about the Relative Strength Index (RSI)
      • Strongly Under-Performing Sectoral Index:
      • Decreasing Relative Strength- Sectoral Index:
        •  Frequently Asked Questions
          • How do you calculate relative strength?
          • What is a good relative strength number?
          • What is the relative strength of a stock?
          • What is relative strength vs rsi

      Relative strength is a technique used in momentum investing and identifying value stocks. It consists of investing in securities that have performed well, relative to their market or benchmark. Relative strength is a type of momentum investing used by technical analysts and value investors.

      Relative strength helps to predict that the trends currently displayed by the market will continue for long enough that they can realize a positive return.

      What Is Relative Strength(RS)?

      Relative strength is a measure of the price trend of a stock compared to its benchmark index or sectoral index.

      Relative strength Scans show the companies which have outperformed/underperformed Benchmark Index like Nifty or Sensex and Sector Index like Realty, Banking, Auto etc in a period of 55 trading days. A stock’s relative strength trend adds an additional dimension of relative price behaviour to the investment decision.

      Relative strength is one of the most useful indicators in the market, highlighting when stocks are outperforming or underperforming a benchmark index or sector over a period of 55 trading days.

      Relative Strength is calculated by dividing the percentage price change of a stock over a period of 55 trading day by the percentage change of a market index or sector over the same period.

      It can also be used to compare two companies in the same industry or Index. This comparison examines the relative strength performance of two stocks over their benchmark or sector and can help you decide whether you should hold one versus the other.

      Using Relative Strength in StockEdge App:

      Above we have discussed the Relative Strength, now let us discuss how we can use this technical indicator to filter out stocks for trading:

      In StockEdge there are many Relative Strength scans available for filtering out stocks for trading:
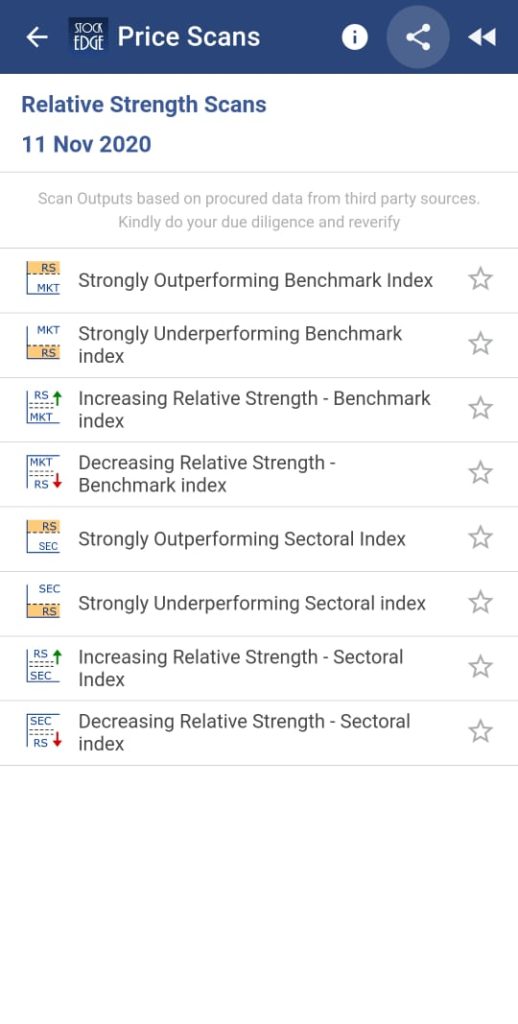
      relative strength

      Let us discuss in details about some of these scans:

      Strongly Outperforming Benchmark Index :

      It is a bullish indicator which shows a list of stocks that are strongly outperforming the Benchmark index i.e increase in stock price is more than the increase in the price of the Benchmark Index. Stocks with Relative strength more than 0.3 are shown here.

      Following is a list of stocks which has fulfilled this criterion on 11th November 2020:
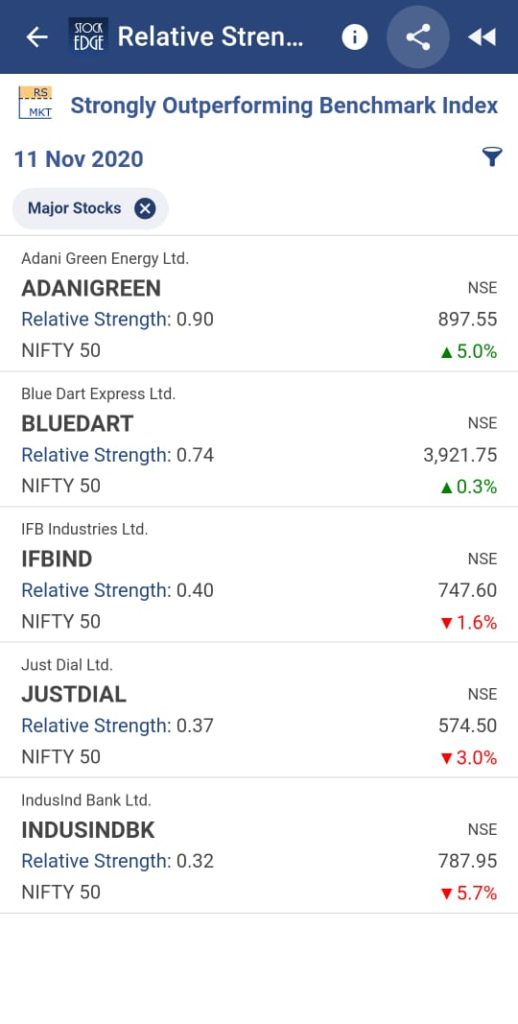
      Similarly, in the scan – ‘Strongly Underperforming Benchmark Index’ , the user get a list of stocks that are strongly underperforming the Benchmark index i.e increase in stock price is less than the increase in the price of the Benchmark Index.

      See also: Average True Range (ATR)

      Increasing Relative Strength- Benchmark index: 

      Stocks whose Relative Strength is increasing for the last three days. This scan will contain a list of stocks whose RS (Benchmark Index) is above 0 and increasing for the last three days (RS1>RS2>RS3>0)

      Following is a list of stocks which has fulfilled this criterion on 11th November 2020:
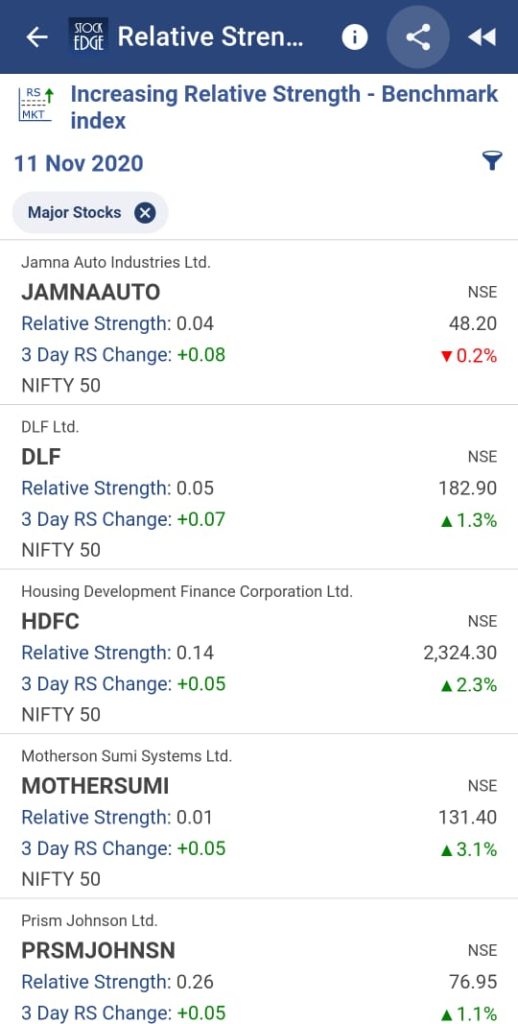
      Similarly in the scan – Decreasing Relative Strength – Benchmark index, the user will get a list of stocks whose Relative Strength is decreasing for the last three days where current day’s RS being below zero and decreasing for the last three days(RS1<RS2<RS3).

      See also: Learn about the Relative Strength Index (RSI)

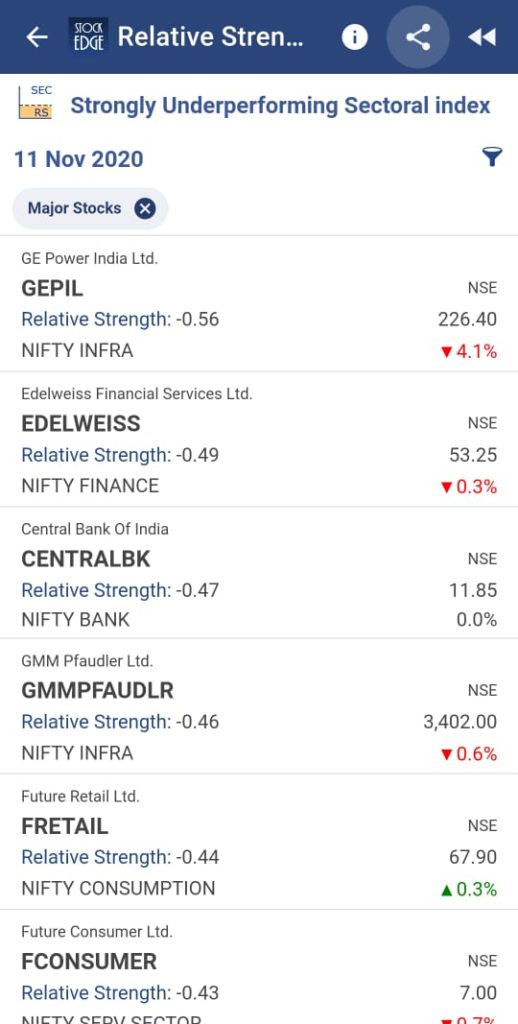
      Strongly Under-Performing Sectoral Index:

      Stocks which are strongly underperforming the Sectoral index i.e stock price has not increased compared to price of Sectoral Index. Stocks with Relative strength less than -0.3 are shown here

      Following is a list of stocks which has fulfilled this criterion on 11th November,2020:
      Decreasing Relative Strength- Sectoral Index:

      Stocks whose Relative Strength is decreasing for the last three days. This scan will contain a list of stocks whose RS (Sectoral Index) is below 0 and decreasing for the last three days (RS1<RS2<RS3<0)

      Following is a list of stocks which has fulfilled this criterion on 11th November 2020:
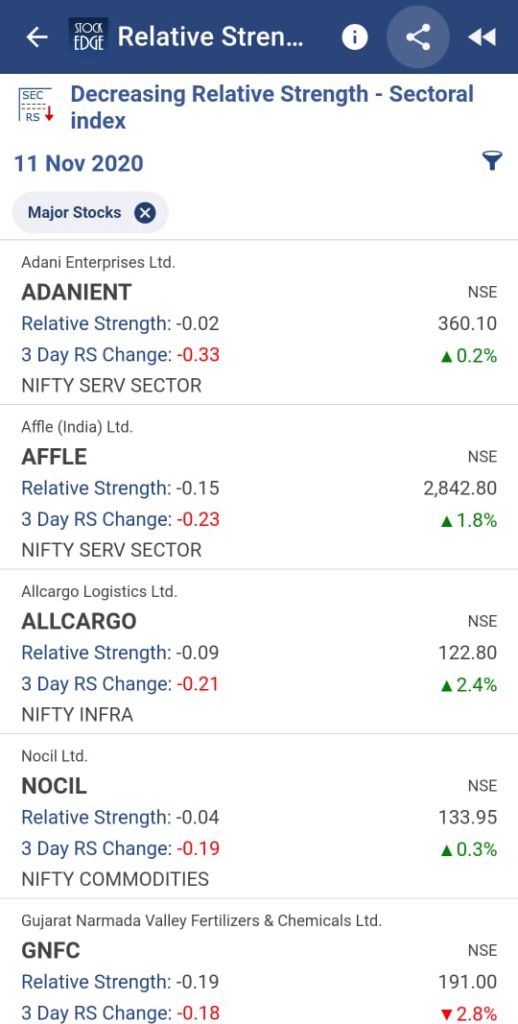
      Above are examples of Relative Strength scans that tell you if the stock is bearish or bullish and also give us a list of the stock which fulfills the criteria of the particular day.

       Frequently Asked Questions

      How do you calculate relative strength?

      It is calculated by dividing the percentage price change of a stock over a period of 55 trading day by the percentage change of a market index or sector over the same period.

      What is a good relative strength number?

      A Relative Strength indicates that the stock outperformed the market, whereas Relative Strength indicates that the stock underperformed the market, and Relative Strength = 1 indicates that the stock performed on par with the market.

      What is the relative strength of a stock?

      It is a measure of the price trend of a stock compared to its benchmark index or sectoral index.

      What is relative strength vs rsi

      The relative strength is a measure of the price trend of a stock compared to its benchmark index or sectoral index whereas Relative Strength Index (RSI) is a momentum oscillator. This indicator oscillates between 0 and 100. RSI is considered to be overbought when it is above 70 and oversold when it below 30.

      You can filter out the stocks and can trade accordingly using these scans.

      Join StockEdge Club to get more such Stock Insights. Click to know more!

      You can check out the desktop version of StockEdge.

      Tags: Relative Strengthtechnical analysisTechnical indicatorsTechnical scans
      ShareTweetSend
      Subscribe On Telegram Subscribe On Telegram Subscribe On Telegram
      Previous Post

      StockEdge version 5.0

      Next Post

      Understanding Business Houses

      StockEdge

      StockEdge

      StockEdge is a self-help Equity and Mutual Fund research tool. It empowers retail investors to identify investment opportunity with all the necessary data and analytics.

      Next Post
      Understanding Business Houses

      Understanding Business Houses

      What is Narrow Range Scans?

      What is Narrow Range Scans?

      Update to the latest version of Stockedge

      Update to the latest version of Stockedge

      Comments 15

      1. BP GAUTAM says:
        3 years ago

        i am day trader plz suggest plan suitable for me. I also invest for long term. I also want to analysis relative strength.

        Reply
        • Ganga says:
          2 years ago

          Please check our premium plans at https://stockedge.com/Plans/compare

          Reply
      2. Warun says:
        3 years ago

        Excellent description. This is very helpful

        Reply
        • Surbhi Lohia says:
          3 years ago

          Thankyou for your feedback. you can premium plans at https://stockedge.com/Plans/compare

          Reply
      3. Sandeep Reddy says:
        3 years ago

        Can you do momentum stock ranking.

        Reply
        • Ganga says:
          2 years ago

          We will try our best to write content on this also soon

          Reply
      4. g srinivasu says:
        3 years ago

        i want elaborate explanation on RELATIVE STRENGTH in selection of stocks.

        please see that the list of stocks in any screener will be imported to excel sheet for our further processing.

        Reply
        • Ganga says:
          2 years ago

          Sure we will update on this soon

          Reply
      5. Hiren Shah says:
        2 years ago

        Good article very useful for learning.

        Reply
      6. Ron says:
        2 years ago

        Hi,
        (1) Can you use this app for both AU & US stocks ?
        (2) Can you do Relative strength scans to Index, Sector or Industry on the free plan or which plan do you have to use for these scans
        (3) What data can get on the free plan,
        (4) What is the limit on requests for the free plan

        Reply
        • Ganga says:
          2 years ago

          Please provide your mail id our team will contact you soon!

          Reply
      7. Bhaskar says:
        2 years ago

        I am a swing trader and had been using Stock Edge and RS screener for some time and it’s showing very good results.

        It would be good if we also have Sectoral RS, I mean, for the sectors mentioned in Stock Edge Eg. Abrasive, Tyre, etc, comparison to Nifty 50. I am sure that would give us further Edge in Stock selection.

        Stock Edge is doing fantastic Job. Keep it up.

        Reply
        • Ganga says:
          2 years ago

          Our team will work on this and thanks for using Stockedge

          Reply
      8. Saikat Nandy says:
        2 years ago

        Hi
        Nicely explained.
        One q
        Why 55?
        What period suitable for teaching more aggressive momentums, say one month period?

        Regards

        Reply
      9. Abdur Rahim says:
        2 years ago

        Very good presentation

        Reply

      Leave a Reply Cancel reply

      Your email address will not be published. Required fields are marked *

      Contact Us
      • Timing (Mon-Sat): 10 am to 7 pm
      • Sales: +919830994463
      • Support: +919830994402
      • Club Support: +916289906895
      • Affiliate: +917003567131
      Recent Posts
      Top 5 Textile stocks
      Top 5 Textile Stocks in India: From Cotton to Cash
      multi-bagger stocks for 2025
      5 Multibagger Stocks to keep an eagle-eye for 2025
      Important Links
      • StockEdge.com
      • StockEdge Premium
      • - Quarterly Membership
      • - Annual Membership
      • StockEdge Analyst
      • StockEdge Club
      • Compare Plans
      An Initiative Of

      © 2023 Kredent InfoEdge Pvt Ltd.

      Facebook-f Twitter Instagram Linkedin-in Youtube Pinterest-p

      Get StockEdge App

      No Result
      View All Result
      • Home
      • Article Categories
        • Fundamental Analysis
        • Technical Analysis
        • Market Themes
        • StockEdge Tutorials
        • StockEdge Version Updates
      • Products
        • StockEdge Premium
        • StockEdge Pro
        • StockEdge Club
        • Compare Plans
      • Visit StockEdge.com

      © 2023 Kredent InfoEdge Pvt Ltd.