Table of Contents
Granules India Limited, a leading company and one of the major players in the Pharma Industry has given a startling return of more than 200% in less than a year from Rs.114 to Rs.406 . As of today’s date, this is Granules India share price.
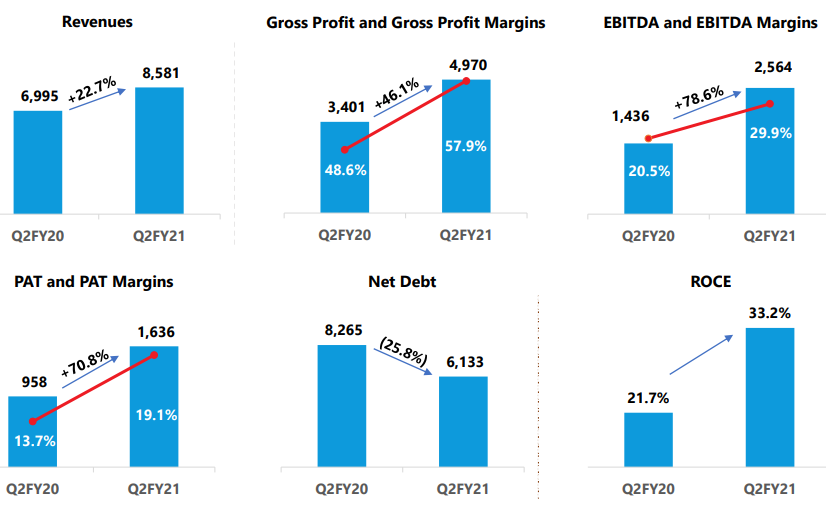
Granules India Ltd., incorporated in the year 1991, is a Mid Cap company (having a market cap of Rs 9186 Crore)
Granules India Limited is one of the vertically integrated growing pharmaceutical manufacturing companies in India today. Based out of Hyderabad, India, the company operates into manufacturing Active Pharmaceutical Ingredients (APIs), Pharmaceutical Formulation Intermediaries (PFIs) and Finished Dosages(FDs).
The Company’s global presence extends to over 250 customers in 60 countries through offices in India, U.S., and U.K. The Company has 6 manufacturing facilities out of which 5 are located in India and 1 in USA and has regulatory approvals from US FDA, EDQM, EU GMP, COFEPRIS, WHO GMP, TGA, K FDA, DEA, MCC and HALAL.
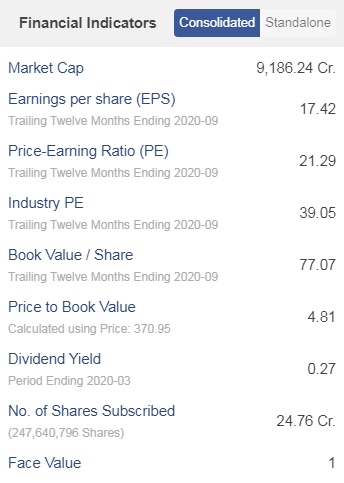
Financial Performance :
- Revenue from operations for Q2 FY21 increased by 22.67% YoY and stood at Rs.858.12 crore and by 16.66% QoQ due to increased penetration in the market.
- Gross margin increased from 48.6% in Q2 FY20 to 57.9% in this quarter due to new launches, increased sales, and product rationalization in the Pharmaceutical formulation intermediates (PFI), and Finished dosages (FD) segments.
- EBITDA margin was higher than the previous year by 935 bps at 29.9%.
- Net profit showed a growth of 70.82% YoY and was recorded at Rs.163.63 crore in Q2 FY21.
- Return on capital employed (ROCE) witnessed a YoY growth to 33.2% on account of higher capital utilization.
- Gross debt decreased from Rs.870 crore in Q1 FY21 to Rs.861 crore in Q2 FY21. Long-term debt amounted to Rs.480 crore and short-term debt made up Rs.381 crore of the total gross debt amount during the quarter.
- The free cash flow generated from the business amounted to Rs.52.2 crore in Q2 FY21 which had increased from Rs.37 crore in the previous quarter. The company also reported the final and first interim dividend worth Rs.12 crore during the quarter.
- Capex for Q2 FY21 stood at Rs.60 crore. The total CAPEX for H1 FY21 was recorded at Rs.105 crore. Capex for the upcoming years is estimated to be Rs.400 crore with Rs.80 crore to be spent on Active pharmaceutical ingredient (API) and the balance to be invested in the capacities for Multi-unit pellet system (MUPS) and Finished dosage (FD).
See also: Bharti Airtel Limited- Connecting homes-Touching millions of lives

Operational Performance:
- The management reported the highest numbers on all financial parameters in the company’s growth history.
- Short term debt increased by Rs.33 crore for the quarter to fund the increase in working capital requirements. Moreover, the company had also spent Rs.22 crore on research and development in Q2 FY21, all of which had been written off during the quarter.
- The cash to cash cycle for the company improved during Q2 FY21 due to an increase in receivables and the management aimed to contact its customers and vendors to further improve its working capital cycle.
- The cash flow generated from operating activities for the quarter amounted to Rs.281 crore. Out of this amount, Rs.107 crore was spent to meet the increase in working capital needs and Rs.62 crore were paid out as taxes. The operational cash for the company stood at Rs.112 crore.
Future Outlook:
- The company is focusing on gaining the anticipated approvals of filed ANDAs to dominate market share and possess the ability to scale up production.
- The company aims to have successfully launched two MUPS based products approved from the Hyderabad plant and expects to utilise significant capacity of the new plant from Day 1.
- The management reported that around 12-13 products were pending approvals and about 6-7 out of the approved products were pending launch.
- The management expects a CAGR of 20% on the net profit in the upcoming years and aims to maximise shareholder value and achieve operational efficiency.
How do we analyze the stock using StockEdge?
- You can open the StockEdge application and type the name of the stock in the search option and click on the stock.
- After clicking on the stock name, it shows the stocks price graph which is set to default view of 1 day, so to see the price movement on a longer time frame you can click on 5 years to see the trend.
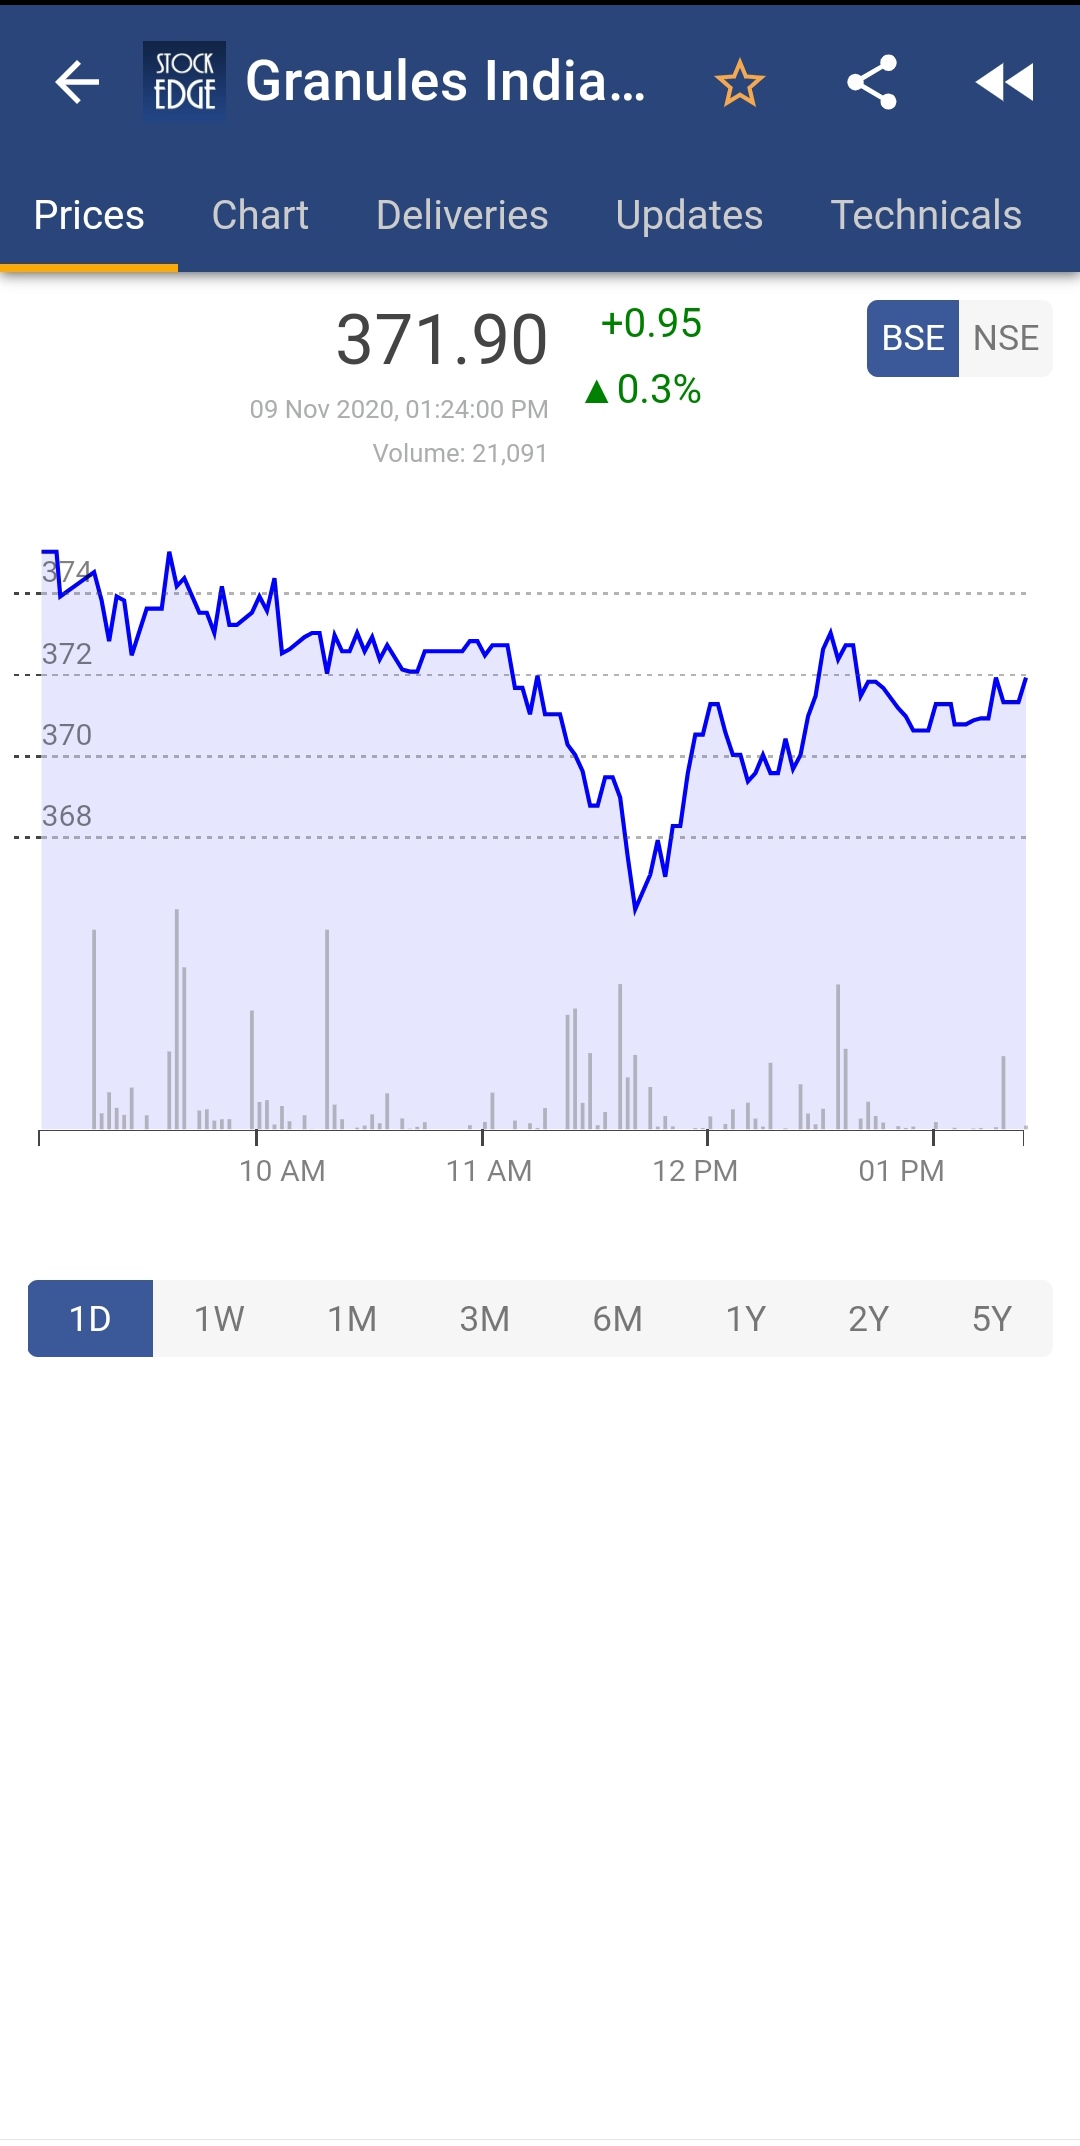
- You can toggle around the different tabs to get more information about the stock such as the Updates -> Corp. Actions, whether there has been any split, bonus issue, the dividend paid, etc.
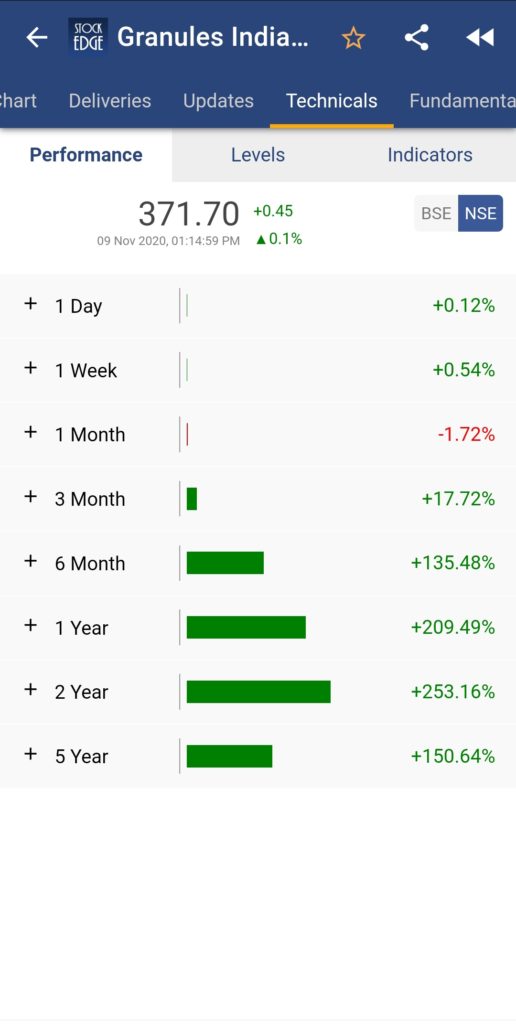
- You can also check the absolute return for the stock in different time frames by clicking on the Technicals tab. As we can see that the price of Granules India has shown a growth of 135% and 209% in the last 6 months and 1 Year respectively depicting the future growth trends and strong fundamentals of the company.
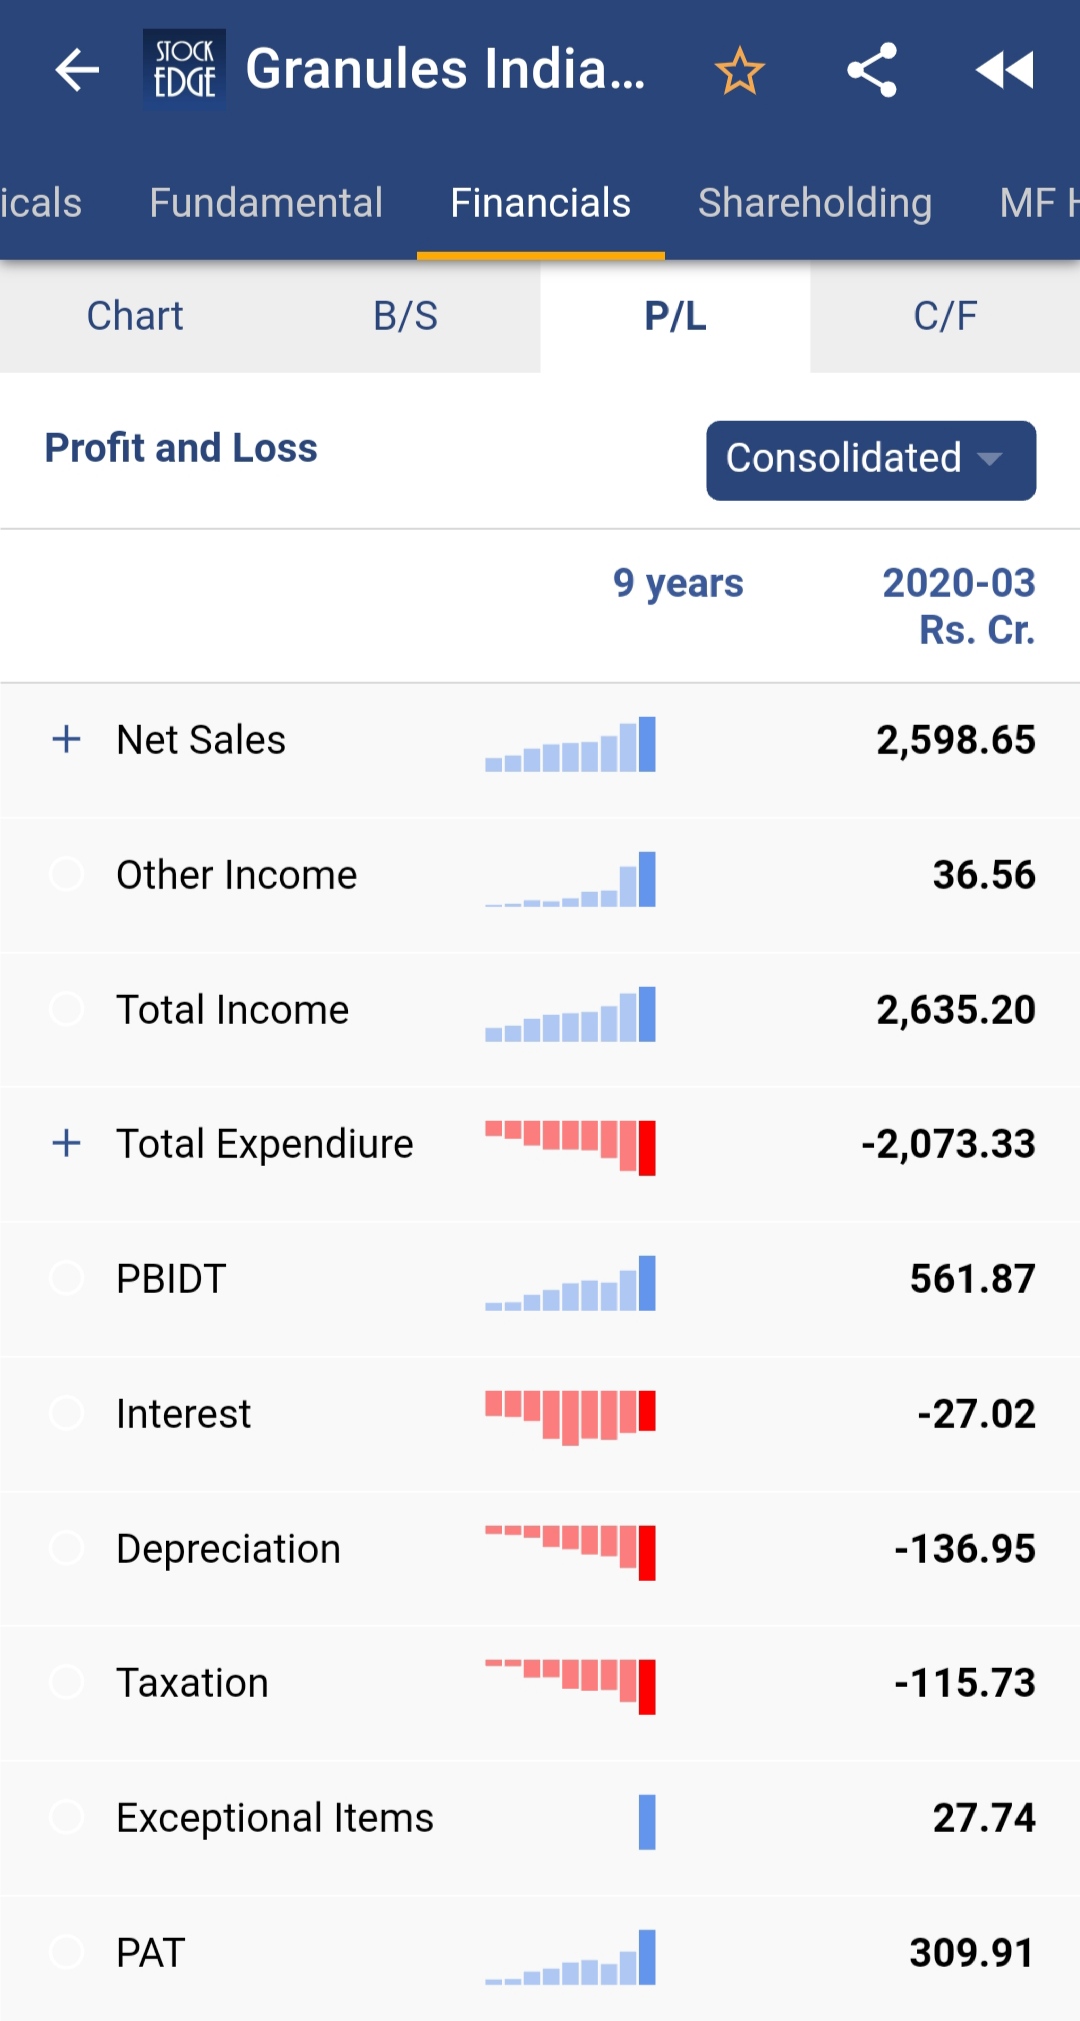
- Next, we click on the Fundamental tab. to check the financial ratios and get a quick analysis of the numbers which also depicts the trend over the period of 9 years. There is a drop-down that you can click to see different sets of ratios such as solvency, valuation, growth, etc. Or we can also check out the past financial performance of the company and compare it for the last 9 years.As we can see that the PAT for Granules India is consistently for the last 9 years with a relatively greater increase in the last year showcasing the future growth prospects of the company.
- We ran a fundamental scan to the company from our application StockEdge and we found the company to satisfy many positive scans which indicate it is in good hands.
StockEdge Technical Views:
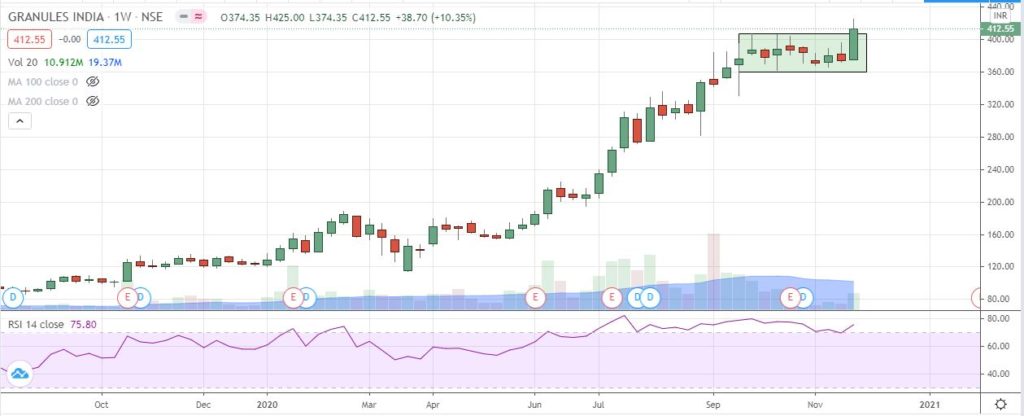
Granules India witnessed breakout from rectangle pattern in the weekly chart and consolidating
right above the pattern. Likely to stay positive in near term till the stock holds 400-405 zone on a
closing basis. Technical parameters look quite strong and suggest next leg of rally in the stock.
Bottomline:
- Granules India has just completed its major capex plan for the expansion of its API manufacturing capacities for Paracetamol, Metformin and Guaifenesin over the past 3 years. This API business contributed 30% of the revenue as on Q3FY20.
- The company would not be taking up any debt and would also repay the debt over the next few years by Rs 100 crs each year.
- As on Q2 FY21, the company had a debt of Rs 613 Crs. The company has also started generating positive FCF (~Rs 264 crs till FY20) on the back of improvement in the capacity utilization. Positive FCF would enable the company to comfortably pay off the debt from internal accruals.
Join StockEdge Club to get more such Stock Insights. Click to know more!
You can check out the desktop version of StockEdge.
Disclaimer
This blog and the process of identifying the potential of a company has been produced for only learning purposes. Since equity involves individual judgments, this analysis should be used for only learning enhancements. Please do not consider it to be a recommendation on any stock or sector. Our knowledge team has limited understanding and we all are learning the art and science behind this.






Very good
thank you
Sir.. Am also stockedge member.. Sir pfizer ke bare me bhi thora dijiye details.
We will write a detailed blog on the pfizer in coming days
Excellent
thank you😊