Table of Contents
Currently, the Indian stock market is in a strong Bull Run! The benchmark index, Nifty 50, gained nearly 10-12% since last year and recently crossed the 20,000 mark for the first time. Do not worry if you missed the rally because it is just the beginning of a much larger one. India’s economy increased by 7.8% in the April-June quarter of 2023, which is exceptionally well compared to other large economies of the world. The Indian stock market is depicting India’s growth story at its best. So, how can you participate in this rally?
In today’s blog, we will discuss the top 7 features of StockEdge. No, we will not discuss how you can become a crorepati doing intraday trading or trading in Hero-Zero options. As the blog title suggests, this is for those of you who are into swing trading or momentum investing and are willing to accumulate wealth over the long term. Not all of us have the time and energy to participate full-time as a trader or investor in the market.
No worries, if you are into business or a 9 to 5 job, you can still make money from the stock market. We at StockEdge believe in empowering retail investors. So, without any further ado, let’s discuss the top 7 innovations by StockEdge which will help you create an edge in the stock market.
1. Trending Stocks
This particular section in StockEdge shows the top stocks for the day. Every stock does not move each day, irrespective of whether the overall market is bullish or bearish. You can always find some stocks which are trending in the market, even making all time highs/lows against the ongoing market trend. So, where can you find these trending stocks? Open up StockEdge and under the Explore section you will find Trending Stocks
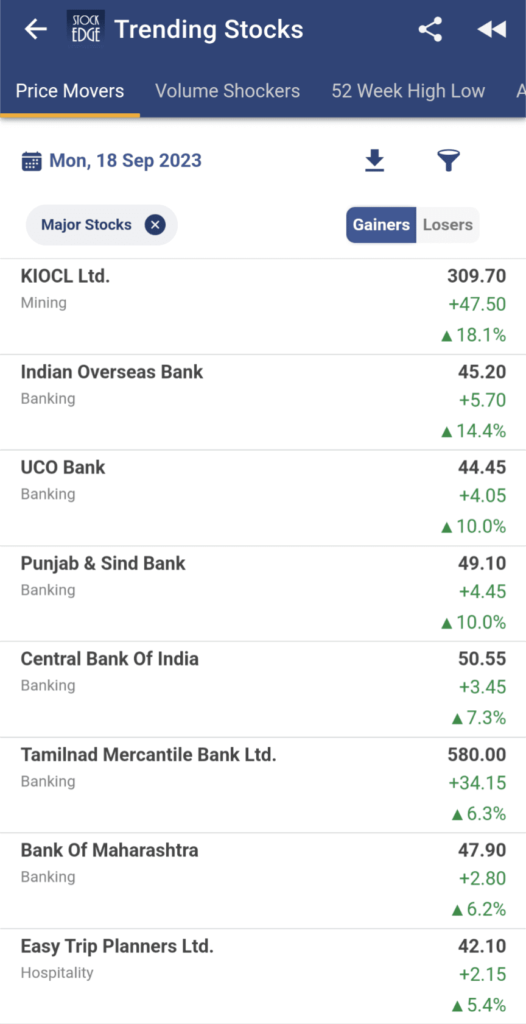
The section is categorized into five sub-sections:
- Price movers– You can identify the top gainers and losers during the live market. The list shows the stocks that are up by at least +2% or down by at least -2% from the previous day’s closing price.
- Volume Shockers– The list shows stocks that have high traded volume (greater than 5 days’ average volume), signifying high interest by market participants in the live market.
- 52-week high-low– As the name suggests, the list of 52-week high stocks or those making fresh 52-week lows can help identify potential buying or selling opportunities in the live market
- All-time high low– Stock trading at its all-time high is usually a sign of bullishness, and trading at its all-time low signifies bearishness. Getting this data in the live market gives you the edge to create an early entry to make a position as a swing trader.
- Most visited Stocks– This shows the top ten stocks for the day that are popular among StockEdge users.
Combining all these data points and further analyzing the stocks based on price charts can give a lot of opportunities for Swing traders as well as intraday traders.
If you are an intraday trader, you can also read this blog, where you can find a complete guide to identifying stocks for intraday trading using the “Trending Stocks” feature in StockEdge.
2. Stock Level Technical Analysis
This is one of the top-rated features of StockEdge. Now, you can analyze technical charts of any stock without even opening up the price chart. Want to check the technical parameters of a stock? Get a quick glance at the technical levels, only with StockEdge.
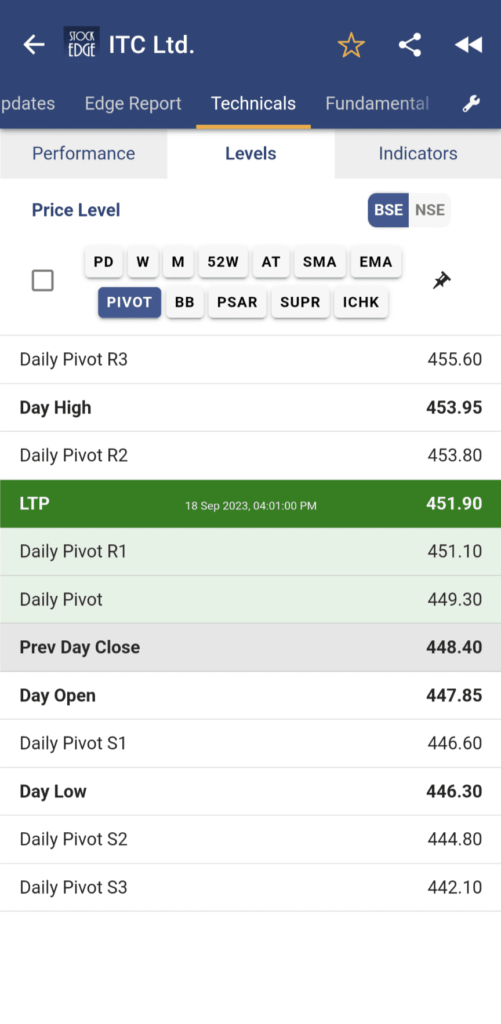
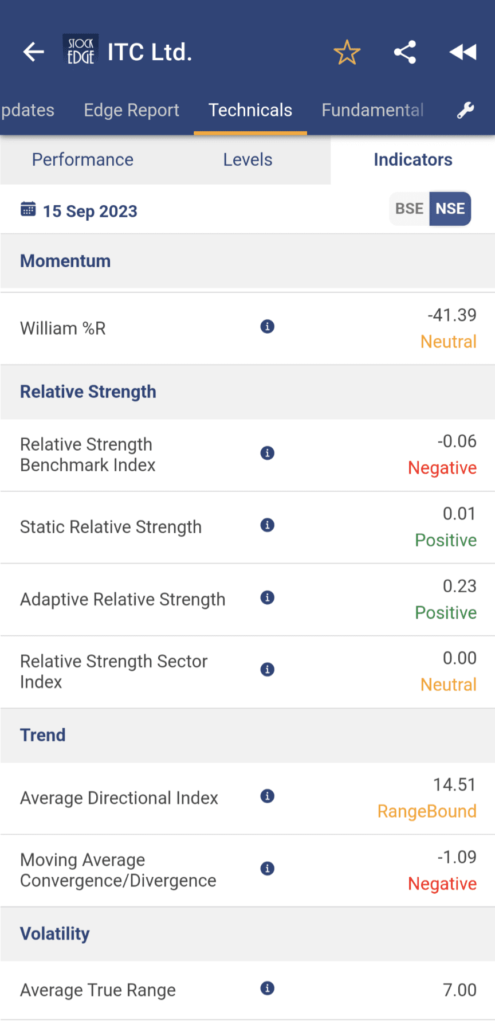
Just search for your favorite stock for which you want to view the technical levels. Then go to the Technical tab, under which you can see the sub-categories, which are:
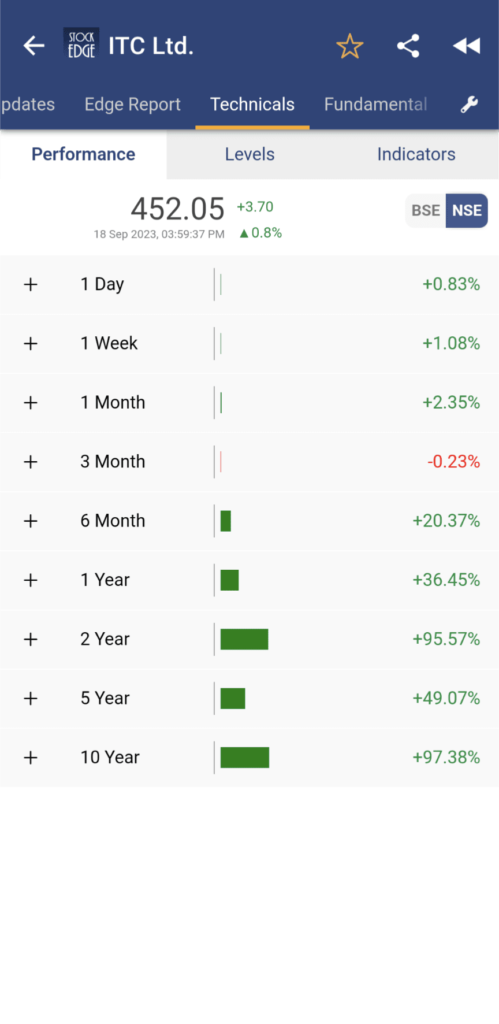
a. Performance– This section here at StockEdge shows the absolute percentage change in stock price for 1 day, 1 week, 1 month, 3 months, 6 months, 1 year, 2 years, 5 years and 10 years. This historical performance of a stock, at a glance in multiple time periods can give you confidence before investing, which will help you to make informed decisions.
b. Levels– This section shows the price levels of a stock based on different technical parameters, such as support and resistance levels based on Pivot Points; both SMA and EMA levels can also be determined. You can even get values of Bollinger Bands, Parabolic SAR, Supertend, Ichimokue and much more.
c. Indicators– From this section, you can quickly analyze at a glance whether the stock is bullish or bearish based on its momentum, relative strength, trend and volatility. All these without even opening the price charts! Isn’t it amazing?
3. Scans by StockEdge
Identifying stocks for trading or investing can be daunting, with more than 6000+ listed stocks in the market. Scanning the market based on your choice of parameters can help you easily find your choice of stocks with ease. StockEdge has almost pioneered in this area with multiple categories of Scans based on Price, volume, technical, fundamental, futures and options, candlesticks and more. We have over 300+ library of scans.
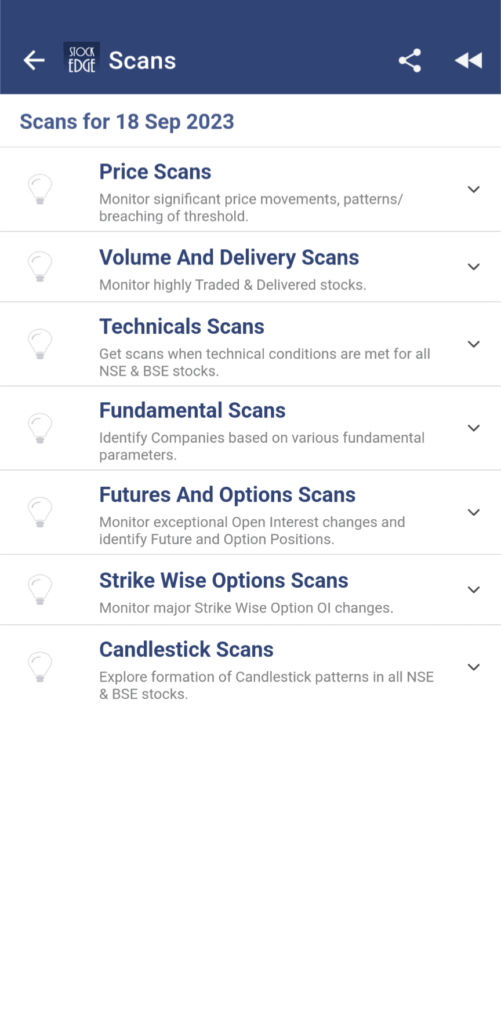
Not just that, we have stretched even beyond this, where you can set your own criteria, from combining multiple scans to creating your own personalized Combination Scan. Go to My StockEdge, where you can find My Combo Scan. Click on + to Add a new combination Scan. Give it a name and start adding scans as per your choice.
4. Strategies
Having a predefined strategy that has historically been proven to generate healthy returns is always better. So, in StockEdge, we have a section for ready-made strategy created by combining multiple scans by our team of analysts. These predefined strategies can help you identify the right stock at the right time. If you want to take a bullish or a bearish trade, be it swing, positional or intraday, we have a predefined strategy for each type.
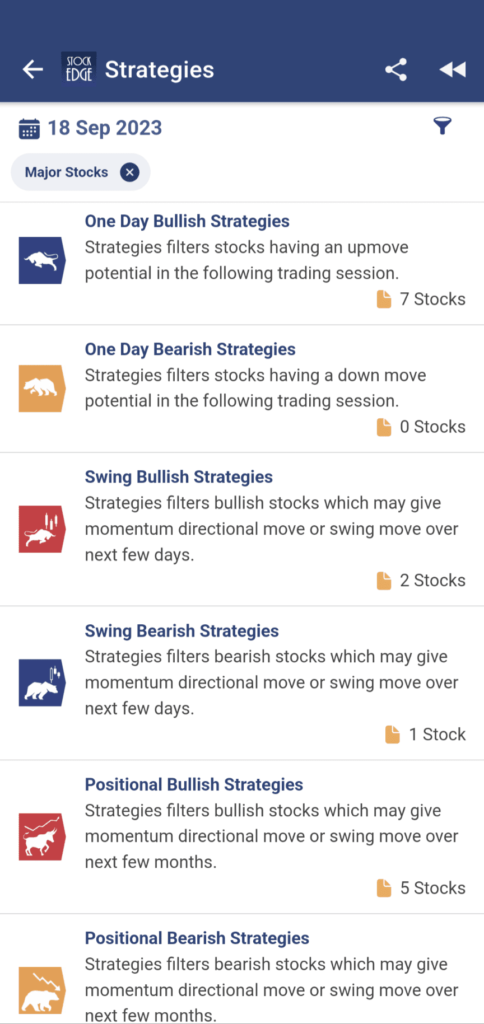
We have 6 different categories under which you can get multiple trading strategies for different time frames. You can find this feature of StockEdge under Premium Analytics. Click on Strategies to explore!
5. Sector Rotation
The stock market moves in a cycle. You will be fascinated to know that irrespective of whether the broader market is bullish or bearish, you will find a few sectors which are out performing, and that is where you can identify strong stocks for swing trading or momentum investing!
StockEdge has created a beautiful tool called “Sector Rotation”, through which you can identify strong sectors in the market and the sectors that may outperform in the market in times to come. All these with the help of relative strength, RSI (relative strength index) and multiple-period Simple moving averages (SMA).
To know how you can identify the next upcoming sector that can outperform the market, please read our blog: Beat the street with Sector Rotation Strategy. Make sure you read the entire blog as it is a complete guide on how to identify strong sectors and it also helps you to find out which are the strong stocks in that sector by doing a Peer-to-Peer analysis. All this can be easily done from the StockEdge app itself.
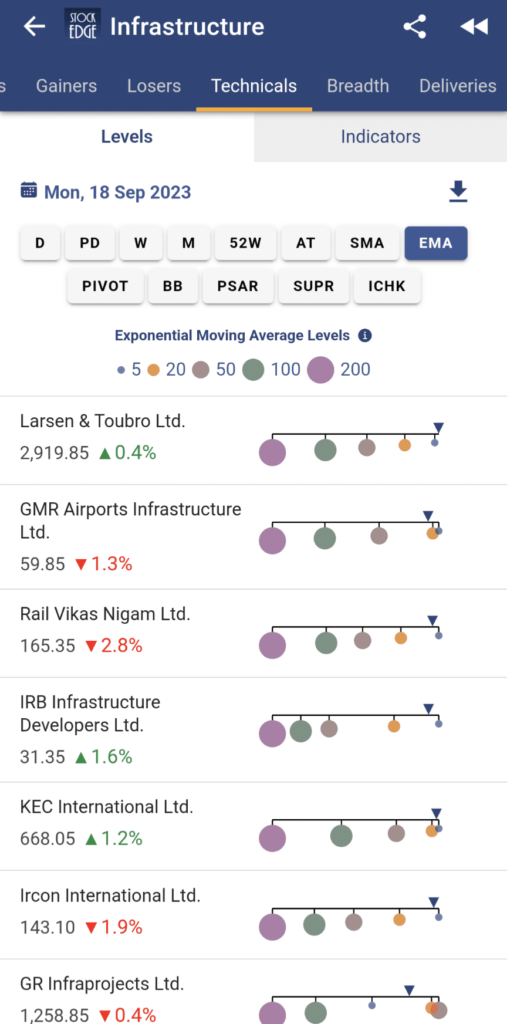
You can not only compare the stocks fundamentally but also compare them based on different technical parameters (as shown in the image below)
6. Market Breadth
This is yet another feature of StockEdge that can help you gauge the overall market sentiments, whether it is currently overbought or oversold. It shows the percentage or the number of stocks in a particular market index which are currently exhibiting strength based on 55-period relative strength and multi-period simple moving averages (SMAs). We have implemented market breadth to all major market indices to give you an overview of market as well specific sectors as well.
So, if the number of stocks or percentage is high, it is shaded in green, in yellow if it is neutral and in shades of red for a low count. More green shades indicate an uptrend, yellow shades indicate a neutral outlook and red shades indicate a downtrend. (refer to the image below)
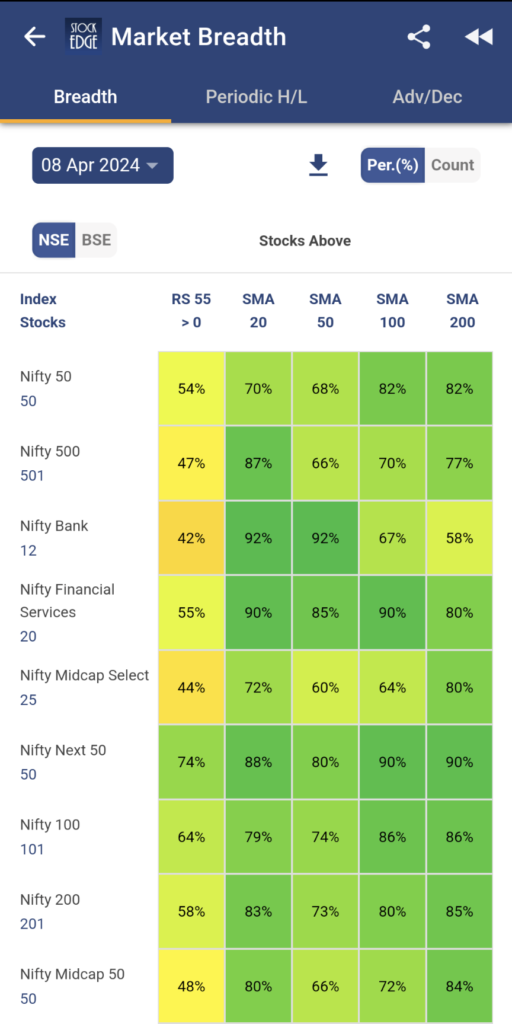
In the above image you can clearly see that the majority of market indices are neutral whereas only Nifty Next 50 where 74% of the stocks are trading RS positive is depicting strength in the current market. Other than this if you wish to see the historical data of any particular market index, click on that particular index to view its historical market breadth.
This gives you a bird’s eye view of the current sentiment of various market indices and also gives you an overall idea of the price trends in the market.
7. Derivatives Analytics
Last but not the least, this feature here at StockEdge is for those market participants who trade futures and options. Swing trading or positional trades are not limited to just stocks in the cash market. You can also trade in futures and create option strategies in indices like Nifty 50, Bank Nifty, etc. as well as stocks. But do remember that derivatives trading can be highly fruitful and risky because of leverage. Derivatives trading is a double-edged sword. But with proper knowledge, guidance and the right tool, you can also trade in futures and options and make profitable trades.
This section of Derivatives Analytics shows the trend of Open interest in F&O stocks. Based on an increase or decrease in cumulative OI data combined with price, volume, and delivery, it gives an idea of whether New Longs, New Shorts, or Long covering or short covering are taking place in the futures segment of the stocks. (as given in the image below)
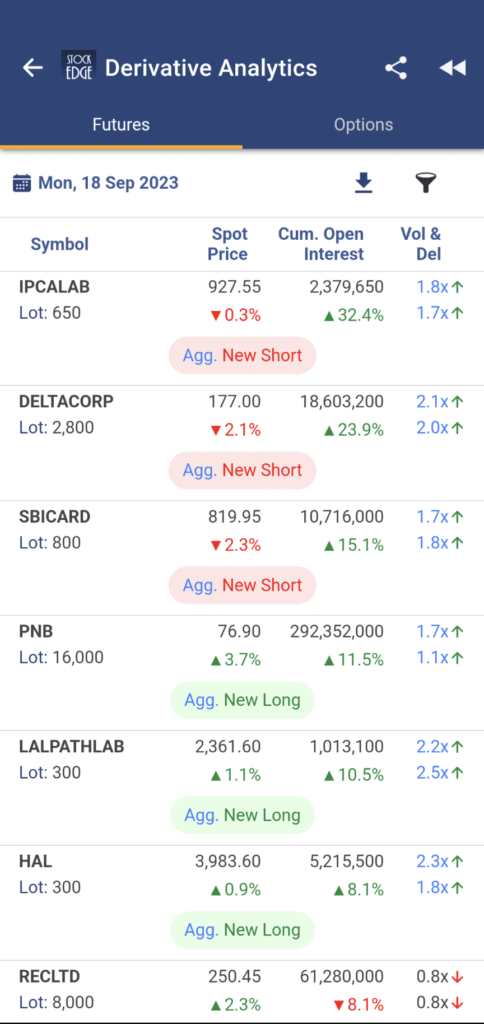
Besides this, you can also analyze options data to find out the PCR of the stocks and its change on a daily basis, which gives you an idea of whether the stock trend is bullish or bearish. Hence, you can make the right decisions while trading futures and options.
To understand how you can identify stocks for futures and options trading, we have a complete guide to learn how to analyze various derivatives data and identify profitable trades.
Read the blog Derivative Analytics: Unlock the Power of Derivatives to analyze Stocks!
Please note all these features can be used both in the StockEdge app and the StockEdge web.
The Bottom Line
We at StockEdge always empower retail traders and investors to make informed decisions in the market. Hope these seven features have provided valuable insights and offer a robust analytical tool for swing traders to make informed decisions in the dynamic world of stock trading. By harnessing the power of StockEdge, you can get a competitive edge and increase the chances of success in the markets. So, whether you are a swing trader or momentum investor, StockEdge is a valuable companion on your journey to financial success.
Happy trading and Investing with StockEdge!


