Table of Contents
“Derivatives are financial weapons of mass destruction” – Warren Buffett.
As the Oracle of Omaha quotes, the above statement on the derivatives market holds true for every investor or part-time trader who trades in stocks occasionally. However, if you are an active trader, analyzing the derivatives markets and its various data points, it can be extremely useful for identifying stock trends.
In this blog, we will learn to analyze derivatives data with the help of a potent research tool “Derivatives Analytics” in StockEdge. But before we jump into it, If you are a newbie in the derivatives market, first, let’s get the basics right! Shall we?
What is a Derivative?
The simple meaning of derivatives in the stock market is that it is a financial instrument, the value of which is derived from the underlying asset, such as stocks or market indices. It allows traders or investors to hedge against any price fluctuations, speculate on future price movements, and take leveraged positions without owning the actual asset.
Types of Derivatives
There are majorly four different types of derivatives:
- Forwards
- Futures
- Options
- Swaps
However, out of these four the most popular ones are Futures trading and Options trading in India.
Futures and options are derivative instruments that are actively traded on the stock exchanges like NSE and BSE. However, there are other types of market for derivatives. Other than stocks or market indices, futures and options also can be on commodities, currencies and interest rates as well.
Let us understand, what are futures?
Futures: Stock or index futures are financial contracts between buyer and seller that allows you to buy or sell a particular stock (in the case of stock futures) or a stock market index (in the case of index futures) at a predetermined price on a specified future date.
What are Options?
Options: Stock or index options are also derivatives instruments that provide investors with a choice to buy or sell the asset. Hence are known as options. By options, many are aware of two definite terms. – Call Option & Put Option.
Let us briefly understand about them.
A call or put option buyer has the right to buy or sell a stock (in case of stock options) or index (in case of index options) at a predetermined price on a particular date. On the other hand, a seller of a call or a Put option is obliged to buy/sell a stock or index at a predetermined price on a particular date, respectively.
To know more about options, you can watch our series of tutorial videos for Learn2Trade – Options
Futures and options are heavily traded on the Indian stock market. In fact, the National Stock Exchange (NSE) is the largest derivatives exchange in the world. The derivatives market in India has witnessed strong growth over the past few years. Infact, in the last 10 years, the daily average turnover for equity derivatives segment has increased by 4.2 times from Rs 33,305 crore in 2011 to Rs 1,41,267 crore in 2021.
As more and more market participants are entering the derivatives market, it becomes essential to learn to analyze some key derivatives data to have an edge in the stock market. The Derivatives Analytics feature in StockEdge is a good way for you to analyze derivatives data to predict the futures price movements and trends of a stock. Let’s have a look at how you can access this feature in StockEdge. You will find ”F&O Zone” under the Analytics section (as shown in the image below)
F&O Zone
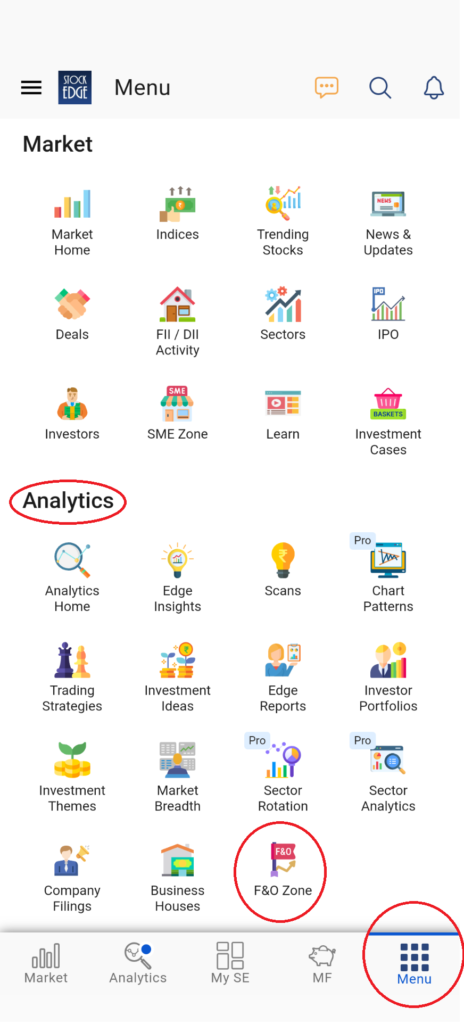
After you click on the icon of “F&O Zone”, you will see this section is further divided into two separate sections for Futures and Options (as you see in the image below)
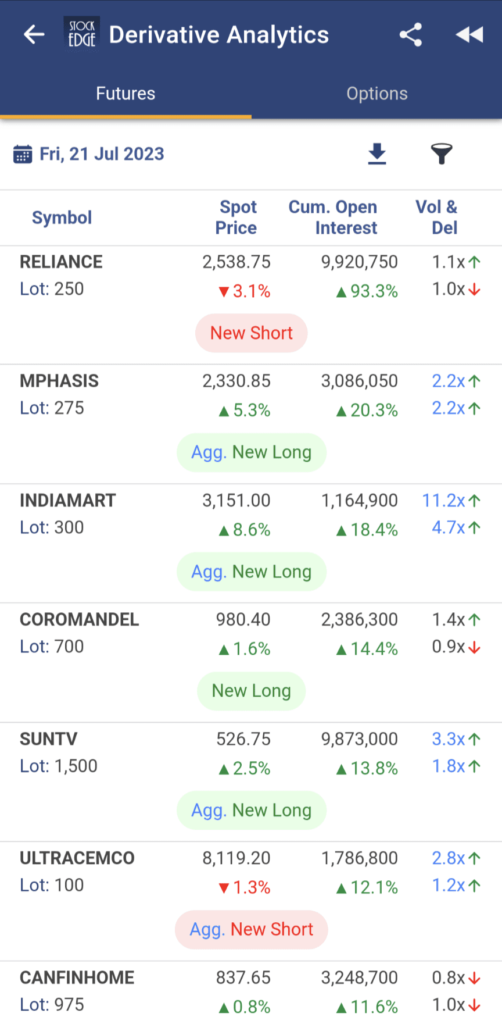
However before we delve deeper into the section, there are two important market terminologies which you must have a clear understanding for analyzing the futures and options:
- Open Interest (OI)
- PCR
What is Open interest?
Open interest in futures and options is the total number of outstanding contracts that have not been settled or closed on a particular trading day.
For futures, it represents the number of contracts held by traders who still need to offset their positions by selling or buying an equal number of contracts. You can analyze the future OI of any stock under the f&o segment with the help of StockEdge. Let’s find out with the example of Reliance Industries Ltd.
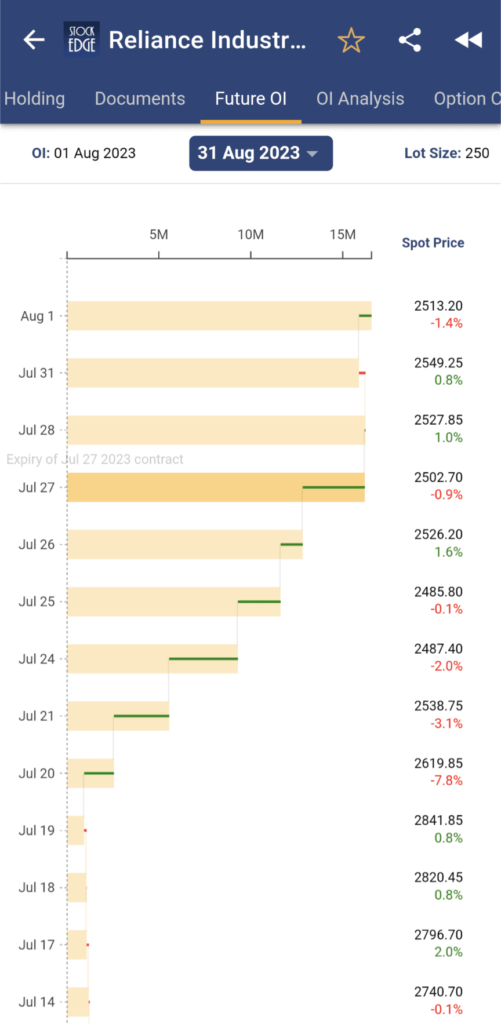
In the above image you can see how futures open interest of Reliance Industries Ltd for the August expiry and how it has changed over time. The yellow bar shows the total futures open interest at a particular date and the change is represented by a green line or red line which indicates addition or reduction of OI respectively.
For options, it represents the total number of contracts that have been bought or sold but have yet to be exercised or expired. However, it is to note that the majority of open option contracts are from a seller’s perspective and strikes which have the highest Call OI are considered Call writers, which indicates a resistance level, whereas the highest Put OI is considered Put writers, which indicates support level. Let’s understand how you can identify support and resistance of a stock based on option chain analysis using StockEdge.
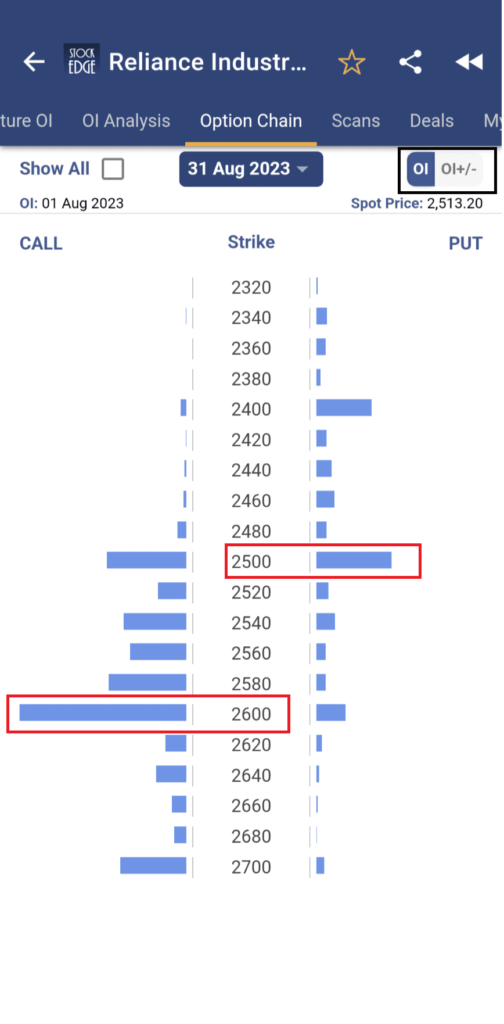
Going forward with the same example of Reliance Industries Ltd. The above image is the option chain which shows the Call OI and Put OI of major strikes of a stock for a particular expiry. You can see that the strike of 2600 Call has the highest open interest indicating resistance, whereas the highest Put is at 2500 strike which indicates a support. Currently as Reliance Industries Ltd is trading at 2513, shows that it is right now near its support levels. You can also see the +/- change in open interest, just change the OI tab to OI+/- as highlighted in the above image.
Analyzing this open interest data can provide insights into market liquidity and the level of trader’s interest in a particular futures or options contract.
Other than this, there is PCR which you can analyze of stock to gain insights about the current trend of a stock.
What is PCR?
Put Call Ratio, commonly known as PCR, compares the total outstanding number of Puts vis-a-vis the Calls.
It is calculated by dividing the total number of outstanding put options by the total number of outstanding call options.
A simple analysis of PCR suggests that if PCR > 1 indicates that Put writers are greater than call writers, which means a bullish view. In contrast, PCR < 1 shows Put writers are lesser than call writers, which indicates a bearish outlook in the index or stocks.
Also, an increase in PCR over time indicates a bullish trend and vice versa if PCR decreases. But if PCR is exceptionally high, generally > 1.5 or more and extremely low, generally < 0.40 can be considered as an overbought and oversold level for the market or the stock, and a reversal in the trend may occur.
You can easily track the PCR of a stock through StockEdge from the Option Chain section.
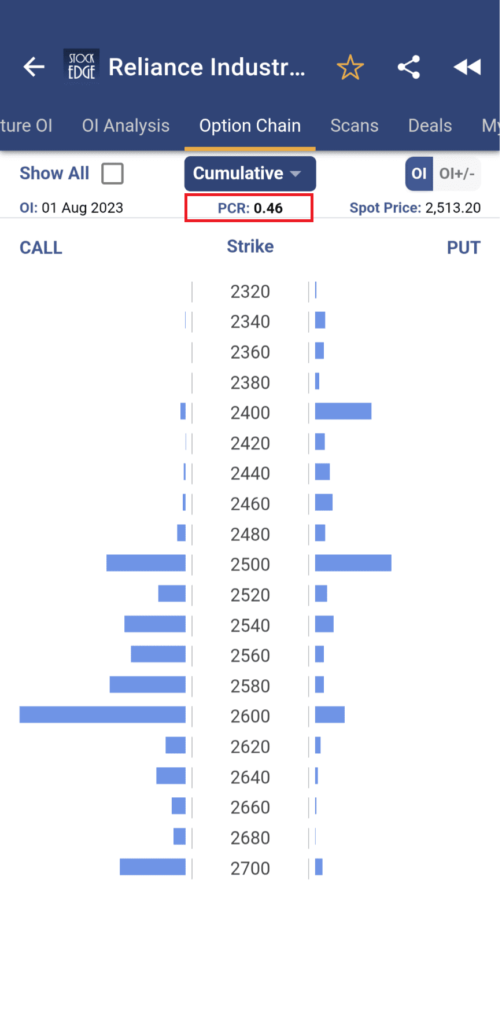
In the above image you can see that Reliance Industries Ltd has a PCR of 0.46, which means Put writers are lesser than call writers as PCR<1 is a sign of bearish outlook as discussed earlier. If you wish you to understand the fundamentals of Reliance Industries and the overall business of Reliance group, can read this blog; Mukesh Ambani Reliance Group: Traditional businesses to Modern age business
Coming back to the “Derivatives Analytics” section in StockEdge which is divided into Future Analytics and Option Analytics. First let’s understand Future Analytics section-
Futures Analytics
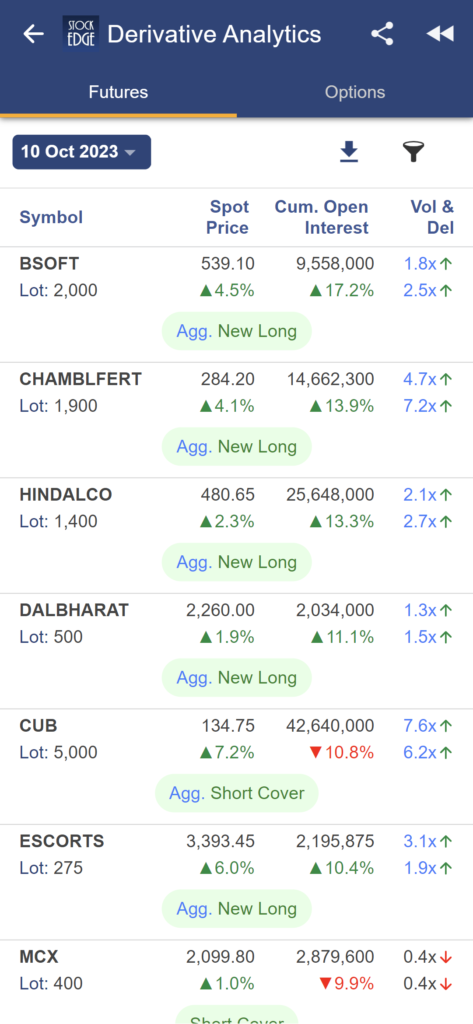
Under the Futures, you will find the list of all the available stocks in f&o in the derivatives market, along with the other information listed below:
- The first column shows the stock’s symbol and its respective lot size.
- Spot Price: Here, it shows the last trading day’s close price of the stock and the % change in price since the previous trading day.
- Volume and Delivery: This section shows if the stock has witnessed a significant increase or decrease in Delivery and Volume from its 5 day average. For instance, a price rise accompanied by high volume and delivery indicates aggressive buying in the stock and vice versa.
- Cumulative Future Open Interest: Cumulative Open Interest for futures refers to the summation of open interest for the current month, next month and far month expiries at the end of the day. It is the outstanding futures contracts that have not been closed or settled for all expiries. Monitoring the cumulative open interest and its changes allows traders to track the trends in open interest. This information helps them understand the sentiment and potential price movements.
So, based on the change in the spot price, cumulative open interest, volume, and delivery, we have classified the OI trend of a stock. They are as follows:
Analyzing OI Trend
- Aggressive New Long: A rise in stock price accompanied by a rise in cumulative interest and a significant increase in volume and delivery from its 5 day average is considered a strong bullish signal.
- New Long: An increase in cumulative open interest and price of the underlying stock but ignoring volume and delivery of a stock is considered bullish.
- Aggressive New Short: A fall in stock price accompanied by a rise in cumulative interest and a significant increase in volume and delivery from its 5 day average is considered a strong bearish signal.
- New Short: An increase in cumulative open interest and decrease in the price of the underlying stock but ignoring volume and delivery of a stock is considered bearish.
- Aggressive Long Cover: The cumulative open interest and price of the underlying stock have decreased, whereas the volume and delivered quantity has significantly increased from its 5 day average. It signifies traders who were holding a long position in the stock have decided to close their position aggressively.
- Long Cover: A decrease in cumulative open interest and price of the underlying stock but ignoring volume and delivery of stock. It signifies people who were holding a long position on the stock have decided to close their position.
- Aggressive Short Cover: The cumulative open interest has decreased, whereas price has increased, as well as volume and delivered quantity has significantly increased from its 5 day average. It signifies traders who were holding a short position on the stock have decided to close their position aggressively.
- Short Cover: A decrease in cumulative open interest and an increase in the price of the underlying stock but ignoring volume and delivery of stock. It signifies traders who were holding a short position on the stock have decided to close their position.
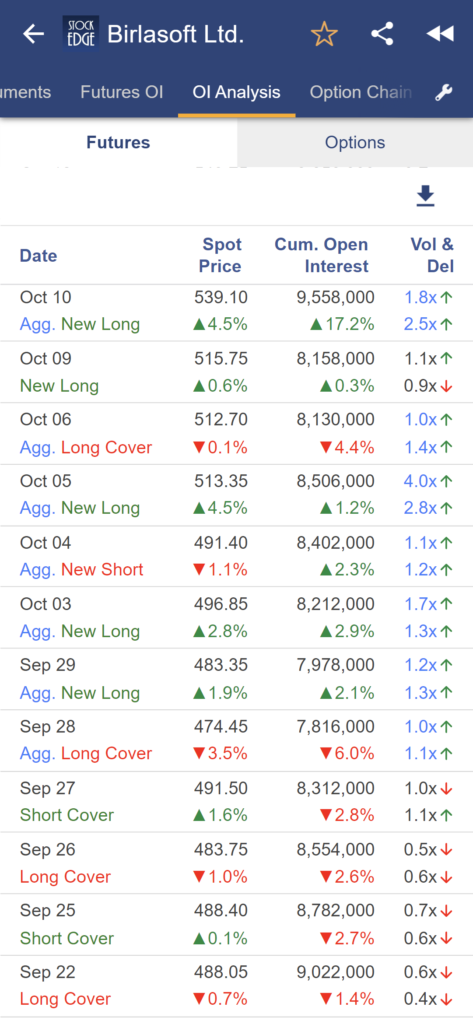
Now, you know how you can analyze the trend in open interest accompanied by changes in price, volume and delivery of stocks. But to identify and predict the future price movements of a stock, you have to take a look at the historical data and how these data points have changed over time. In order to analyze the previous data, simply click on the desired stock to view historical data for the past 60 trading days. (as you can see in the image below in the case of RBL Bank)
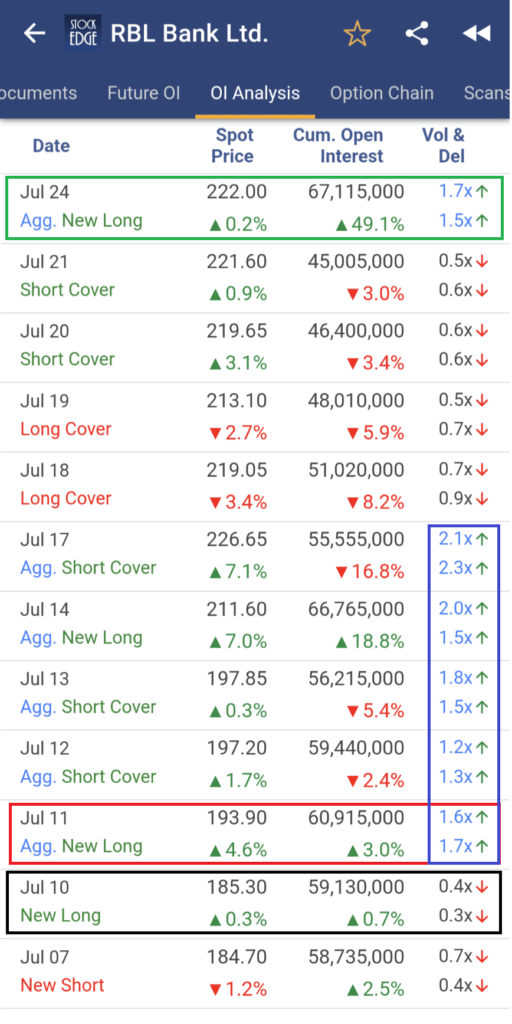
As you can see in the above image, a fresh new long was created on 10th July, where price and cumulative OI have increased, and the share price was at 185.
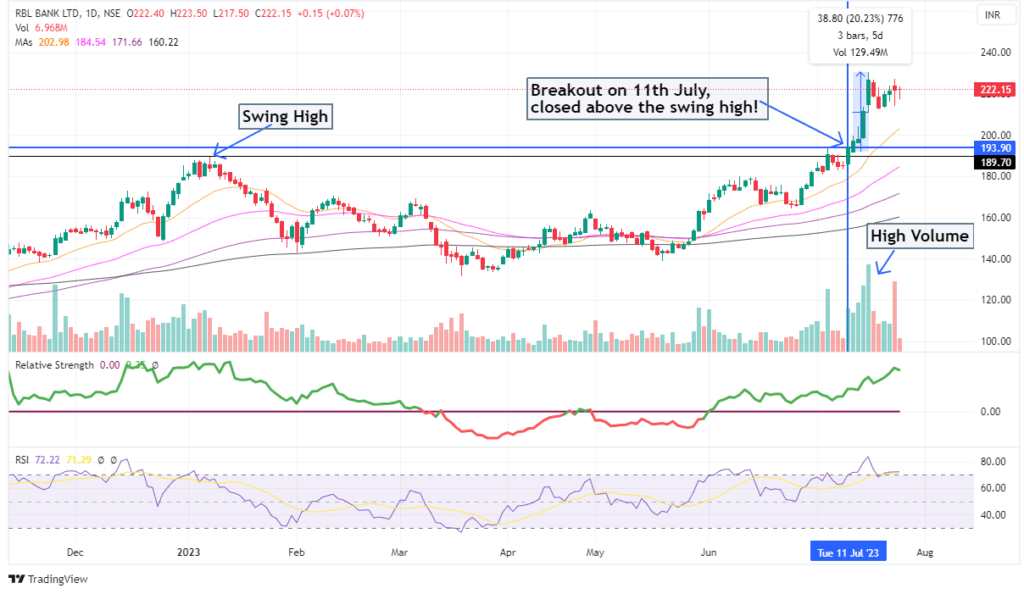
The next day 11th July, Aggressive New Long was witnessed, where price and cumulative OI both increased along with high delivery and Volume. Post that, if you only look at the Volume and Delivery column, there was continuous high delivery and Volume in the stock. But the main focus point is on 11th July when Aggressive New Long occurred. Let’s now have a look at the daily chart of RBL Bank on TradingView
To learn more, Watch Mr. Vivek Bajaj explaining how to track the position of Operators in f&o stocks using the Derivatives Analytics.
Now, let’s understand the next tab under Derivatives Analytics, which is;
Options Analytics
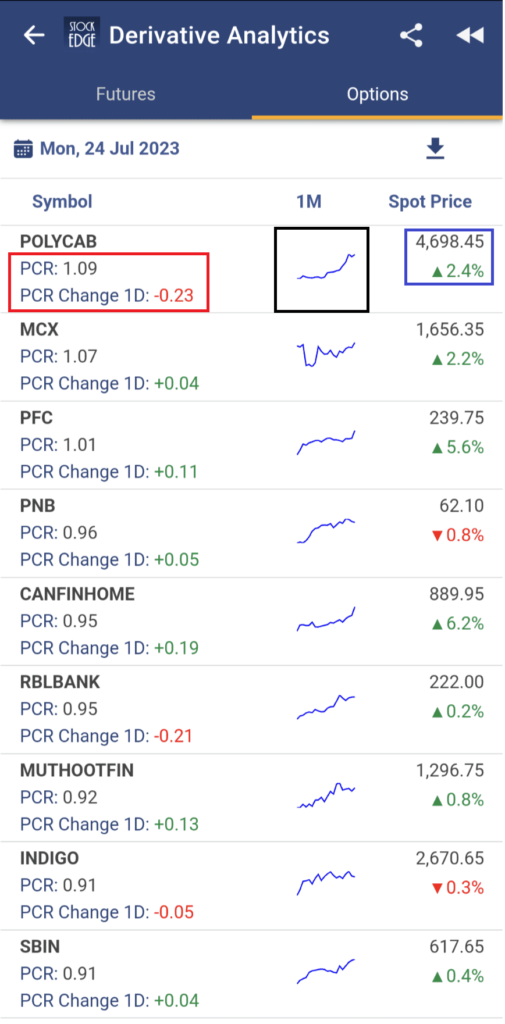
Next under the Options, you can view the list of stocks in f&o along with the following data for your analysis:
- Monthly Sparkline Chart: It is a line chart depicting the trend in the spot price of the stock over the last 1 month. It gives you a quick overview of the ongoing trend of the stock.
- Put Call Ratio: As PCR is already explained earlier, this gives the latest PCR of a stock.
- Change in Put Call Ratio: It is the absolute change in the put-call ratio from its previous trading day. An increase in Put Call Ratio indicates that the traders are creating more positions in the puts than calls and vice versa. If depicted the change in PCR from a sellers point of view, an increase in PCR over time indicates a bullish signal in the stock and vice versa.
- Spot Price and %Change in Spot Price: Spot price is the last trading price at the close of the last trading day and the % change is calculated from the previous trading day’s last traded price.
Therefore, Derivative Analytics is a valuable analytical tool that plays a crucial role in conducting research on stocks in f&o and also the overall derivatives market.
Enhancements in Derivative Analytics
Tracking stock-wise past open interest trends can provide valuable insights for traders and investors. Open interest is the total number of outstanding or open futures or options contracts for a particular security. By analyzing historical open interest data, you can gain a better understanding of market sentiment, potential price movements, and the level of participation in a specific stock.
Open interest data is usually presented as a time series, showing how open interest has changed over time. You can analyze this data to identify trends, patterns, and anomalies.
Get access to derivatives analytics data for the last 1 week to interpret and analyse trends and also get access to the last 60 days of OI trend data for futures and options for all stocks which will enable you to track the Open Interest trends in relation to market movements for the stocks driving your analysis stronger.
The Bottom Line
Understanding the importance of derivatives data and their complexities is essential for informed decision-making. Derivative Analytics empowers traders and investors with valuable insights and data-driven strategies. By leveraging this powerful tool, users can gain a deeper understanding of derivatives market dynamics, assess risks, and identify potential opportunities.
At StockEdge, we are dedicated to providing a seamless and enriching experience to our users, enabling them to navigate the world of derivatives confidently and make well-informed choices in their financial journey.
Happy trading!








Thanks sir for this information i need this kind of Knowledge.
It’s been pleasure to read the information which you have given in this blog and watching your videos is added sizzling.
Vivek Sir, Great work and great information in all aspects.
THANKS TO SHARE THIS KNOWLEDGE TIME TO TIME ,RECALL.