Table of Contents
What Is Adaptive Relative Strength (RS)?
Adaptive Relative strength is a momentum indicator that measures the strength of a stock’s price movement vis-a-vis the benchmark index (Nifty/Sensex). The benchmark date considered here has been predefined by StockEdge based on the last major market trend change date. These dates can be seen by plotting Adaptive Relative Strength in Edge Chart.
Suppose a stock has performed better than the benchmark. In that case, Adaptive Relative Strength is positive, Adaptive Relative Strength signifies the exact same movement of the stock, and negative Adaptive Relative Strength signifies the Stock has underperformed the benchmark index.
The indicator can also be used to compare two companies in the same industry or Index. This comparison examines the relative strength performance of two stocks with respect to their benchmark or sector and can help to decide whether one should hold, buy, or sell the other.
Avail of the courses on Relative Strength on Elearnmarkets and get the technical knowledge to master Trading:
- SYSTEMATIC TRADING USING RELATIVE STRENGTH/MOMENTUM.
- BECOME A BLAZING TENDULKAR WITH RELATIVE STRENGTH (RS).
- IDENTIFY MASTER BLASTER STOCKS WITH “RELATIVE STRENGTH”.
What Is Static Relative Strength (RS)?
Static Relative strength is a momentum indicator that measures the strength of a stock’s price movement vis-a-vis the benchmark index (Nifty/Sensex) over a period of 123 trading days.
If a Stock has performed better than the benchmark, then Static Relative Strength is positive, Static Relative Strength 0 signifies the exact same movement of the stock, and negative Adaptive Relative Strength signifies the Stock has underperformed the benchmark index.
Using Adaptive Relative Strength & Static Relative Strength in StockEdge App:
Above, we have discussed the concept of Adaptive Relative Strength & Static Relative Strength; now let us discuss how we can use this technical indicator to filter out stocks for trading:
In StockEdge, there are mainly 6 scans available for filtering out stocks for trading:
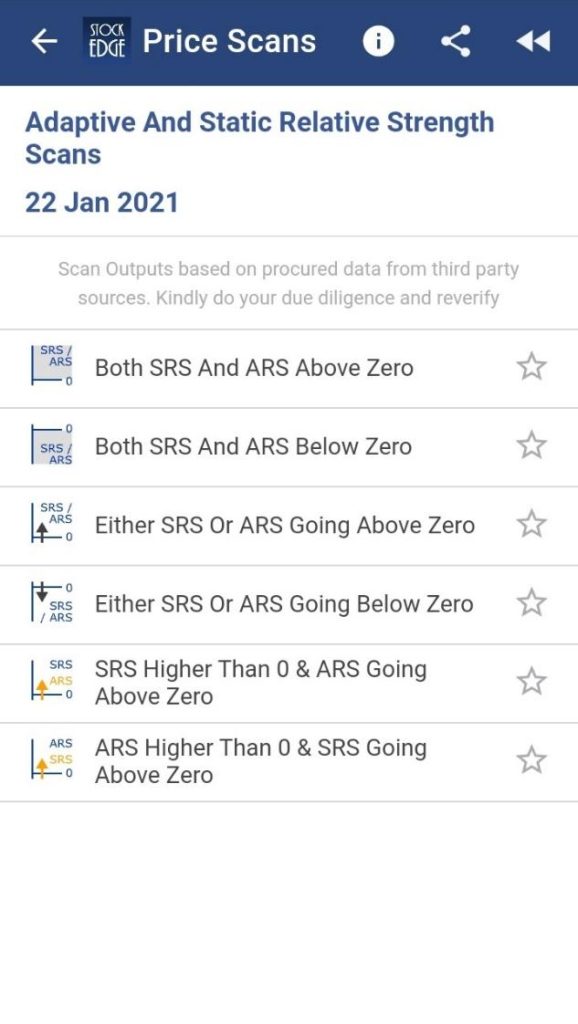
Let us discuss in detail about some of these scans:
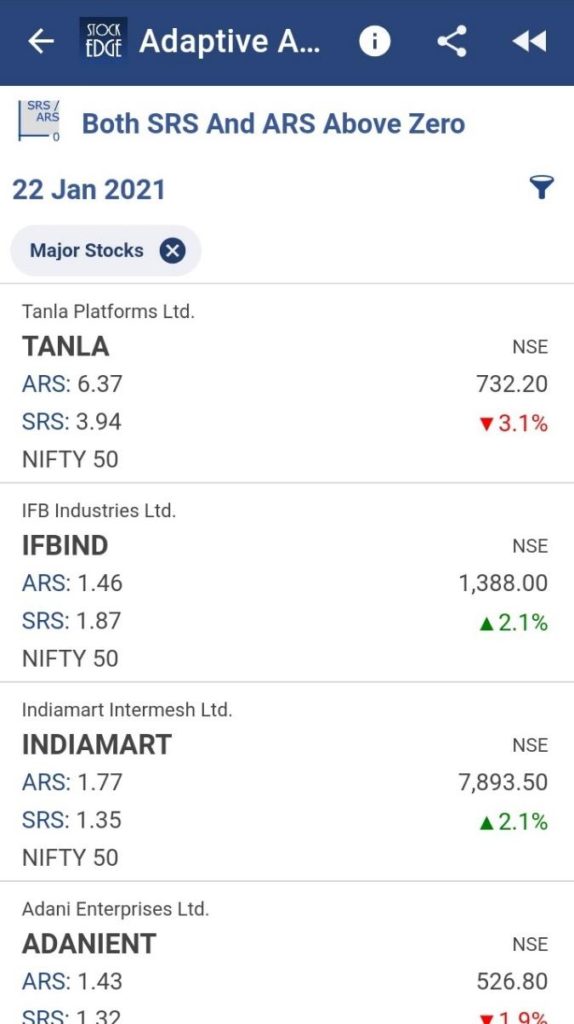
1. Both Adaptive Relative Strength & Static Relative Strength above zero:
This scan can be used to identify the companies that are strongly Outperforming the Benchmark Index in the last 123 days and since the last Adaptive Relative Strength benchmark date.
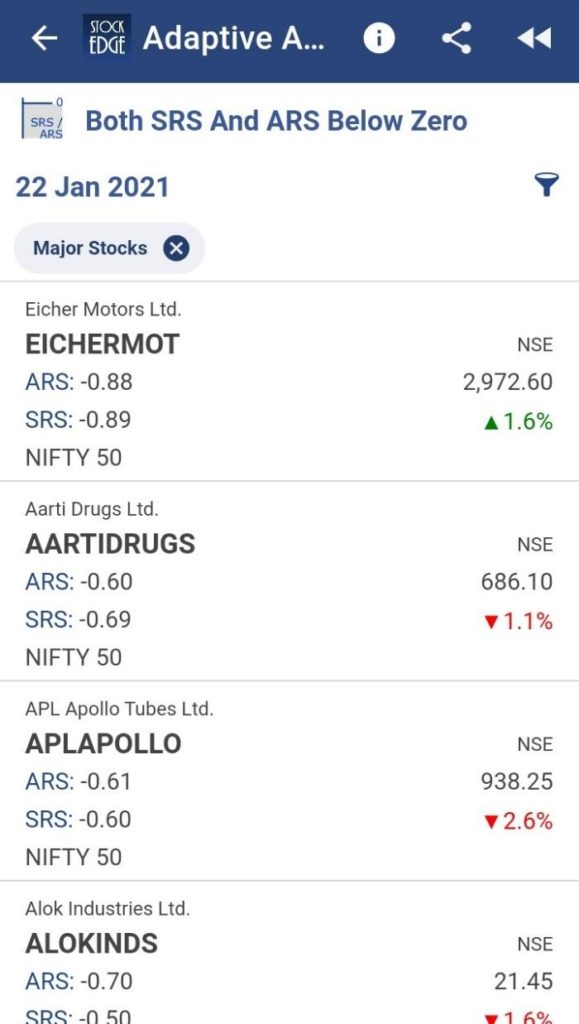
2. Both Static Relative Strength and Adaptive Relative Strength below Zero:
This scan can be used to identify the companies that are strongly underperforming the Benchmark Index in the last 123 days and since the last Adaptive Relative Strength benchmark date.
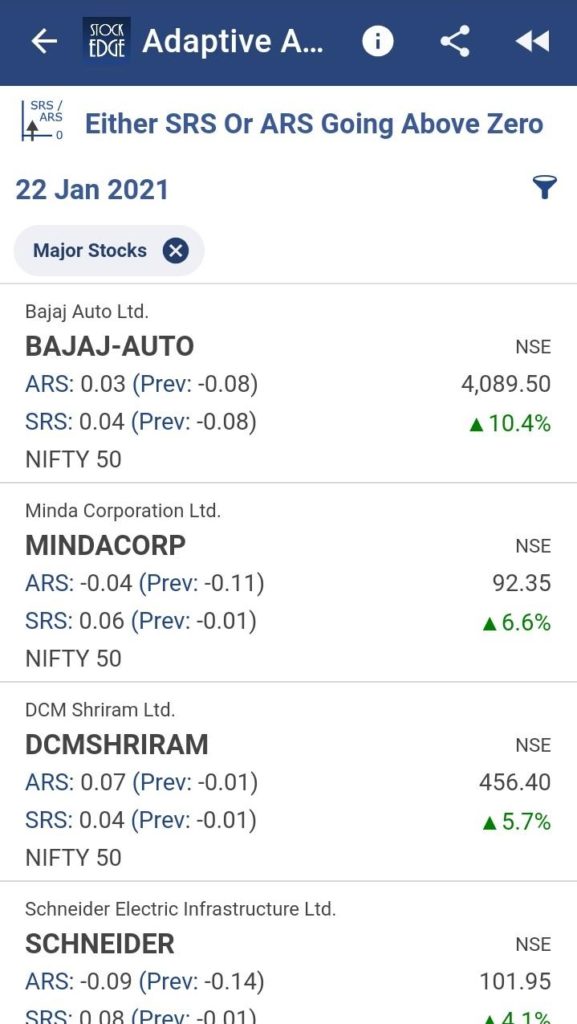
3. Either Adaptive Relative Strength & Static Relative Strength going above zero:
This scan can identify companies entering the bullish zone as either Adaptive Relative Strength & Static Relative Strength is going above zero, i.e., outperforming the benchmark index.
4. Either Adaptive Relative Strength & Static Relative Strength going below zero:
This scan can be used to identify the companies which are entering the bearish zone as either Adaptive Relative Strength & Static Relative Strength is going below zero, i.e., underperforming the benchmark index.
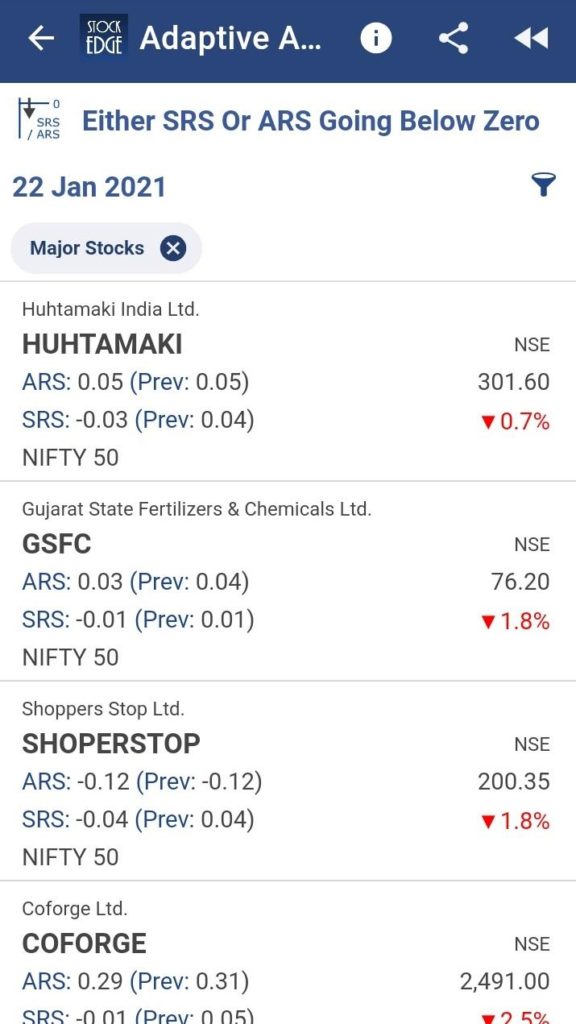
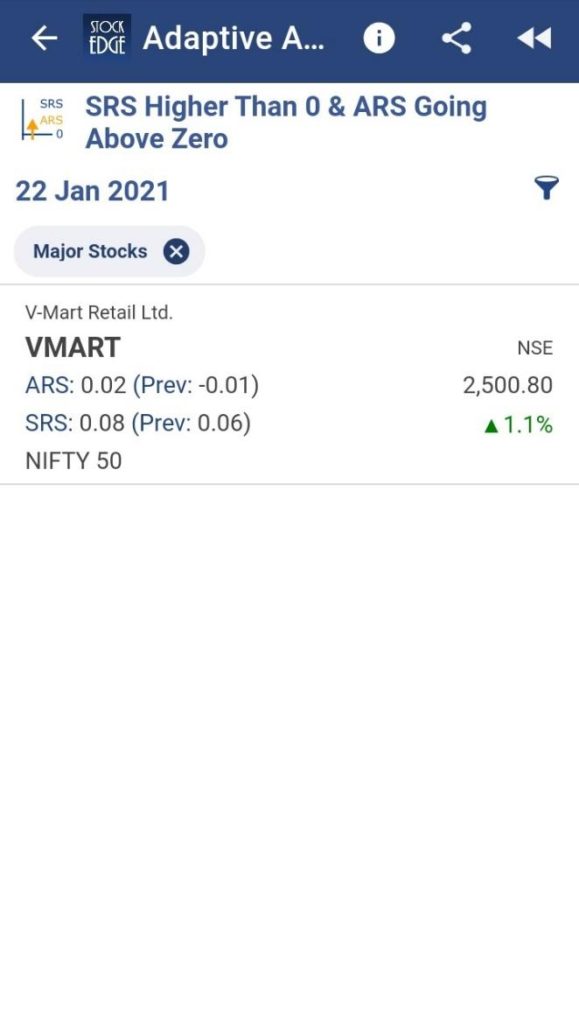
5. Static Relative Strength higher than 0 & Adaptive Relative Strength going above zero:
This scan can be used to identify the companies that have performed better than the benchmark index in the last 123 trading days, and today Adaptive Relative Strength has turned positive today.
6. Adaptive Relative Strength higher than 0 & Static Relative Strength going above zero:
This scan can be used to identify the companies that have performed better than the benchmark index with respect to a predefined date by StockEdge based on the last major market trend change date, and now Static Relative Strength has turned positive today.
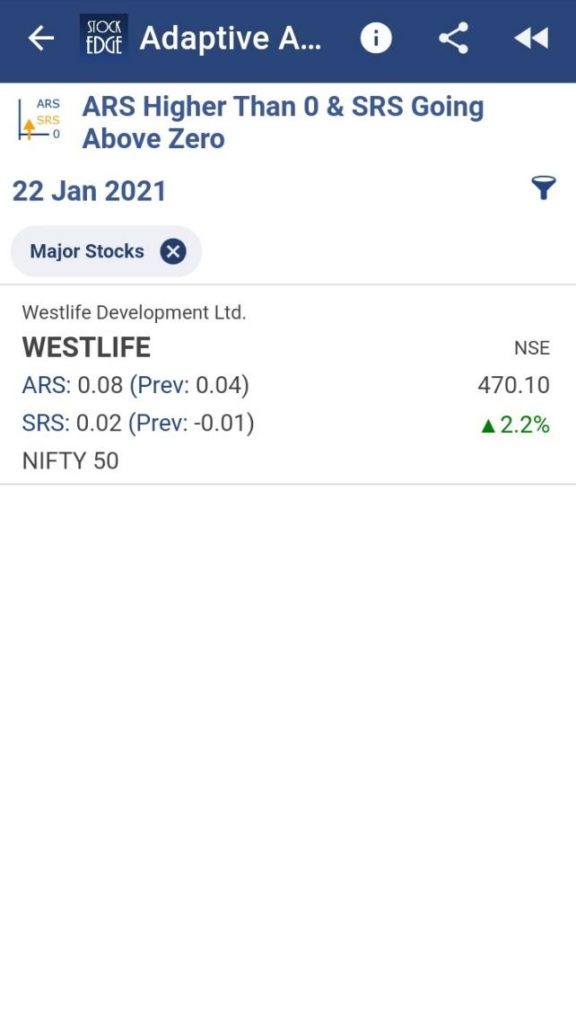
Above are examples of the latest Scans of Adaptive Relative Strength & Static Relative Strength that tell you if the stock is bearish or bullish and also give us a list of the stock which fulfills the criteria of the particular day.
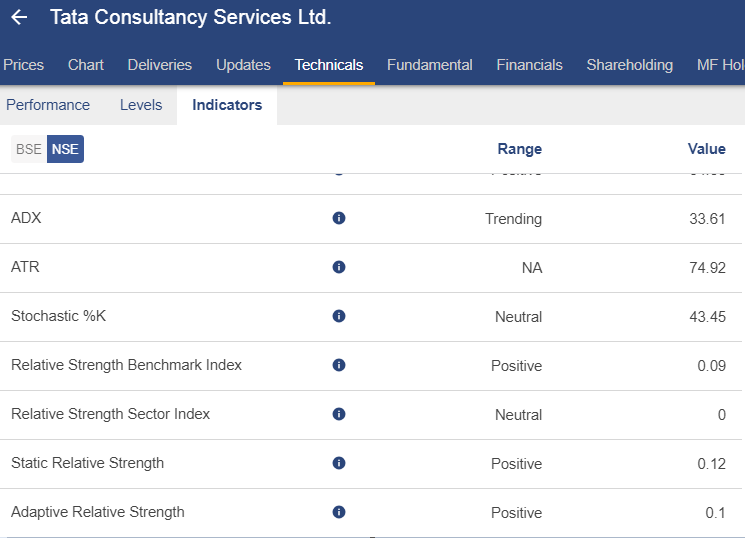
Furthermore, to know the values of Adaptive Relative Strength & Static Relative Strength Scans, all you need to do is, type in the name of the stock in the search box, click on the stock and then click on the technical section of the stock, under this, you have to click on the “Indicators” tab.
You will be able to see both the values of Adaptive Relative Strength & Static Relative Strength and the signal whether it is positive, neutral, or negative.
For eg:-
You can filter out the stocks and can trade accordingly using these scans.
ARS-SRS scans are one of the few premium tools offered by StockEdge App which you can download from here.
Check out StockEdge Premium Plans.








Best learning. Thanks Sir.
We are glad you liked the content. Keep following us on Twitter to read more such Blogs!
What is actually the difference between ARS and SRS? This point is still unanswered in above article. Please educate. Thanks
Hi Bhavin, Static Relative strength is measured over a period of 123 trading days whereas Adaptive Relative strength is measured with respect to a benchmark date predefined by StockEdge based on the last major market trend change date.
Hi this is siddu
without STOCKEDGE there is no succces in stock market
It’s really very interesting, Thanks for sharing.
Great stuff. SRS and ARS have greatly helped me to filter out under performing stocks. with this i have reduced my losses.
Best learning and It makes my Setup more Powerful.