Table of Contents
MACD stands for Moving Average Convergence / Divergence. It is a very useful technical analysis momentum indicator and trend created by Gerald Appel in the late 1970s. The Moving Average Convergence and Divergence indicator is basically a refinement of the two moving averages system and measures the distance between the two moving average lines.
Moving Average Convergence and Divergence doesn’t fully qualify to fall into either the trend-leading indicator or trend following indicator; in fact, it is a hybrid with elements of both. It comprises two lines, the fast line, and the slow or signal line. These are easy to identify as the slow line will be the smoother of the two.
It is calculated by subtracting the 26-period Exponential Moving Average (EMA) from the 12 periods EMA.
This indicator generates potential buying and selling signals and also tells us when the trend is reversing.
See also: Parabolic SAR (PSAR)
Let us discuss this indicator in detail:
What is Moving Average Convergence and Divergence?
Moving Average is a momentum and trend indicator that is calculated by subtracting 26 periods EMA from the 12 periods EMA.
This indicator generates a bullish signal whenever the 12 period EMA is above the 26 periods EMA and generates a bearish signal when the 12 period EMA is below the 26 periods EMA.
The 9 periods EMA is considered as the signal line.
The formula for calculating MACD is:
Moving Average Convergence and Divergence = 12 PERIOD EMA – 26 PERIOD EMA
To know more about MACD, refer to the video on StockEdge Moving Average Convergence and Divergence scan tutorial:
Using MACD in StockEdge App:
We have discussed the basics of MACD, now let us discuss how to use this technical indicator to filter out stocks for trading:
In StockEdge there are many MACD scans available for filtering out stocks for trading:
Let us discuss a few of these scans:
Example 1: MACD crossing signal line from below and MACD crossing signal line from above:
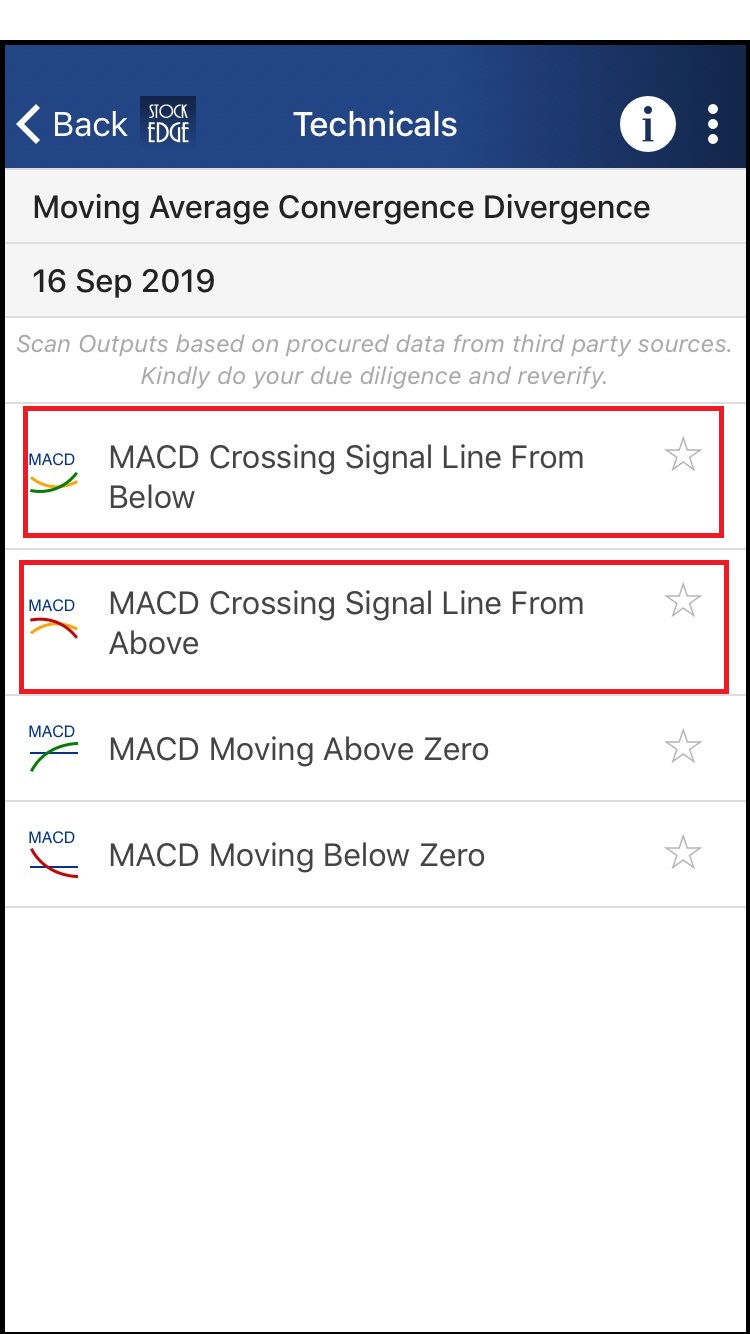
MACD Crossing Signal Line from Below indicates a bullish signal that suggests that the stock price may reverse upward when it crosses the signal line from below.
MACD Crossing Signal Line from Above indicates a bearish signal that suggests that the stock price may reverse downward when it crosses the signal line from above.
When we click on MACD Crossing Signal Line from the Below scan, we get a list of stocks that fulfill this criterion:
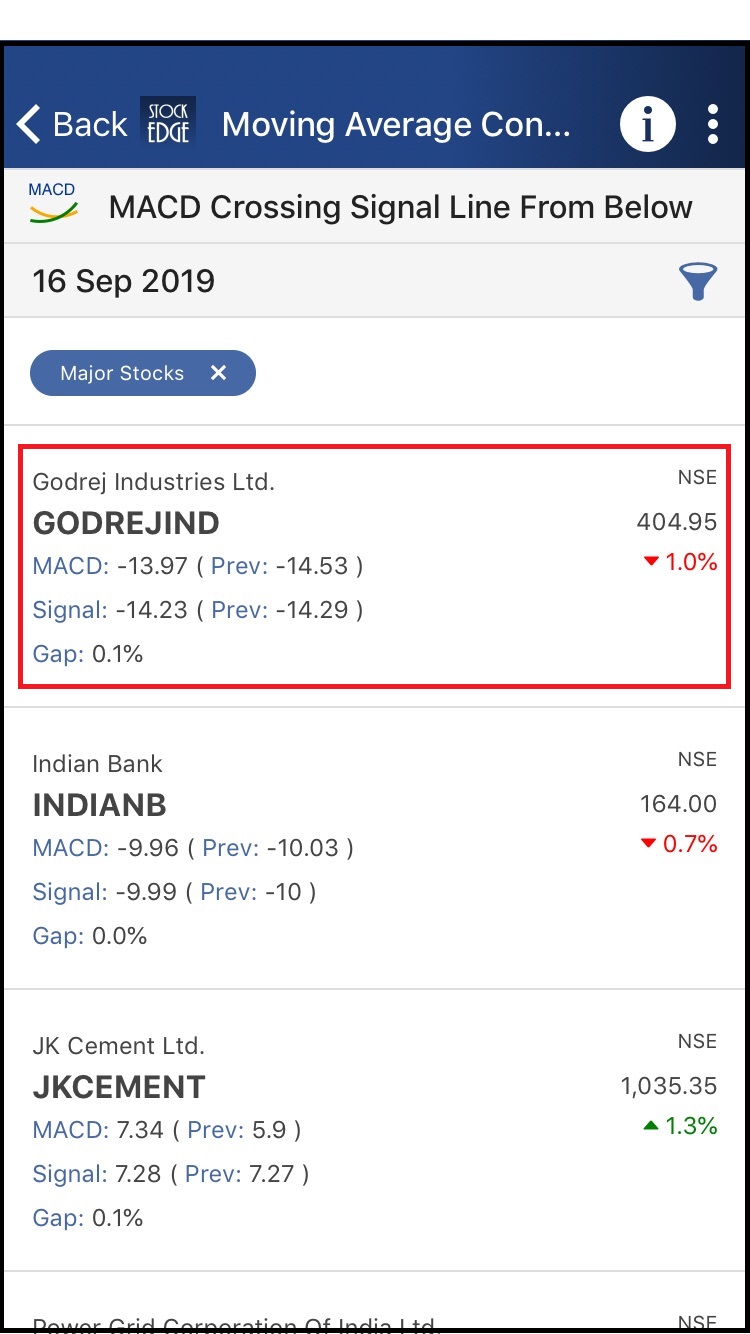
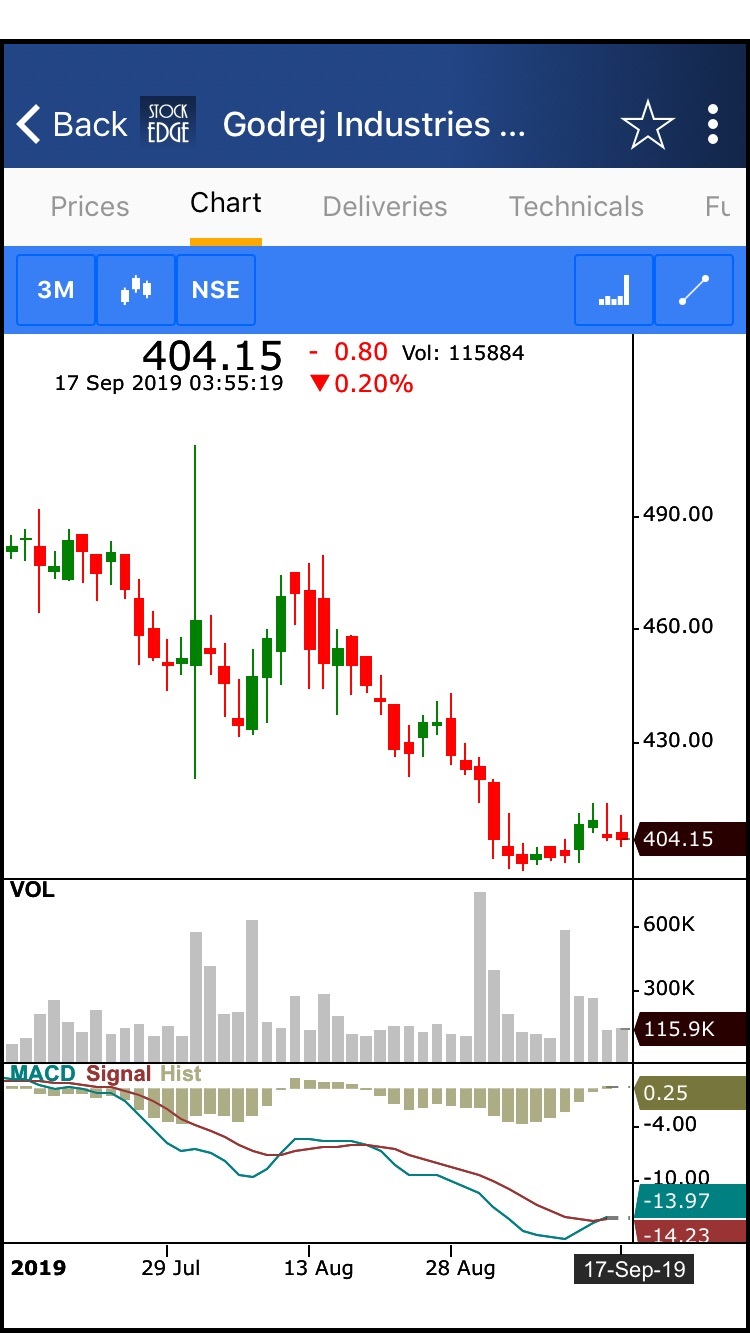
After clicking on Godrej Industries Ltd. we get a technical chart with Moving Average plotted in the subgraph:
Example 2: MACD moving above zero and MACD moving below zero:
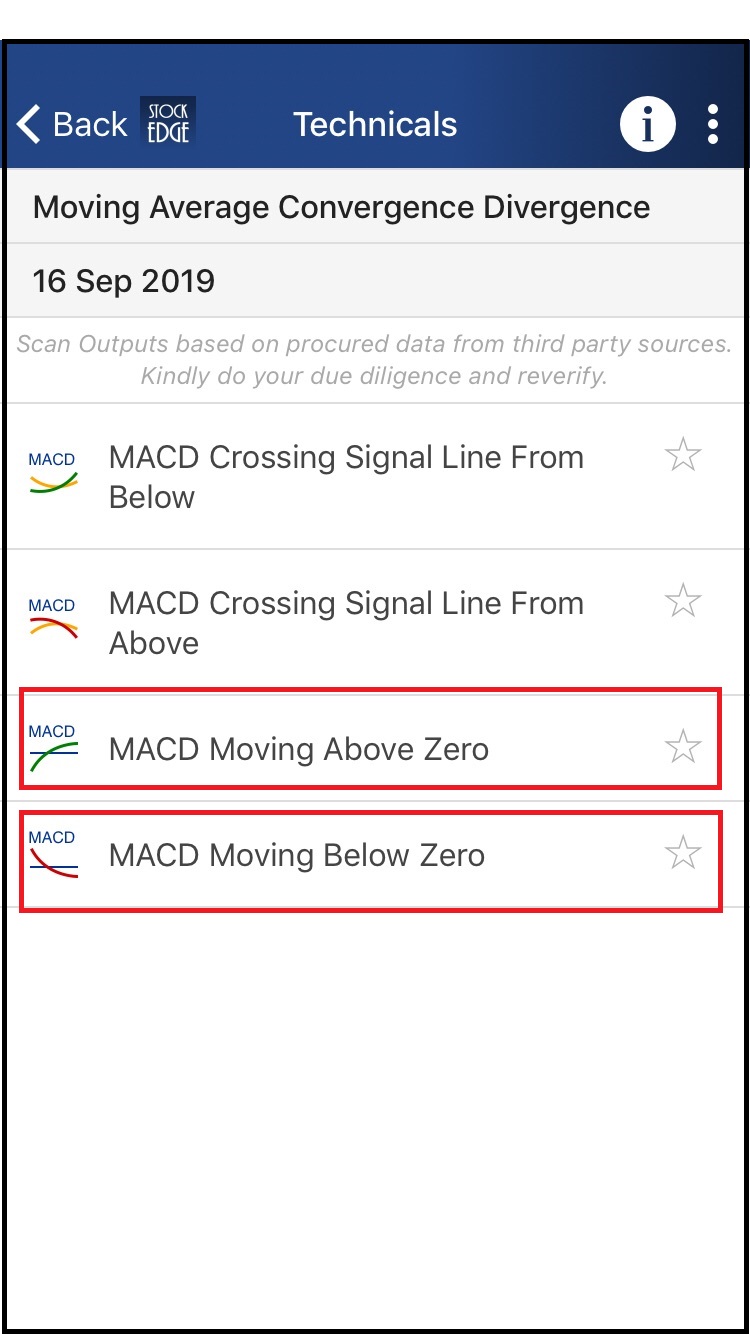
MACD Moving Above Zero indicates a bullish signal which indicates the stock price may experience upward movement when it goes above the zero line.
MACD Moving Below Zero indicates a bearish signal which indicates the stock price may experience downward movement when it goes below the zero line.
When we click on MACD Moving Above Zero scan, we get a list of stocks that fulfill this criterion:
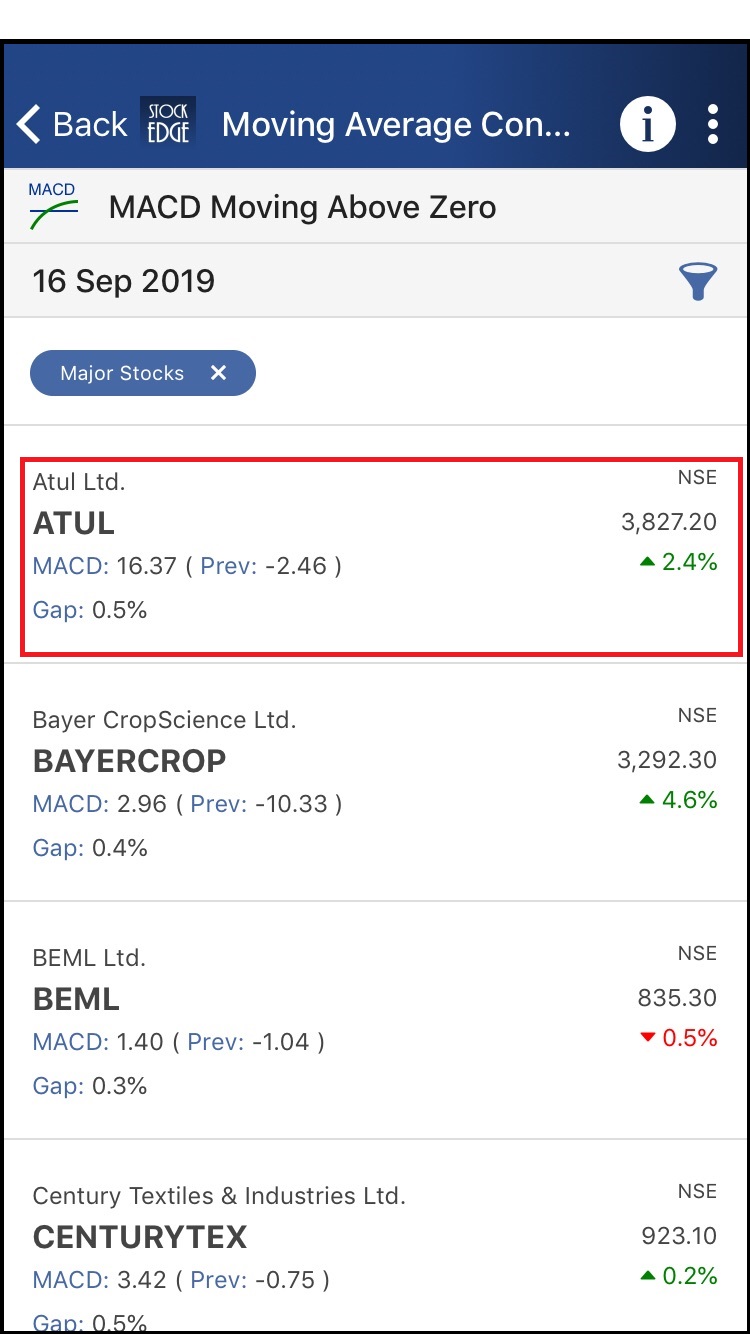
After clicking on Atul Ltd. we get a technical chart with Moving Average plotted in the subgraph:
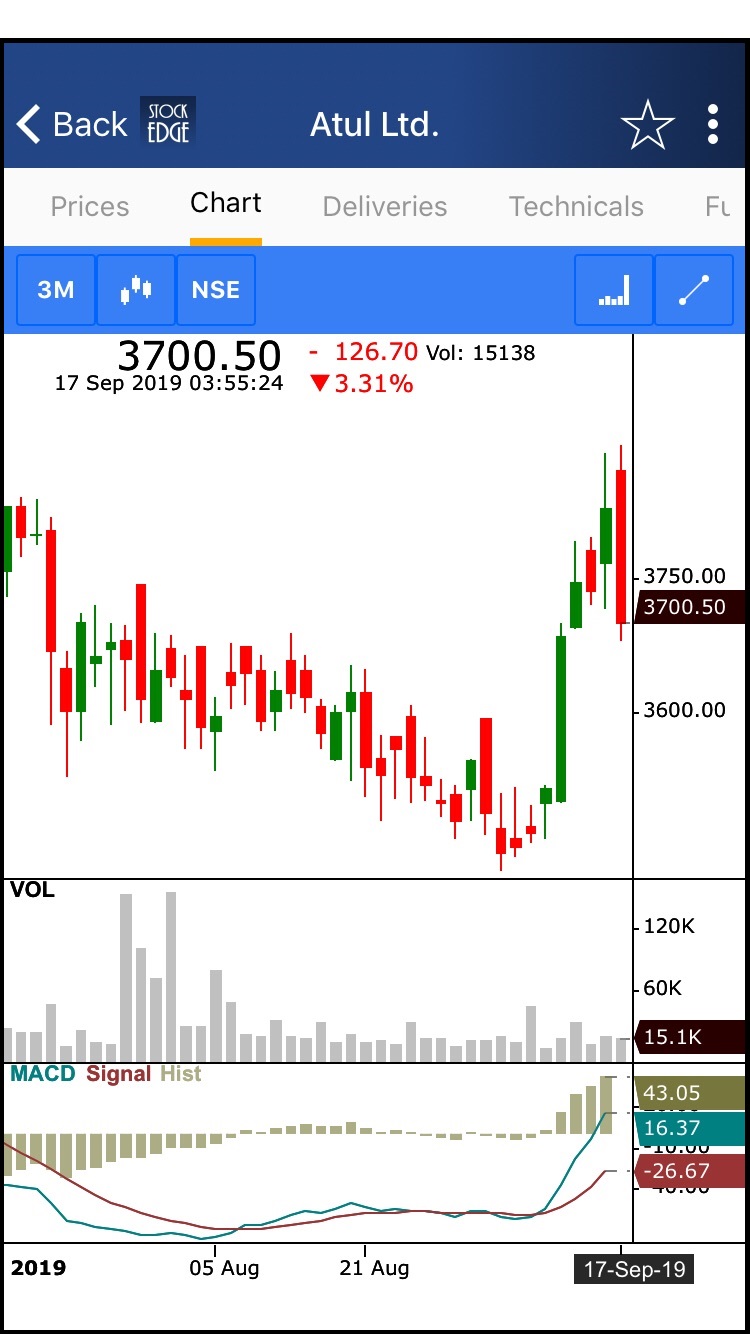
Above are examples of the MACD scans that generate buy and sell signals and also give us a list of the stock which fulfills the criteria of the scans for that particular day.
Importance of MACD
The use of moving averages ensures that the indicator will eventually follow the movements of the underlying security. As a momentum indicator, it has the ability to foreshadow moves in the underlying security. MACD divergences can be used as a key factor in predicting a trend change. A negative divergence signals that bullish momentum is going to end and there could be a potential change in trend from bullish to bearish. This can serve as an alert for traders to take some profits in long positions, or for aggressive traders to consider initiating a short position. MACD can be applied to daily, weekly, or monthly charts.
Frequently Asked Questions
MACD a good indicator?
It has characteristics of both leading and lagging indicators, along with a moving average trigger line, the MACD presents the kind of versatility and multi-functionality traders covet. Perhaps more importantly, the trend-following and momentum-forecasting abilities of the MACD are not bogged down by extreme complexity. Support and resistance areas are commonly used with MACD indicators to find price points where the trend might change direction.u003cbru003e
Which is better MACD or RSI?
Both trend-following momentum indicators show the relationship between two moving averages of a security’s price. The MACD measures the relationship between two EMAs, while the RSI measures price change in relation to recent price highs and lows. These two indicators are often used together to provide analysts and traders with a more complete technical picture of a market. Statistical studies have shown that the RSI Indicator tends to deliver a higher success rate in trading than the MACD Indicator. This is largely driven by the fact that the RSI Indicator gives fewer false trading signals than MACD. That being said, there are specific trading scenarios in which the MACD can prove to be a better indicator.
Which MACD setting is best?
The typical MACD default settings are (12, 26, and 9) and refers to the following:u003cbru003e(12) – The 12 period exponentially weighted average (EMA) or ‘fast line’u003cbru003e(26) – The 26 period EMA or ‘slow line’u003cbru003e(9) – The 9 period EMA of the MACD line, known as the ‘signal line’u003cbru003eWhere,u003cbru003eMACD = fast line – the slow lineu003cbru003eSignal line = 9 period EMA of the MACD itself.u003cbru003eIt is the standard MACD Setting.u003cbru003e
What is MACD strategy?
Moving Average is a momentum and trend indicator which is calculated by subtracting 26 periods EMA from the 12-period EMA.u003cbru003eThis indicator generates a bullish signal when whenever the 12 period EMA is above the 26 periods EMA and generates a bearish signal when the 12 period EMA is below the 26 periods EMA.u003cbru003eThe 9 period EMA is considered as the signal line.u003cbru003eThe formula for calculating MACD is:u003cbru003eMACD = 12 PERIOD EMA – 26 PERIOD EMAu003cbru003e
You can filter out the stocks and can trade accordingly using these scans and analyze them on Edge charts in StockEdge or on a charting platform TradingView as per your liking!
MACD scans and Interactive charts are only available for paid subscribers. You can check out our subscriber plans from here.
To have a comprehensive idea of Moving Average Convergence Divergence, click here.
Check out the webinar hosted by Chetan Panchamia throwing light upon the usage of Moving Average Convergence and Divergence Indicator.
Also read Interpretation of MACD Indicator.




Good