Table of Contents
A SuperTrend indicator is a trend-following indicator. It is plotted on price and the current trend can simply be determined by its placement vis-a-vis price. This is a very simple indicator and is constructed with the help of just two parameters- period and multiplier.
The default parameters which are taken are 10 for Average True Range (ATR) and 3 for its multiplier for the construction of SuperTrend Strategy. The average true range (ATR) plays an important role in ‘SuperTrend’ as the indicator uses ATR to compute its value and it signals the degree of price volatility.
Best Timeframe to Use in Supertrend Indicator
Different traders have different trading strategies and different time horizons for their investments or trades for execution. So the longer timeframes can be used by swing traders and position holders.
The scan can be used on multiple timeframes where you place it on a larger time frame then go down to a lower time frame and use it as entry and exit signals.
How to identify buy and sell signals using super trend indicators?
In StockEdge App when you click on Scans, followed by Technical Scans, you will be able to see Supertrend scans available for filtering out stocks for trading:
Let us discuss the scans:
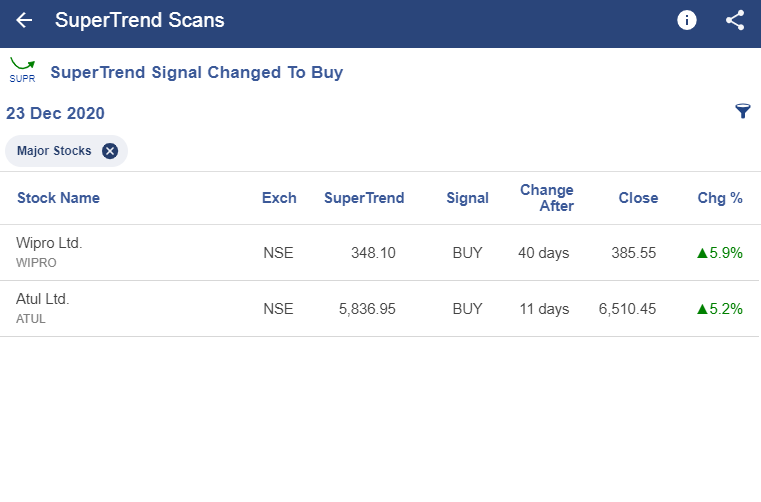
SuperTrend Signal Changed To Buy
The BUY signal is generated for stocks whose SuperTrend indicator closes below the closing price and the color changes to green. The “Change After” column signifies after how many days the signal has changed.
See also: Audited Vs Unaudited Company Financial Statements
Once the indicator is plotted, this is how it appears on the chart –
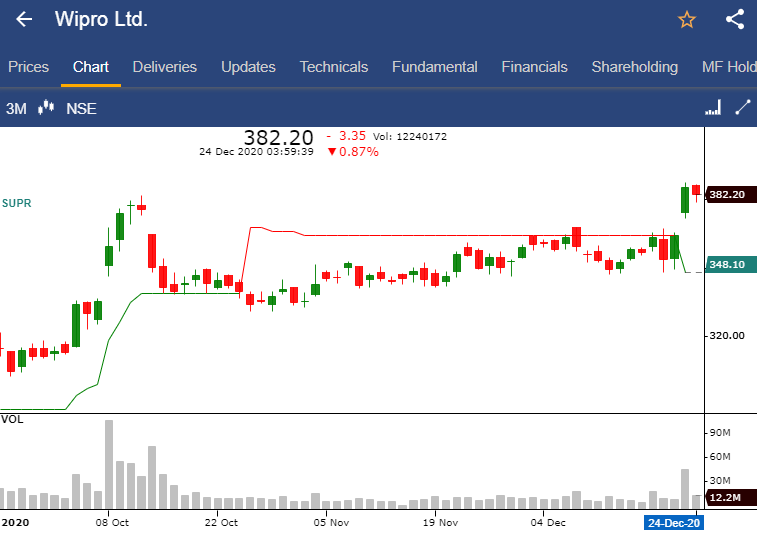
The interesting thing to notice is how the indicator changes the color as the price moves. The below image illustrates the SuperTrend Signal of GlaxoSmithKline Pharmaceuticals Ltd.
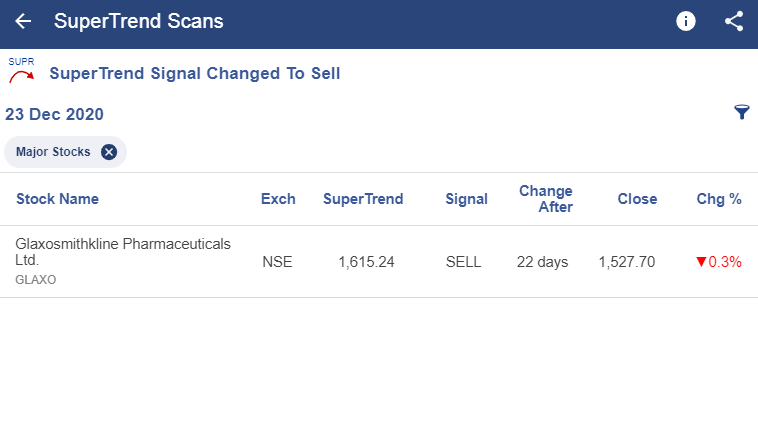
SuperTrend Signal Changed To Sell
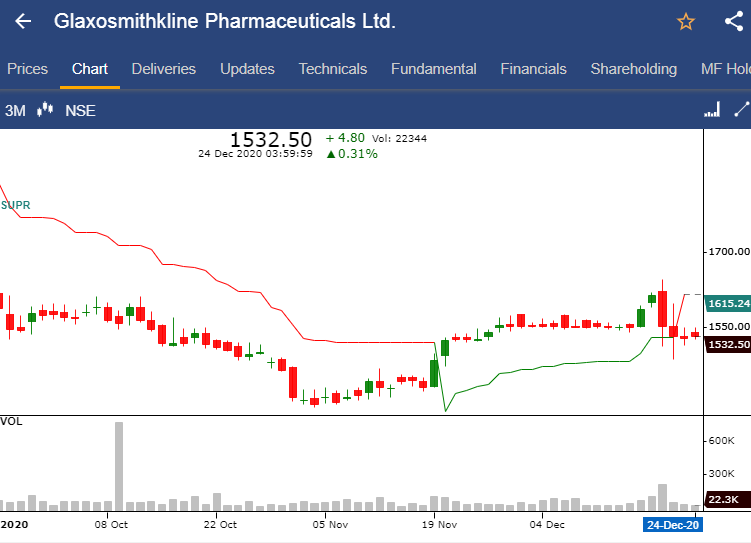
The SELL signal is generated for stocks whose SuperTrend indicator closes above the closing price and the color changes to red. The “Change After” column signifies after how many days the signal has changed.
Again, notice how the indicator changes the color as the price moves.
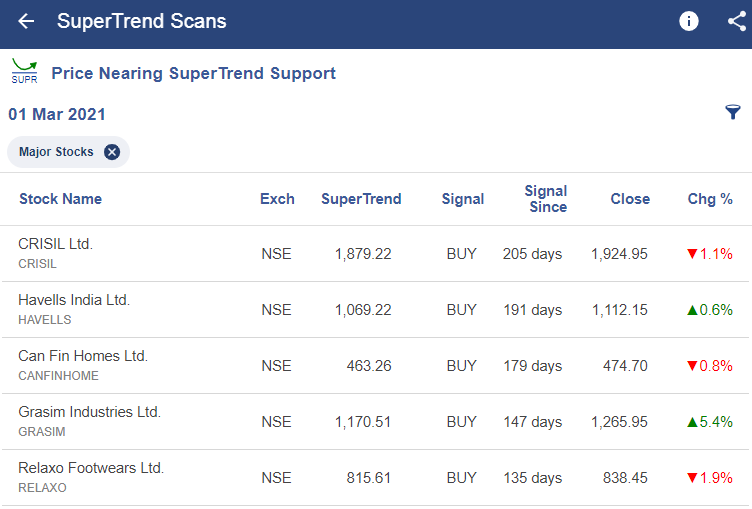
Price Nearing SuperTrend Support
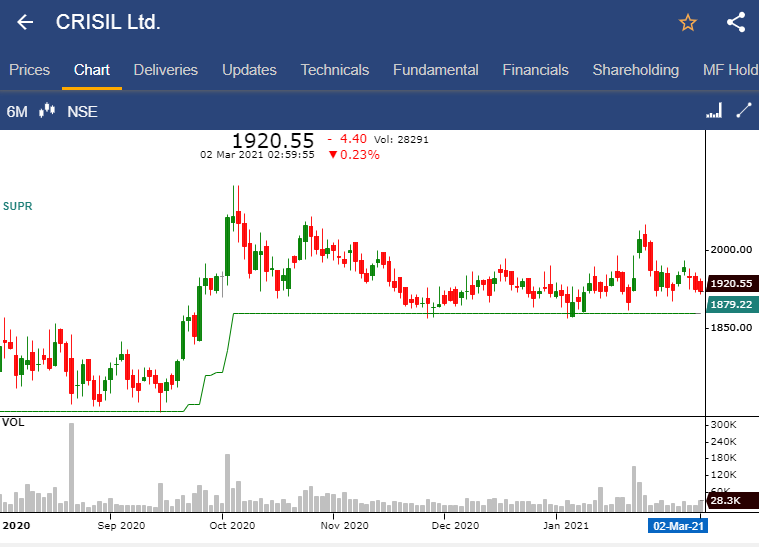
Buy signal is generated when the closing price is near within 3% of the super trend support zone. The “Signal Since” column signifies how long the signal has been there.
Once the indicator is plotted, this is how it appears on the chart displaying CRISIL Ltd. –
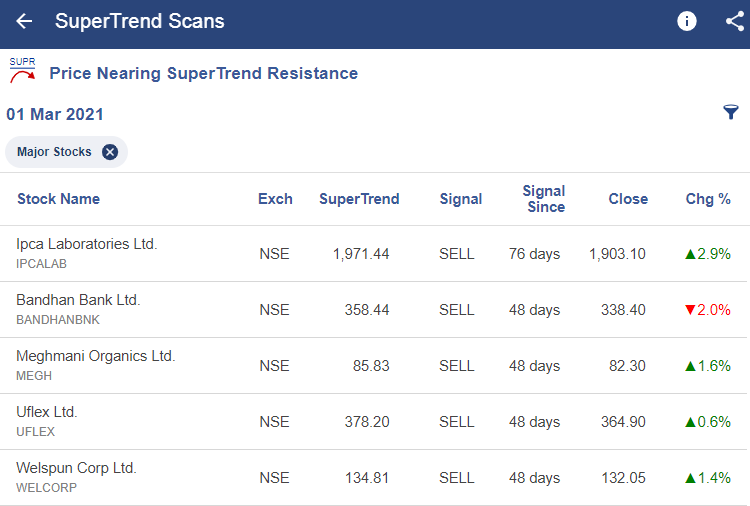
Price Nearing SuperTrend Resistance
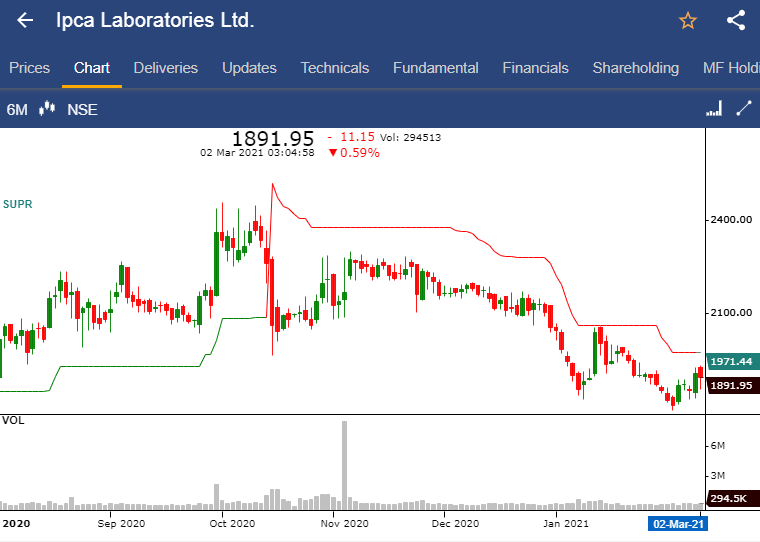
Sell signal is generated when the closing price is near within 3% of the super trend resistance zone. The “Signal Since” column signifies how long the signal has been there.
Again, notice how the indicator changes the color as the price moves.
There is no such technical indicator that has 100% accuracy. Super Trend also generates false signals in the sideways market, though it gives lesser false signals as compared to other indicators.
You can filter out the stocks and can trade accordingly using these scans and analyze them on Edge Charts in StockEdge as shown above or you may use charting platform TradingView as per you liking!
SuperTrend scans are one of the few premium tools offered by the StockEdge App which you can download from here.
Check out StockEdge Premium Plans.







Send