Table of Contents
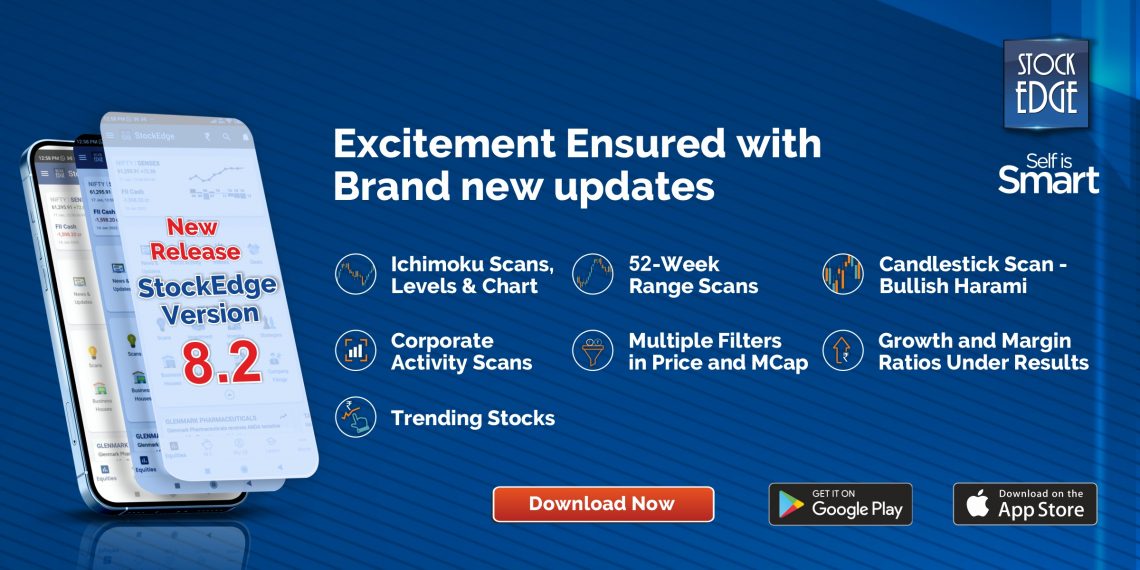
StockEdge is delighted to release StockEdge Version 8.2.
With every release, we onboard a few features that add significant value in understanding the financial markets better.
In this release, we introduce the following features to our users:
- Ichimoku Cloud
- 52 Week Range Scans
- Candlestick Scan – Bullish Harami Scan
- Multiple Filters in Price & MCap
- Corporate Activity Scans
- Growth and Margin Ratios
- Trending Stocks
Continue reading below to know more about these fantastic features:
Ichimoku Cloud:
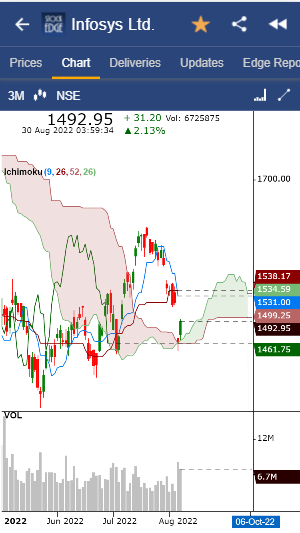
Ichimoku Cloud is a technical indicator that identifies price trends. Ichimoku Cloud is used to catch the direction, momentum, volatility, support, and resistance levels. The Ichimoku Cloud consists of 5 different lines. They are:
- Tenkan Sen (Conversion Line) – An average of the 9 Day High and Low Price
- Kijun Sen (Base Line) – An average of the 26 Day High and Low Price
- Senkou Span A (Leading Span A) – An average of Tenkan Sen and Kijun Sen. The value calculated today is plotted 26 trading days into the future.
- Senkou Span B (Leading Span B) – An average of the 52 Day High and Low Price. The value calculated today is plotted 26 trading days into the future.
- Chikou Span (Lagging Span) – Today’s closing price plotted 26 trading days in the past.
The Ichimoku Cloud is outlined by the Senkou Span A and Senkou Span B. When the Senkou Span A is above the Senkou Span B, the cloud is shaded in green indicating a bullish outlook and when the Senkou Span B is above the Senkou Span A, the cloud is shaded in red indicating a bearish outlook.
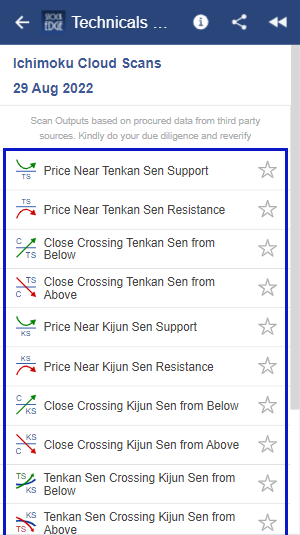
Users can plot the Ichimoku Cloud on Edge Chart, and view the values of different lines under the Levels sub-tab under the Technicals tab. Also, 14 new Scans relating to Ichimoku Cloud have been introduced in the Technical Scans category. They are:
- Price Near Tenkan Sen Support
- Price Near Tenkan Sen Resistance
- Close Crossing Tenkan Sen from Below
- Close Crossing Tenkan Sen from Above
- Price Near Kijun Sen Support
- Price Near Kijun Sen Resistance
- Close Crossing Kijun Sen from Below
- Close Crossing Kijun Sen from Above
- Tenkan Sen Crossing Kijun Sen from Below
- Tenkan Sen Crossing Kijun Sen from Above
- Senkou Span A crossing Senkou Span B from Below
- Senkou Span A crossing Senkou Span B from Above
- Chikou Span Crossing Price from Below
- Chikou Span Crossing Price from Above
52 Week Range Scans:
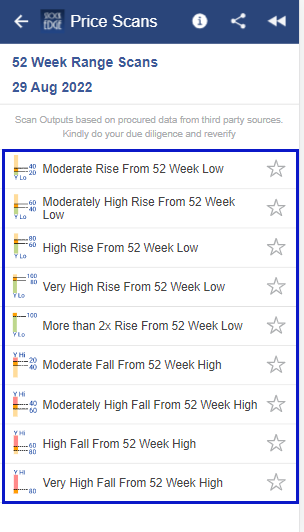
52 Week Range Scans identify stocks trading at a certain range below/above the 52 Week High/Low values of the stocks respectively. The stocks trading in a range away from their 52 Week High/Low values indicates ongoing trends and potential trend reversals. 52 Week High/Low values are significant and movement from such values is captured through these scans. The scans are available in the Price Scans Section. The scans that have been introduced are:
- Moderate Rise from 52 Week Low indicating stocks trading in the range of 20%-40% above their 52 Week Low value.
- Moderately High Rise from 52 Week Low indicating stocks trading in the range of 40%-60% above their 52 Week Low value.
- High Rise from 52 Week Low indicating stocks trading in the range of 60%-80% above their 52 Week Low value.
- Very High Rise from 52 Week Low indicating stocks trading in the range of 80%-100% above their 52 Week Low value.
- More than 2x Rise from 52 Week Low indicating stocks trading at levels above 100% or more from their 52 Week Low value.
- Moderate Fall from 52 Week High indicating stocks trading in the range of 20%-40% below their 52 Week High value.
- Moderately High Fall from 52 Week High indicating stocks trading in the range of 40%-60% below their 52 Week High value.
- High Fall from 52 Week High indicating stocks trading in the range of 60%-80% below their 52 Week High value.
- Very High Fall from 52 Week High indicating stocks trading in the range of 80%-100% below their 52 Week High value.
Candlestick Scan – Bullish Harami Scan:
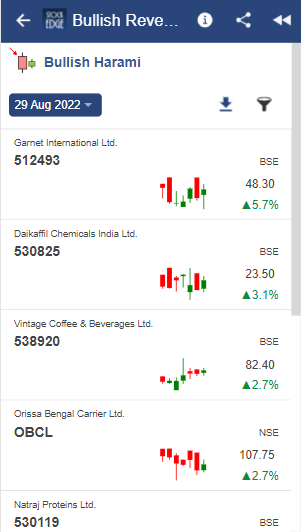
A Bullish Harami candlestick pattern indicates that an ongoing bearish trend may come to an end or the stock may be reversing from an ongoing bearish trend. Bullish harami patterns can be identified over 2 or more trading days, with the initial candles confirming a downtrend (red candles) followed by a long candle (green candle) which is within the range of the previous red candle. Bullish Harami Scan is introduced in the Bullish Reversal Scans category of Candlestick Scans. All stocks that fulfill the criteria to confirm this pattern will be displayed in the scan output.
Multiple Filters in Price & MCap:
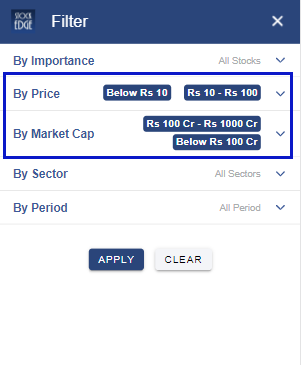
Users can now apply multiple filters in Scans, Strategies and My Combo Scans for Price Range and Market Capitalization. This will enable users to further narrow down their research and get more accurate results that are aligned with their goals and interests.
Corporate Activity Scans:
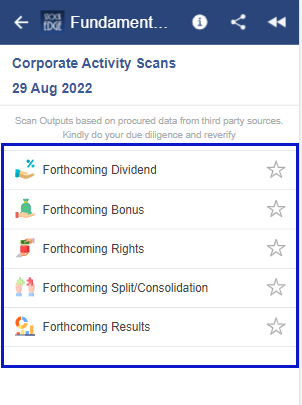
Corporate Actions refer to Dividends, Stock Bonus, Stock Split, Rights Issue, and Forthcoming Results. These events affect the stock price significantly. To track these events, we have released 5 new scans that will display a list of stocks with upcoming Corporate Actions in the next 15 days, with relevant details of the Corporate Action. The Scans will be displayed under Fundamental Scans. The new scans that are introduced are:
- Forthcoming Dividend
- Forthcoming Rights
- Forthcoming Bonus
- Forthcoming Split/Consolidation
- Forthcoming Results
Growth and Margin Ratios:
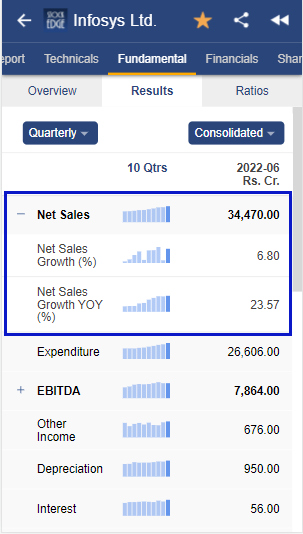
Users can enhance their fundamental research with Growth and Margin Ratios for parameters like Net Sales, EBITDA, PAT, and Net Profit for all periodic results. For each stock, under the Results sub-tab under the Fundamental Tab, Growth and Margin Ratios are calculated for different parameters for quarterly results, half-yearly results, and annual results.
Trending Stocks:
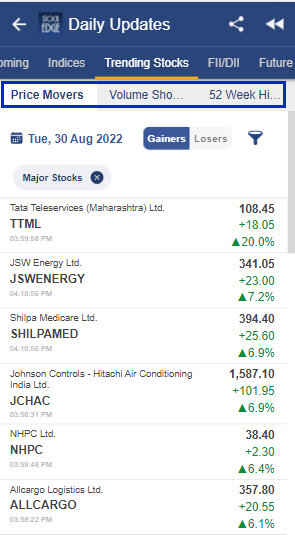
Trending Stocks is a new feature released in the Explore Section of StockEdge. Users can track market activity in no time and create their own Edge by analyzing Price Activity, Volume Activity, and Stocks hitting new 52 Week High and Low. In the Price Activity sub-tab, users will be able to see the gainers and losers compared to the previous trading day. Under Volume Shockers, users will get a list of those stocks whose traded volume is 1.5 times above the average of the last 5 days’ traded volume. Under the 52 Week High/Low tab, users will get a list of stocks that have created either a new 52 Week High stock list or a new 52 Week Low stock list.
This is it for now from Team StockEdge. We hope these features enhance your investment journey and make StockEdge more valuable to you.
If you enjoy using StockEdge, don’t hold back from sharing the platform with your near and dear ones.
Check out StockEdge’s Premium Plans to get the most out of it. Also, keep watching this space for our midweek and weekend editions of ‘Trending Stocks‘ and ‘Stock Insights‘.







Thanks for good information. This is good blog. I got good information from this blog.
This is good blog