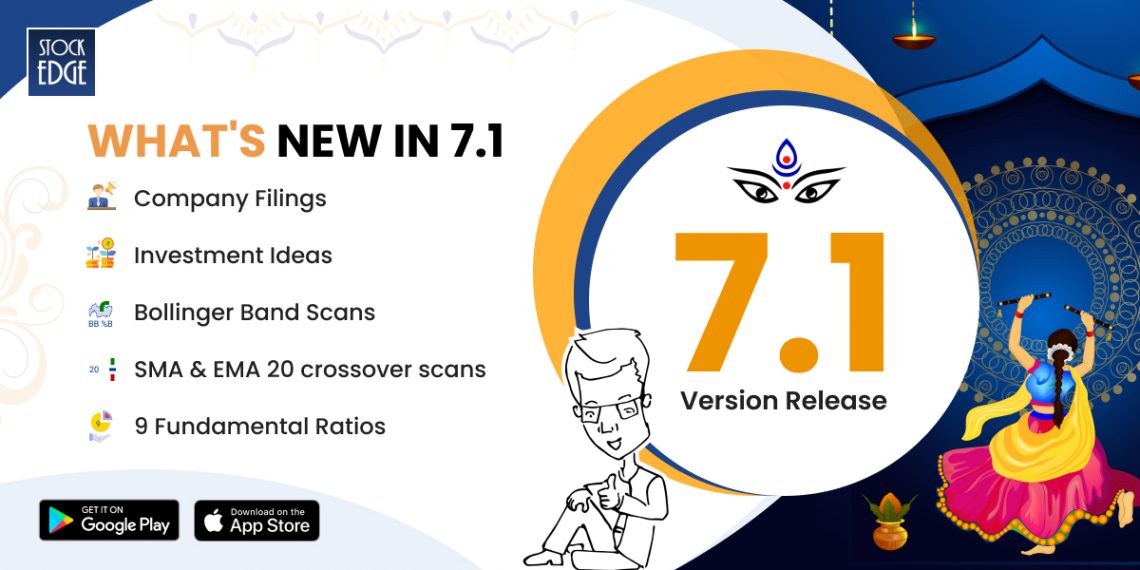
With the festive season being around the corner, StockEdge is elated to release the festive special version update, StockEdge Version 7.1. This version update brings with it valuable features that will benefit both, paid and free users.
Premium features of StockEdge Version 7.1 include:
- Company Filings
- Investment Ideas & Case Study Levels in Edge Charts
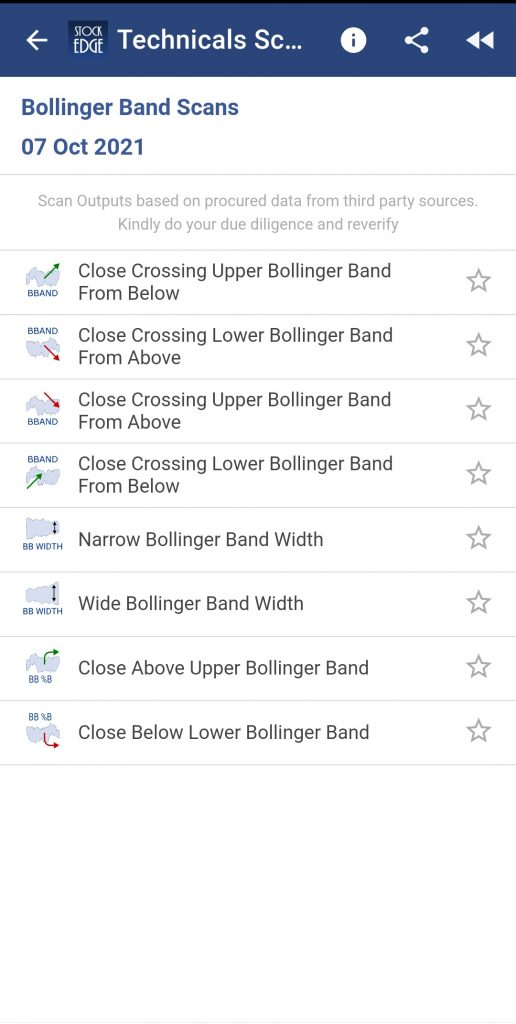
- 4 new Bollinger Band Scans
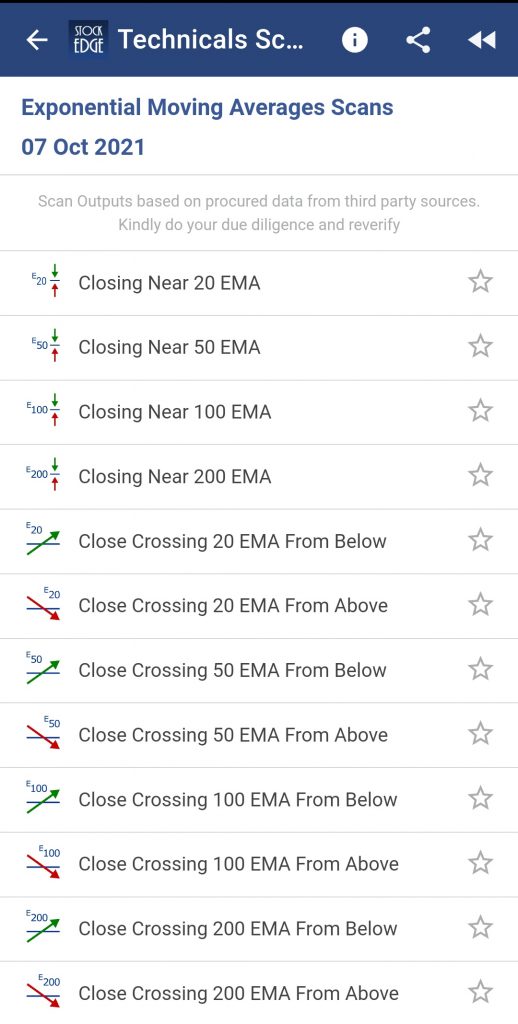
- 1 new EMA Scan
Free Features of StockEdge Version 7.1 include:
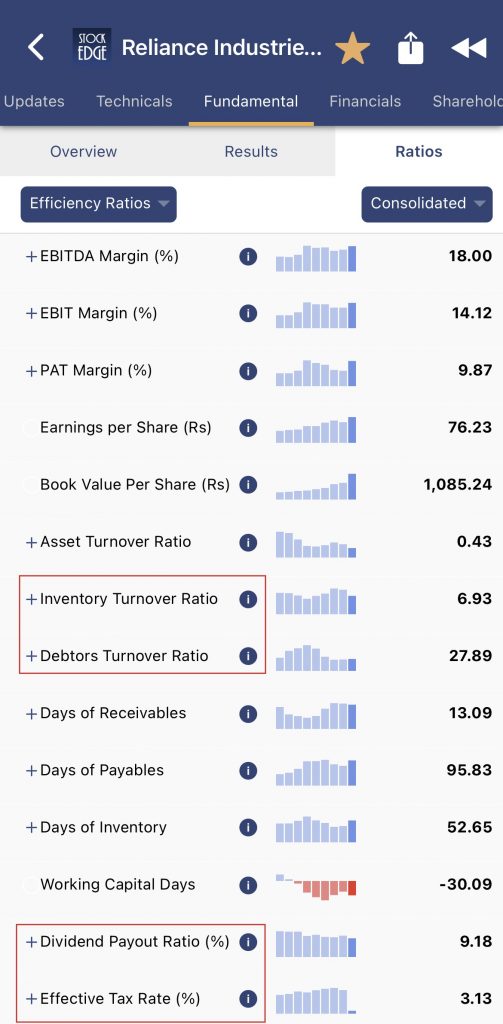
- 9 New Ratios
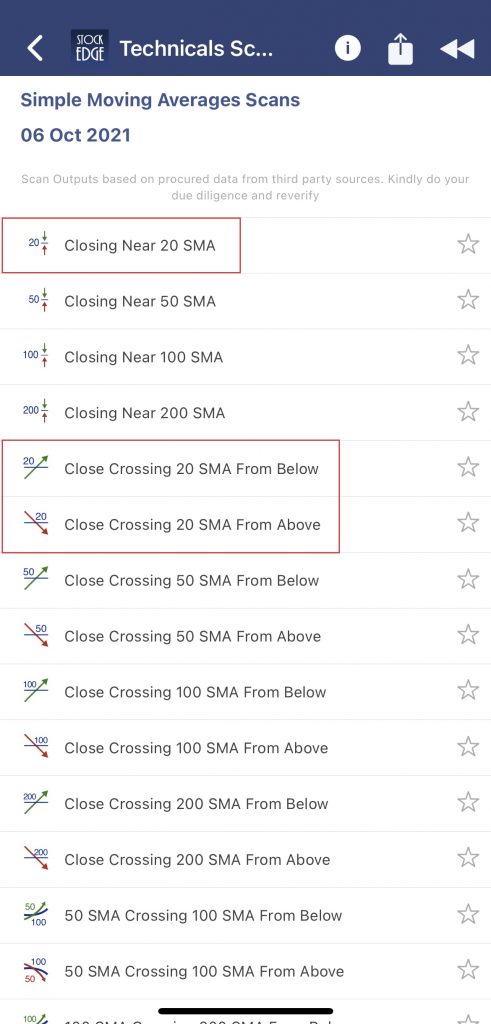
- 3 new SMA Scans
For a better understanding of the new features, continue reading below!
COMPANY FILINGS:
Company filings are updates and decisions taken by companies that are mandatorily reported to BSE & NSE. It keeps the investors updated with the latest happenings in the corporate world and enables them to make informed investment decisions. On a daily basis, there are thousands of company filings and corporate announcements that BSE & NSE receive. Some of them are significant announcements giving material information about a stock, while some are not so pertinent. Furthermore, the relevance and importance of different announcement categories are subjective and differ from user to user.
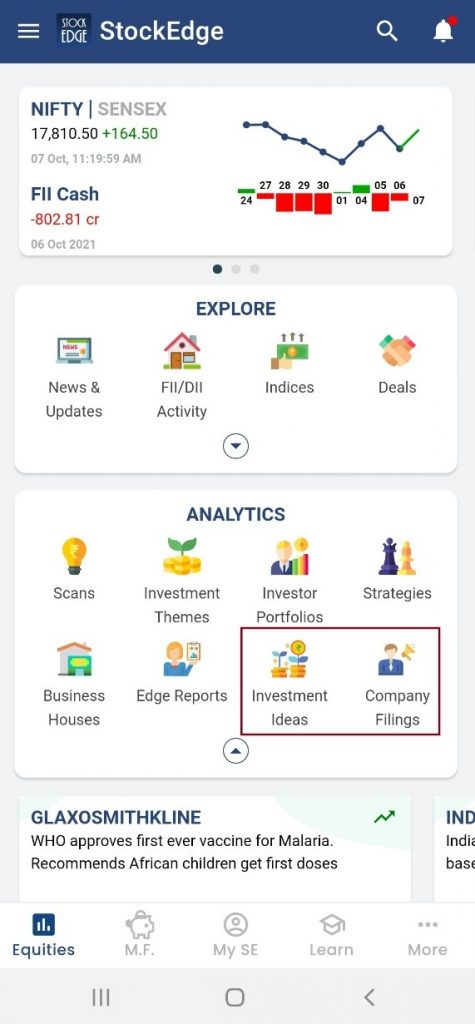
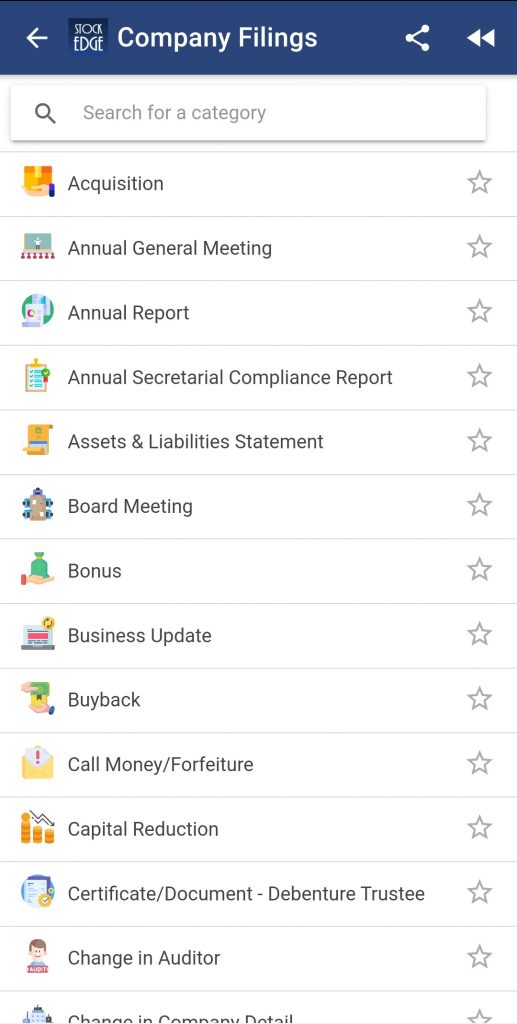
Keeping this in mind, StockEdge has released a new feature ‘Company Filings’, which segregates corporate announcements into different categories like Bonus, Buyback, Financial Results, Change in Key Personnel, etc. Each category will display a list of stocks that have made announcements falling within that category, the latest announcements being displayed first. With the implementation of this feature, users can easily access those announcements that are relevant to them without having to search from within a pool of multiple announcements. This will help investors and market participants to narrow down their stock research to what is actually relevant to them and will help them make decisions more efficiently.
To make it easier for the users, StockEdge is giving the users the option to make the corporate announcements they follow as favorites for easier tracking. This feature will be available in the ‘My StockEdge’ section.
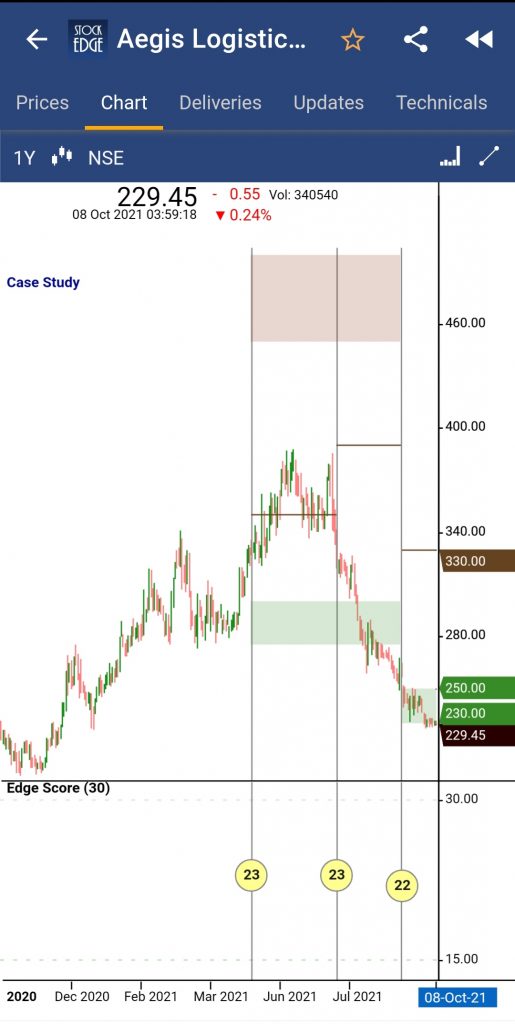
INVESTMENT IDEAS & CASE STUDY LEVELS IN EDGE CHARTS:
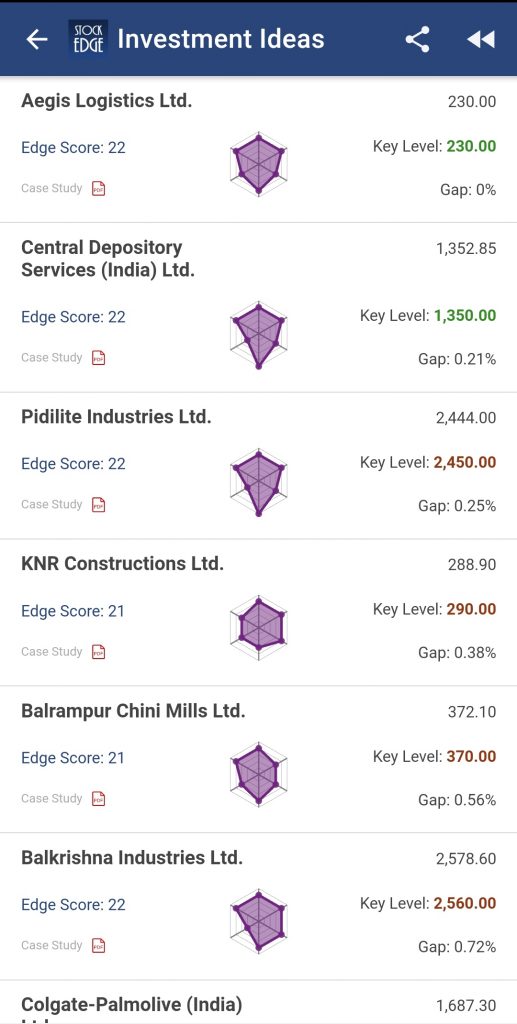
A Case Study is a well-crafted research report giving users a 360* view of a company and its financials. The objective of these reports is to give the users an understanding of the fundamental aspects of the stocks. To further enhance Case Study Analysis, a new feature ‘Investment Ideas’ has been released which presents a curated list of quality stocks that are trading near key levels.
Each of these stocks has a Case Study report prepared for it and it is accompanied by Case Study Levels which are displayed in the respective Edge Charts. Case Study levels refer to Upper Levels and Lower Levels of the stock. This feature gives the users an estimated price range for the stocks and helps them in making investment decisions. That being said, every user must carefully analyze all aspects of a stock before investing.
4 NEW BOLLINGER BAND SCANS:
Bollinger Band is a technical analysis tool that gives investors an opportunity to identify stocks that are overbought or oversold. It serves as a volatility indicator as well.
When the price of a stock is close to the Upper Band, it is considered to be an overbought stock, while when is close to the Lower Band, it is considered to be an oversold stock. Also, when the width between both bands widens, the stock is considered to be in a volatile position while when the width is narrow, the stock is considered to be in a stable position. Based on these interpretations, 4 new Bollinger Band Scans have been released. They are as follows:
- Narrow Bollinger Band Width: The Bollinger Band Width is narrow during a period of low volatility. It indicates that the price is moving sideways. Low volatility periods are subsequently followed by sharp movement in prices in either direction. Narrow Width generally indicates the beginning of a trend in either direction.
- Wide Bollinger Band Width: The Bollinger Band widens during a period of high volatility. It indicates that the price is close to either the Upper Bollinger Band or the Lower Bollinger Band. Periods of high volatility indicate that the on-going trend will come to an end soon and the price will eventually start moving sideways.
- Close Above Upper Bollinger Band: BB %B quantifies a security’s price relative to the Upper and Lower Bollinger Bands. When the closing price of the stock increases and crosses the Upper Bollinger Band and the value of BB %B is greater than 1, it indicates that the stock is overbought.
- Close Below Lower Bollinger Band: Similarly as the above point, when the closing price of the stock decreases and goes below the Lower Bollinger Band and the value of BB %B is less than 0, it indicates that the stock is sold.
To read more about Bollinger Bands, Click Here
1 NEW EMA SCAN:
Exponential Moving Average (EMA) is a popular Technical Analysis tool. It provides trading signals to market participants. EMA places more weight on recent prices and is sensitive to recent price changes. A new scan “ Close Near 20 EMA” has been released. The closing price of stocks that are within 1% of the 20 days EMA will be shown through this scan. This scan indicates that the current trend of the stock will hold up in the short term.
9 NEW FUNDAMENTAL RATIOS:
Ratio Analysis is an important tool used to analyze the financial position, liquidity, growth, valuation, etc., of a stock. It uses the 3 financial statements, i.e., Balance Sheet, Income Statement, and Cash Flow Statement. It helps not only to analyze companies individually but also helps to compare the fundamentals of different companies. Following are the new ratios being released:
- EV to EBIT Ratio
- Inventory Turnover Ratio
- Debtors Turnover Ratio
- Effective Tax rate (%)
- Dividend Payout Ratio (%)
- Interest Spread (%)
- Quick Ratio
- Total Debts to Assets
- Sales to Cash Flow Ratio
3 NEW SMA SCANS:
Simple Moving Average (SMA) is a popular Technical Analysis tool. It provides trading signals to market participants. SMA places equal weightage on all data points. The slope of the SMA indicates the trend that will continue in the market. A rising slope indicates a bullish run while a declining slope indicates a bearish run. Following are the new scans released related to SMA.
- Close Near 20 SMA
- Close Crossing 20 SMA From Below
- Close Crossing 20 SMA From Above
This is all about the festive version update 7.1. This update releases some fantastic features that will benefit all the users of StockEdge. That being said, market participants should do their own research from all aspects before entering into the markets.
If you have started minting money in the stock markets with the help of our StockEdge app, then do share it with your friends, family, and loved ones.
Also, keep watching this space for our midweek and weekend editions of ‘Trending Stocks‘ and ‘Stock Insights‘.







Helpful
I have new letest update version…
All these new features are for Premium Subscription only. Disappointed
Very nice 👍