Table of Contents
Whether you are a newbie or a seasoned investor, building a portfolio to generate wealth is not a choice but a necessity. In this blog, we will delve into the world of portfolios, and portfolio analytics, and guide you on how to effectively manage them yourself. To kickstart our discussion, let’s begin with the story of Rahul, an investor who faced common struggles in his investment endeavours.
Rahul began his investment journey with a small capital, investing in stocks for the long term. However, influenced by his colleagues, he ventured into swing trading. As he continued trading and investing in more stocks, complications arose.
Rahul faced difficulties in managing his stocks, which often resulted in impulsive decisions. One instance was when he sold an investment stock in a panic after it dropped by 7% in a single day. On the other hand, he held onto a trading position even after its stop loss was triggered, believing it had long-term potential. These challenges and a lack of discipline and portfolio organization caused confusion and hindered Rahul’s investment strategy.
Furthermore, he encountered difficulties in monitoring the performance of his stocks and lacked one comprehensive tool for real-time updates, alerts and analysis. As a result, he had to rely on conventional methods such as spreadsheets, which demanded daily manual updates, making the process tedious and time-consuming.
Rahul’s problem is common among retail investors, and you might have encountered similar issues. That’s why StockEdge is here to help with our latest offering: Portfolio Analytics. With this feature, you can seamlessly create multiple portfolios, analyze your investments, access advanced portfolio analytics, and manage your trading and investment positions. But before we delve into today’s blog and introduce you to Portfolio Analytics, let’s ensure we clearly understand what a portfolio is and why it’s necessary. Knowing about portfolios and using portfolio analytics would have helped Rahul stick to his market discipline and get insights for taking logical actions.
Let’s begin!
What is the meaning of a Portfolio in the stock market?
In the stock market, a portfolio is a collection of investments. It’s like a basket consisting of various stocks, bonds, and other financial assets. A portfolio helps to spread the risk. For example, if one stock does not perform, others may compensate. Hence, creating a portfolio is of utmost importance for an investor to achieve its financial goals.
Why do you need a portfolio? What are its benefits?
As a famous investment guru, Mr. Warren Buffett said, “ Do not put all your eggs in one basket”, which means that diversification is a key component to spread your risk.
Hence, the main purpose of creating a portfolio is to diversify your investment & spread your risk. Holding a handful of stocks across different sectors can help you balance out the risk. Allocating investments strategically across various asset classes enables you to withstand different market conditions.
There are several benefits of having a portfolio. They are as follows:
- Diversification: As discussed earlier, a portfolio helps spread your risk by investing in different stocks & other assets.
- Risk management: Holding a diversified portfolio reduces the impact of underperforming stocks.
- Potential for higher returns: You can increase the potential to earn higher returns with the right asset allocation.
- Passive income generation: Some stocks pay dividends, providing a regular income source.
- Wealth creation: A portfolio consisting of various asset classes can create long-term wealth through compounding & capital appreciation over time.
Investing and Trading Portfolio
One of the common mistakes which retail market participants like Rahul make is that they fail to segregate their market participation into separate portfolios for investing and trading. You must have a clear objective, a proper strategy, and a reason why you are taking a particular action in the market. Maintaining separate portfolios for your trading and investment will help you have a disciplined approach towards the market. Apart from having only equity stocks in your Portfolio, there are many other components to a portfolio that we are going to discuss next.
Different asset classes a Portfolio can comprise:
An investment portfolio includes various financial instruments like stocks, bonds, mutual funds, and real estate (REITs). Some portfolios may include commodities like gold, silver and cryptocurrencies like Bitcoin. This diversification across different asset classes helps minimize risk and increases the potential to earn high returns.
- Equity Portfolio: This is basically a portfolio of equity stocks of several large, mid or small-cap companies. You may even diversify the collection of stocks across several sectors for more diversification of your investments. You can even organize your stock portfolio into two categories, such as Investment Portfolio & Trading Portfolio. Segregating your portfolios for different purposes will keep you organized and disciplined in your financial goals.
You can check out the Investor Portfolio section in StockEdge, to find out the holdings of famous investors in the market.
- Bond Portfolio: Bonds or Debentures are fixed-income securities which come under a separate asset class. These are debt instruments which are considered to be less risky than equity stocks. An effective allocation of high & low-risk investments in a portfolio is essential for risk management.
- Mutual Fund Portfolio: Mutual funds are a great option if you don’t have much time to actively invest. They allow you to invest indirectly in different types of assets. Equity-based mutual funds come in various categories based on market capitalization. Also, you have the options to invest in debt mutual funds as well as balance or hybrid mutual funds, which is a combination of investing in both equity & debt instruments.
We have a separate section to analyze mutual funds in StockEdge. Get ready-made mutual fund portfolios under Mutual Fund Investment Themes based on your risk reward.
- Real Estate & Other asset classes: Investing in physical properties demands significant investments and expertise. Also, it is sometimes hard to liquidate. However, in this blog, we focus on REITs, which are commonly traded in the stock exchanges providing you with liquidity & the advantages of investing in commercial properties without requiring large sums of money. Additionally, commodities like gold and silver can serve as effective portfolio hedges. Investing in cryptocurrencies like Bitcoin offers an opportunity for further diversification.
What is the ideal asset allocation of an investment portfolio?
The truth is there is no concrete answer to this question because every individual has different financial goals & risk appetite. However, in general, equity is considered to be a risky asset class compared to debt. So, if you are a risk-averse investor, you must consider more debt allocation in your portfolio rather than equity. On the other hand, if your risk tolerance is high, the majority of your portfolio should consist more of equity and less of debt.
Your age is another factor you can consider while deciding the equity and debt mix. The 100 minus age rule is a well-established principle for determining debt and equity allocation in your investment portfolio. This rule suggests that the percentage of equity in your portfolio should be equal to the difference between 100 and your age.
Let us understand this with the help of an example.
Suppose your current age is 25 years. Applying the 100 minus age rule, we have 100 – 25 = 75. This means that 75% of your investments should be allocated to equity, while the remaining 25% should be allocated to debt.
This example demonstrates the underlying principle of the rule: as age decreases, an individual generally has a higher risk tolerance and is better equipped to handle market fluctuations. However, as individuals grow older, their risk tolerance tends to decrease, and the need for more immediate access to funds becomes crucial. In such cases, investing in fixed-income securities that offer stable returns is advisable.
The 100 minus age rule provides a straightforward and practical approach to determining an appropriate debt-to-equity mix in an investment portfolio, taking into account factors such as age, risk tolerance, and investment time horizon.
Now that you constructed your portfolio, you must keep track of your investments from time to time; that is where Portfolio Management comes in. As markets are dynamic, you must keep your portfolio up to date with the changing market conditions with the help of Portfolio-Reconstruction & Portfolio-Rebalancing.
So, let’s understand what these terminologies are one by one!
What is Portfolio Management?
Portfolio management is the process of effectively managing and overseeing your investments. It involves making smart decisions about where to put your money and how to balance your investments to achieve the desired financial goals based on your risk tolerance.
The primary goal of portfolio management, including portfolio reconstruction and rebalancing, is to optimize risk-adjusted returns. By diversifying investments across various asset classes, the aim is to reduce risk and enhance potential returns.
One crucial aspect of portfolio management is portfolio reconstruction. This process involves periodically reviewing and adjusting the composition of the portfolio to reflect changing market conditions, investment objectives, and risk appetite. By analyzing the performance of different investments and market trends, you can determine whether certain assets should be added, reduced, or eliminated from the portfolio. This helps to ensure that the portfolio remains in line with the desired investment strategy and goals.
Re-constructing & Re-balancing your portfolio
Rebalancing is another key component of portfolio management. Over time, the value of different investments within a portfolio may shift, altering the original asset allocation. Rebalancing involves realigning the portfolio by buying or selling assets to restore the desired asset allocation. For example, if a particular asset class has performed well and its weightage has increased beyond the target, the portfolio may need to be rebalanced by selling some of the assets and investing in other areas to maintain the desired balance.
So, now that you know the importance of portfolio reconstruction & portfolio rebalancing. You might have a question:
How often should you reconstruct or rebalance?
Ideally, you should reconstruct your portfolio whenever there is a change in your financial goal or your risk appetite. For example, as you grow older, your risk-tolerance level may reduce, so you can reconstruct your asset allocation accordingly. But in the case of rebalancing, it is completely dependent on the change in the price of the financial instruments in your portfolio.
Hence, effective portfolio reconstruction and disciplined rebalancing can increase the chances of achieving your financial objectives.
Analyze & manage your portfolio efficiently with StockEdge
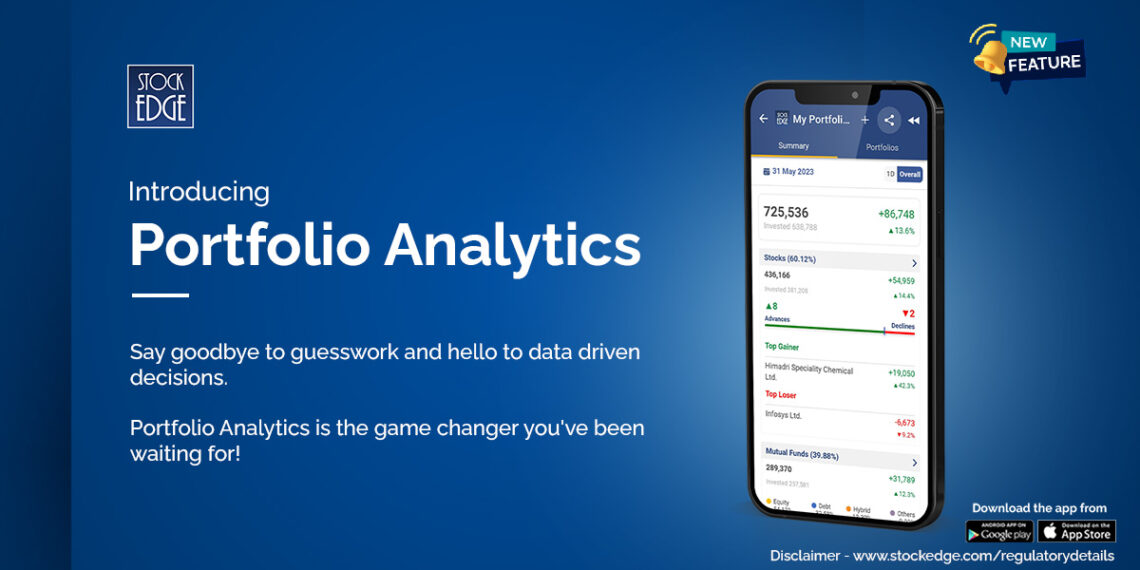
Here we introduce you to our latest feature release: Portfolio Analytics.
In the rapidly changing world, data-driven insights have become crucial for making well-informed decisions. Portfolio Analytics offers a powerful solution that provides you with a user-friendly tool for analyzing and optimizing your portfolios like never before. StockEdge empowers retail investors like you by providing comprehensive information and resources to make smarter investment choices.
Traditional methods, like spreadsheets and manual calculations, struggle to keep up with the fast-moving dynamics of markets.
The Power of Data in Portfolio Analytics
Traditional use of spreadsheets and manual calculations struggles to keep up with the fast-moving dynamics of markets. Today “Data” is everything. By harnessing the power of data analytics, the Portfolio Analytics feature allows you to gain deep insights into your portfolios’ performance, risk metrics, and allocation strategies. With access to comprehensive data sets, historical trends, and real-time market information, you can make data-driven decisions.
Steps to do Portfolio Analytics in StockEdge
Let’s dive deep into this feature with step-by-step guidance.
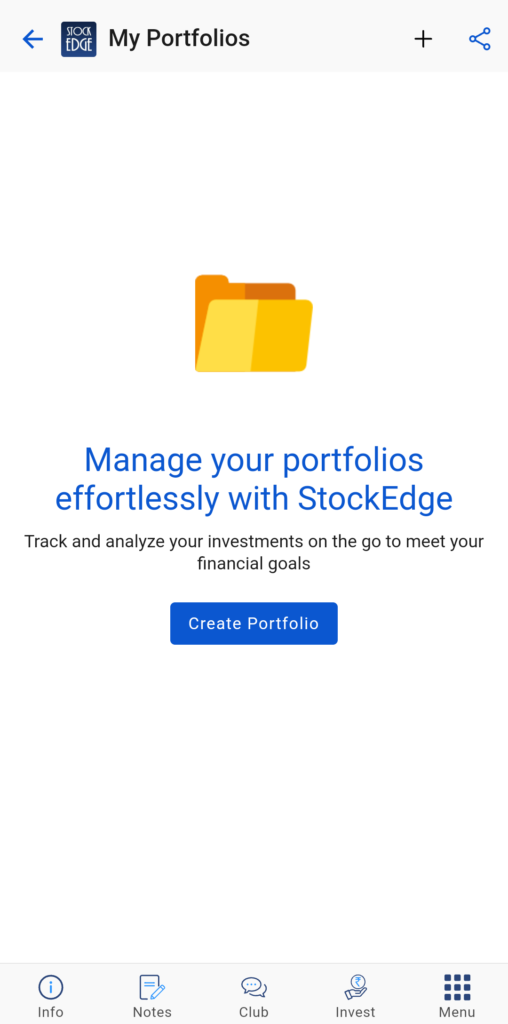
The first step is to add the details of your existing portfolio on the StockEdge App for further analysis. To do that, go to the My StockEdge section, wherein you will find an icon of My Portfolios.
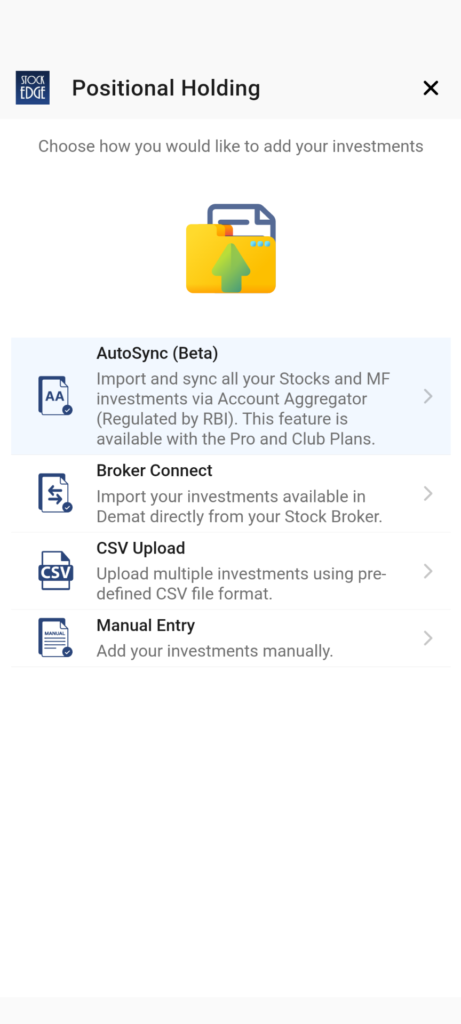
Click on My Portfolios, and you will be redirected to your portfolio section, where you can add your portfolios in four different ways.
- Auto Sync
- Broker Connect
- CSV Upload
- Manual Entry
Click on “Create Portfolios” and name your desired portfolio. Choose the appropriate method for adding your respective portfolio.
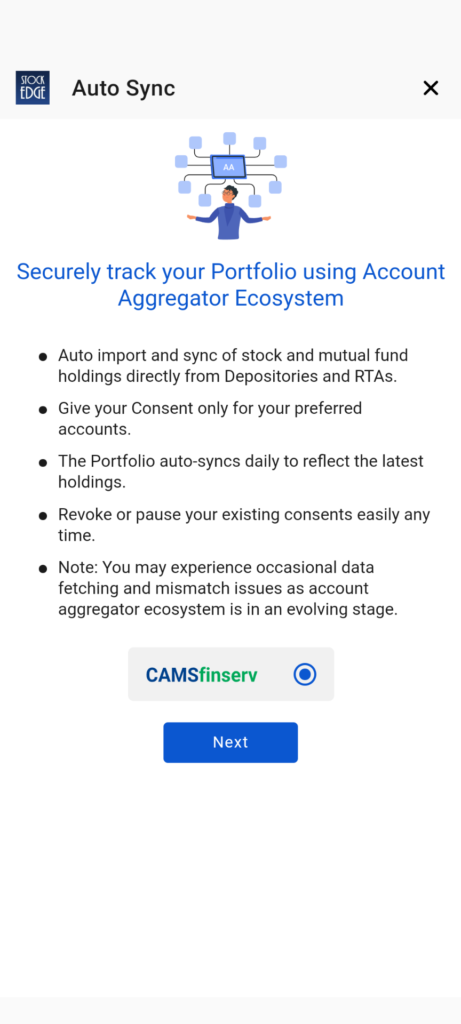
First, let’s understand how to add your investments via Auto Sync. It is one of the easiest and simple way to add your portfolio as its import stocks, mutual funds holdings directly from the depositaries and RTAs. Just provide your consent for your account to reflect the latest holdings. Do not worry, you can revoke or pause your consent any time you like.
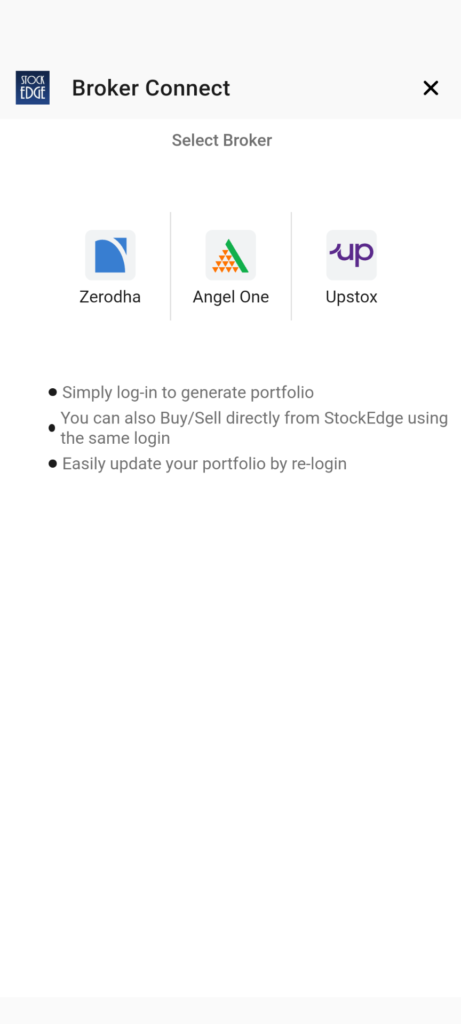
Next, let’s explore the second method to add stocks to your portfolio. That is Broker Connect. As of now we have partnered with a handful of brokers through which you can fetch your stocks in StockEdge for efficient and effective tracking. Simply click on your broker list and follow the necessary steps. In addition to this, you can even buy or sell stocks directly from StockEdge.
The third most convenient way to add stocks and mutual funds to you portfolio by uploading CSV file. Please note, there is a particular format in which you are required to upload the CSV file. You can download the appropriate format from the CSV upload window. It will be downloaded by the name PortfolioImportTemplate.csv
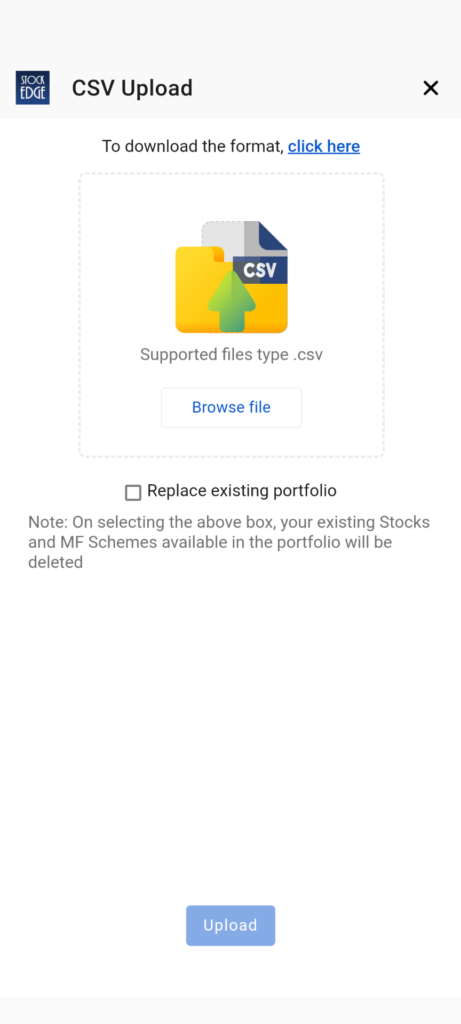
A sample portfolio details are provided in the sheet. Next, you need to enter the following details:
- Instrument Type- Stock/MF
- ISIN/NSE Symbol/BSE Scrip Code
- Qty or Unit
- Avg. Price or NAV
Finally, save the file and upload it. Your portfolio will be fetched from the file and uploaded for your further analysis.
Lastly, you can simply make manual entries directly from the StockEdge app. Yes, it can be time consuming if you have long list of stocks or mutual funds, but sometimes its easy to go through a good old way.
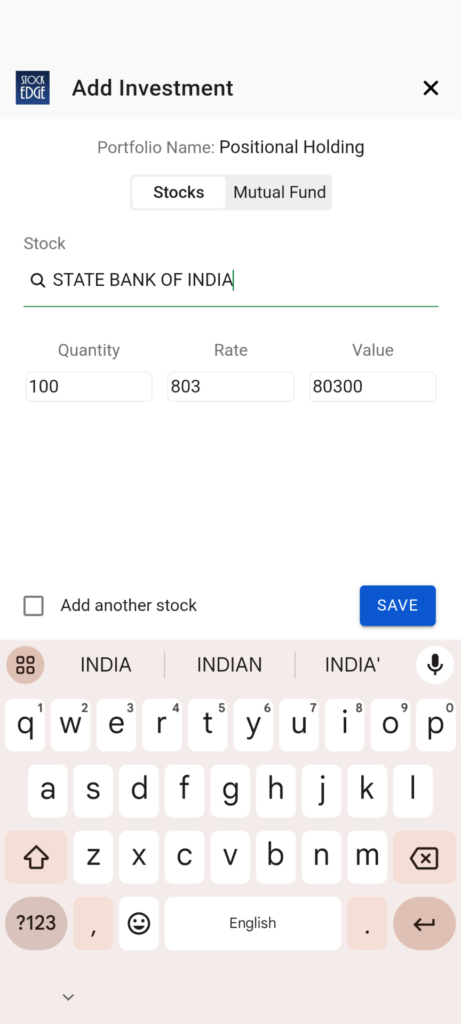
- Enter the stock name.
- LTP of that stock will be fetched automatically, but you may put your average buying price as your choice.
- Enter the two parameters out of the three: Quantity, Rate, and Value, and the third will be fetched automatically.
- Then click on the label ‘Add another stock’, click on save and repeat steps 1 > 3 > 4 till the time your entire portfolio is added.
Similarly, you can add mutual funds to your portfolio. Infarct, you can add or sell the quantity of stocks in your portfolio as per your timely requirement.
So, now that you have completed adding your portfolio, you will be greeted with two different tabs under the “My Portfolios” section on StockEdge.
- Summary
- Portfolios
Portfolio Summary at a Glance
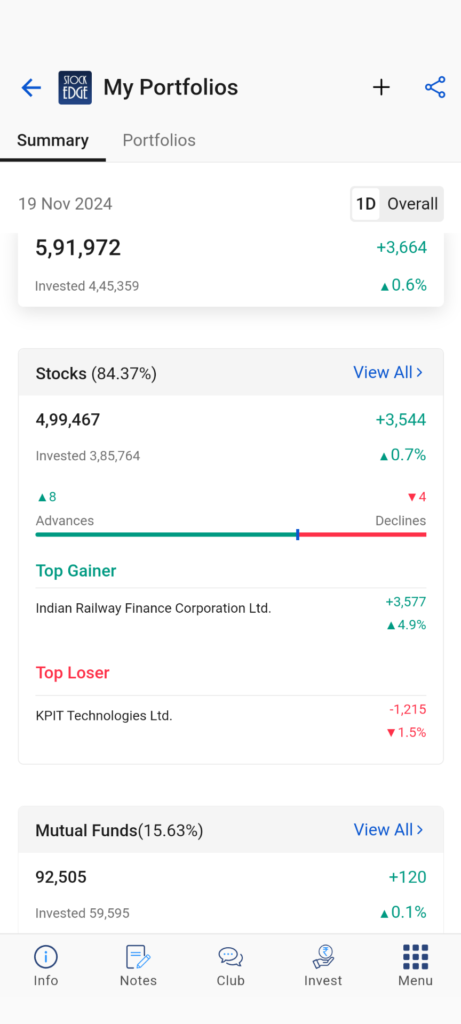
In the Summary section, a summarized view of your entire portfolio in terms of investment value and current value will be displayed in the form of a widget, along with the bifurcation of your portfolios into Stocks and Mutual Funds.
By clicking on the stocks or the mutual fund widget, it will take you inside the section of your summarized portfolios, wherein you will find the following details of your portfolio:
- Stock
- Mutual Funds
Create multiple Portfolios: How to manage, edit or delete portfolios?
Yes, that’s right, you can create multiple portfolios for both stock and mutual funds. For example, you may have a list of stocks which you are going to hold for the long term. That becomes your “Investment Portfolio.”
Similarly, you may have a list of stocks that are for swing or positional-based trading for the short term. That essentially becomes your “Trading Portfolio.”
This way, you can have multiple portfolios for both stocks and mutual funds.
You can edit or delete individual stocks or mutual funds, even the entire portfolio, as you move forward in managing your portfolio.
Analyze each Portfolio & Stay Updated
To analyze a portfolio, click on the desired portfolio from the list if you have more than one portfolio.
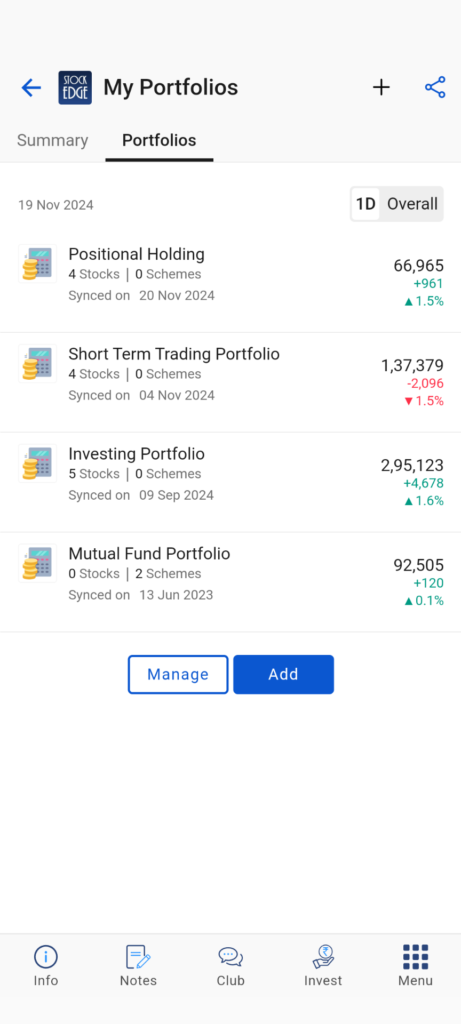
Or you are in the Summary Section, just click on the stocks widget to view the list of all the stocks in all the portfolios (in case you have > 1)
It also shows the invested quantity, cost price, invested amount, 1-month price sparkline, LTP, the current value of the investment, respectively, overall and 1 Day change & percentage change.
Similarly, for mutual funds, you will find the list of all mutual fund investments scheme-wise, AMC-wise, and class-wise in all your portfolios with invested units, cost NAV, invested amount, latest NAV, the current value of investment respectively, overall and 1 Day change & percentage change.
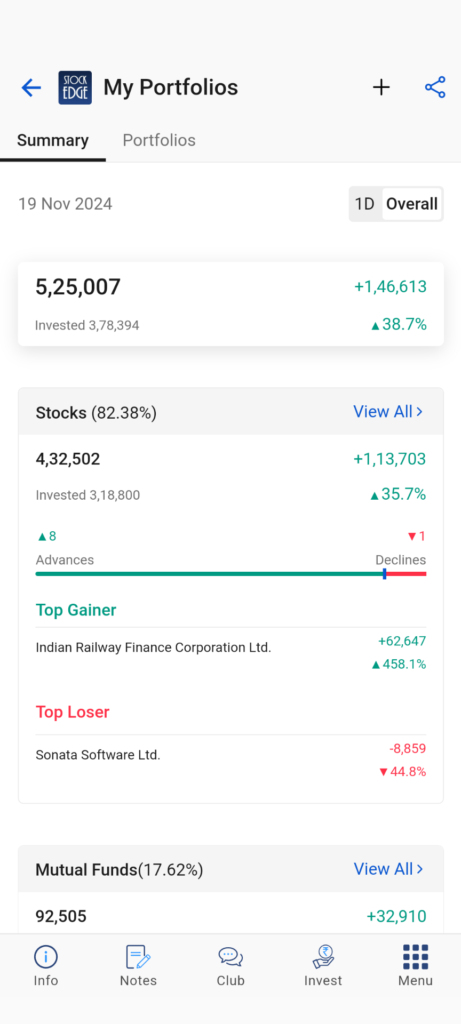
Going forward, you will find a host of different tabs for your portfolio analysis. Let’s take a quick look at each of the tabs:
1. Sector Allocation
Here you will get the sector-wise allocation of your investment in stocks and Mutual funds in a pie chart format for a holistic understanding of your exposure to different sectors. Sector-wise percentage holding, current value, overall and 1 Day change & percentage change are also provided.
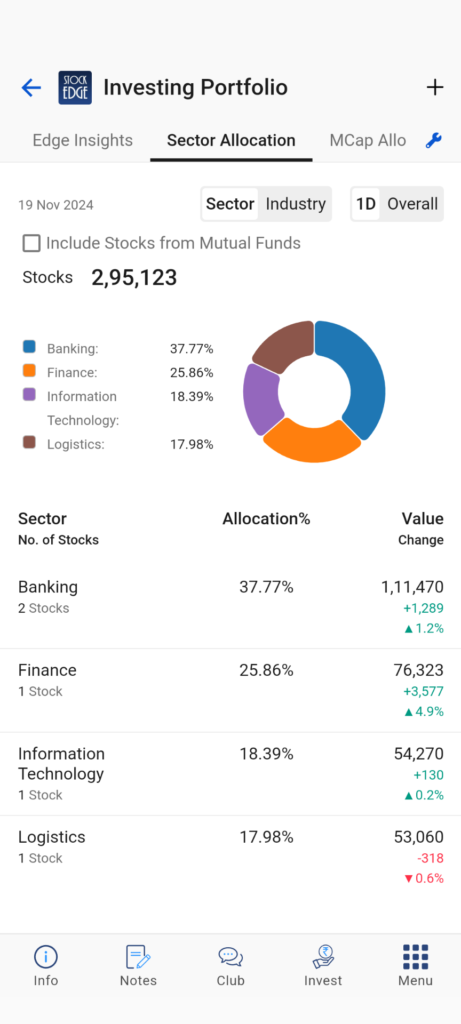
2. Mcap Allocation
Here you will get the market cap-wise allocation of your investment in stocks and Mutual funds in a pie chart format for a holistic understanding of your exposure to different market value-based stocks based on Large Cap, Mid Cap & Small Cap. Market Cap wise Investments, current value, overall and 1 Day change & percentage change are also provided.
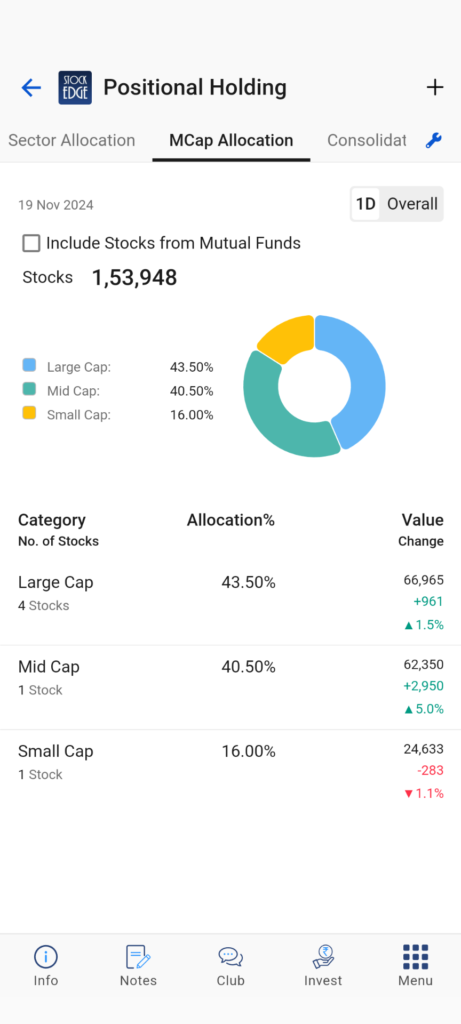
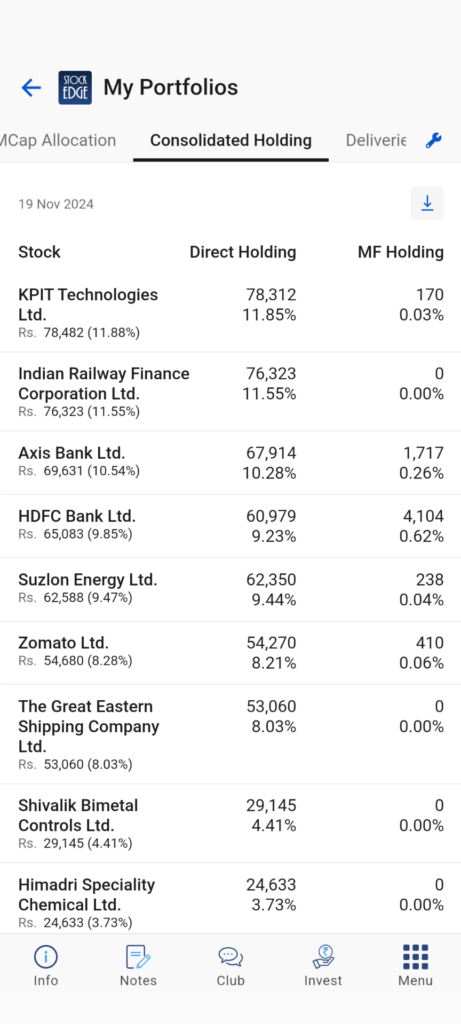
3. Consolidated Holding
A combined list of stocks accumulated from your direct stock investments or indirect mutual fund investments with their respective current value and holding percentage is also provided for your analysis.
4. Deliveries
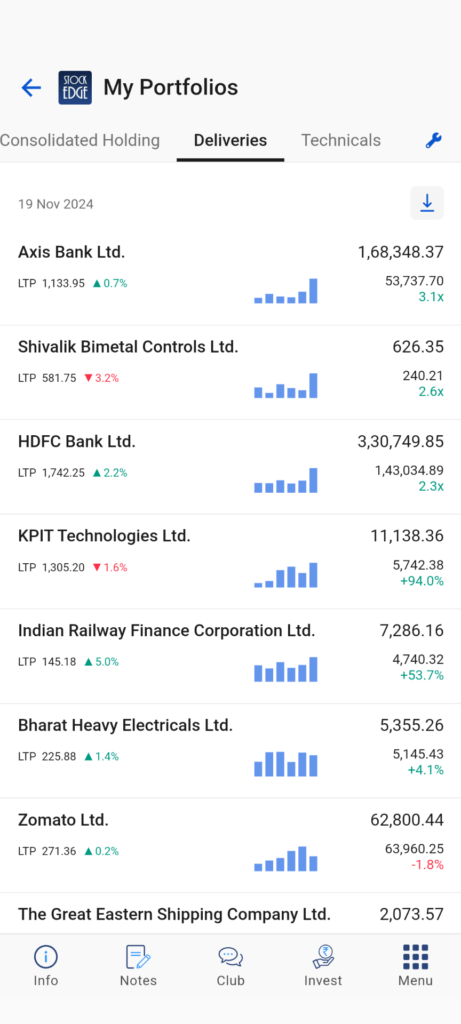
Analyzing the delivery data of stocks in your portfolio can provide valuable insights into your investment strategy and the market behaviour of the stocks you own.
- Stocks with High and increasing delivery values indicate strong and increasing of market participants in those stocks.
- Track changing delivery trends in your portfolio stocks and identify stocks in momentum
- Also, track and compare the delivery trends of stocks in your portfolio with overall market trends for better investment decisions.
- Compare the delivery data with the price movement of the stocks in your portfolio. High delivery percentages during an uptrend might indicate strong bullish sentiment, while high delivery percentages during a downtrend could be a sign of selling pressure.
- Examine any news or events related to the stocks in your portfolio. Major announcements, earnings reports, or market-moving news can impact delivery value. High and increasing delivery value following positive news could be a bullish sign, while high delivery percentages after negative news may indicate bearish sentiment.
- Assess the diversification of your portfolio. A well-diversified portfolio may have stocks with varying delivery percentages. A concentration of high-delivery stocks might indicate a particular focus or sector preference in your portfolio.
5.Scans
In this section, you will have a list of technical & fundamental scans that are qualified for your portfolio of stock on a particular trading day.
6. Chart Patterns
Chart patterns are powerful when they are formed, it gives you an indication of the future price movements of a stock. This section shows the list of chart patterns that are formed in your portfolio of stocks.
7. Edge Reports
No need to search for edge reports for each stock in your portfolio. A curated list of all the edge reports catering to your respective portfolio stocks is available in this section.
8. News & Announcements
Find the latest news catering to all your portfolio stocks here & any recent announcements which were made to exchanges will give you quick updates about your portfolio stocks.
9. Corporate Actions, Results & Deals
Keep track of all the forthcoming corporate actions, the company’s result announcements or any block/bulk deal in your portfolio of stocks. Always stay ahead with the latest updates.
Now that you have understood our Portfolio Analytics feature, what are you waiting for? Just click here and start adding and analyzing your portfolios effortlessly.
But wait before you jump in; one last thing you need to learn is to measure the performance of your portfolio. But how to measure the performance? Well, there are a few simple ways you can measure the performance.
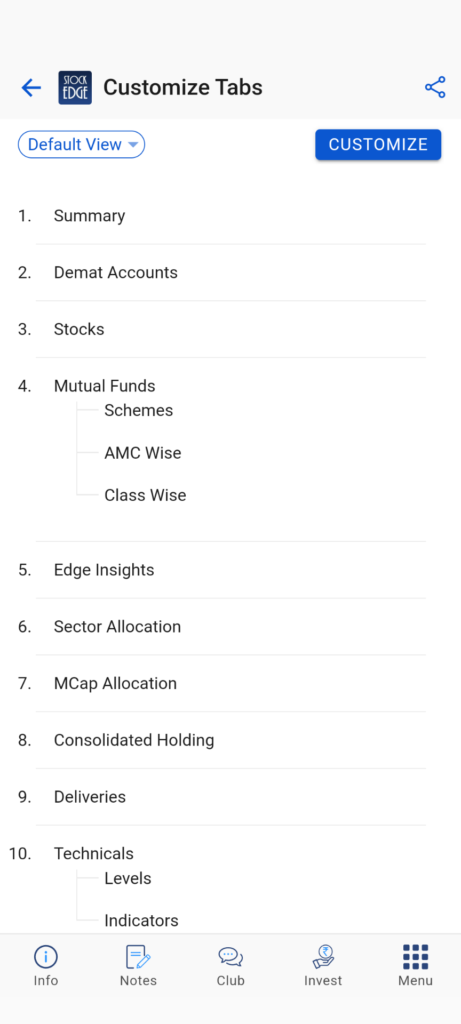
Tab Customization
The portfolio section also allows all our users to arrange and customize their portfolio section by rearranging and viewing the tabs as per their personal preference and investing /trading style. All the investors and traders can customize, hide, and rearrange the sequencing of tabs as per their convenience and ease of use. The ease of using the Portfolio section increases effectively with the personalized customization enhancement. For example, an investor can prioritize only the tabs showing information useful for them and hide the tabs that they don’t wish to track.
Measuring the Performance of Your Portfolio
To effectively measure your portfolio’s performance, it’s crucial to have a deep understanding of the stocks within it. For instance, if your investment portfolio primarily consists of well-established, large-cap stocks, you can compare its return to the benchmark index like the Nifty 50. However, if a significant portion of your portfolio comprises mid-cap stocks or stocks from a specific sector, it’s important to compare the return to the mid-cap index or the corresponding sectoral index, respectively. By doing so, you can gain valuable insights into how your portfolio is performing in relation to relevant market conditions.
But what if you have multiple asset classes in your portfolio? Then comparing the performance with only the benchmark index is not enough because your portfolio consists of not only stocks but also fixed-income securities, gold, and other assets. A simple way to measure such a portfolio is to compare it with the inflation index. For example, if the current inflation rate is 5% and your portfolio has given a return of 15% in a year, which means your portfolio has grown by 10% in a year.
So, start constructing your portfolio today and analyze it with advanced portfolio analytics features on StocKEdge.
You can watch our video on Portfolio Analytics by Mr. Vivek Bajaj
Conclusion
After giving you a detailed walkthrough, we are confident that the Portfolio Analytics feature will empower you at every level to make informed decisions, optimize performance, and navigate the complexities of the financial markets with confidence.
If you enjoy using StockEdge, don’t hold back from sharing the platform with your near and dear ones. Happy investing with StockEdge!


