Table of Contents
Good news! We are happy to announce that StockEdge has released version 3.4. In this version, StockEdge has brought many new features for the free users as well as for premium members. In this article let us discuss the new features in brief:
Additions in Free Version
In the 3.4 version of StockEdge, many new and useful features have been added which will help us in the better tracking of stocks.
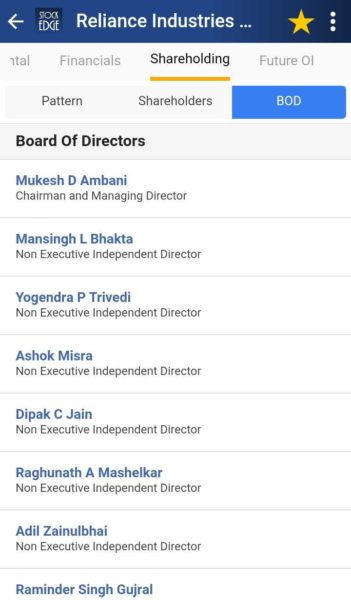
Board of Directors
Before investing in any stock, we need to look who is captain of the company, that is who runs the company. Therefore it is important for us to know who is on the board of directors of the company and read about them. We need to also find out their background and how long they have spent with the company. Frequent changes in the top management, inexperienced top managers may be poor indicators while picking the right stock. Therefore in this updated version of StockEdge we can get a complete list of board of Directors of any company listed in NSE or BSE in the shareholdings tab.
New scans in RSI
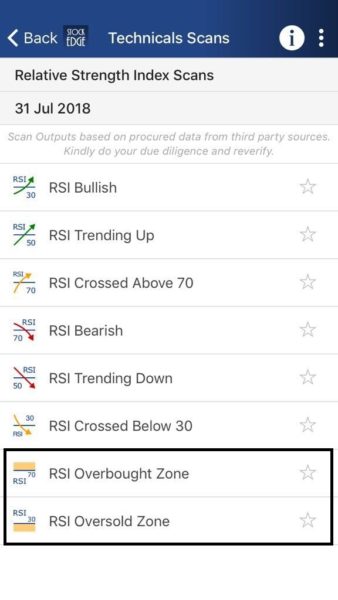
Two new scans of RSI are added. They are “RSI Overbought zone” and “RSI Oversold Zone”. Both these levels of 70 overbought and 30 oversold zones are important while analyzing stock through RSI indicator. The overbought region refers to when the RSI oscillator has moved into a region of significant buying pressure relative to the recent past and is often an indication that an upward trend is about to end. Similarly, the oversold region refers to the lower part of the momentum oscillator where there is a significant amount of selling pressure relative to the recent past and is indicative of an end to a down swing.
New scans in CCI
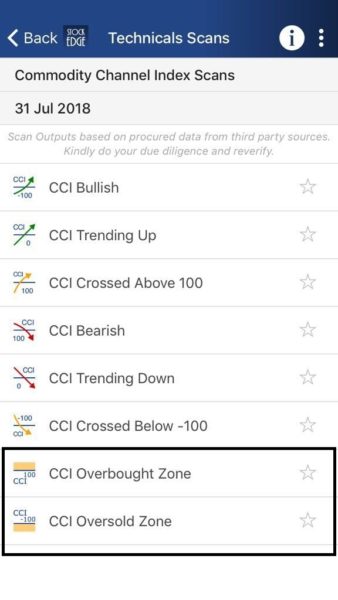
Similarly “overbought” and “oversold” scans are added in CCI. In the case of CCI, the price of the security is overbought when the indicator reads over +100. This means that price has risen so fast that it has deviated from the average price much more than normal and there is a possibility that prices are going to fall. When the CCI reads below -100, then the price is said to be oversold. It has sold off to the point that it has dropped well below the normal deviation from the average and possibility of prices going up. As discussed CCI overbought and oversold are important technical indicators.
Bollinger Band & Parabolic SAR in Technical Levels
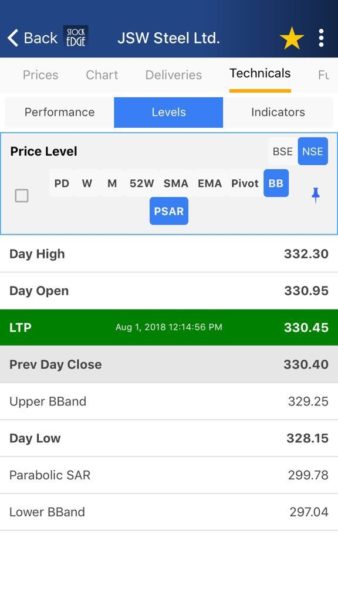
When we look at the technical levels of any stock, we should also look at the Bollinger Band and Parabolic SAR levels. We can get levels of these two indicators in the new version of StockEdge. From the image below, we can see the levels of Upper and Lower Bollinger band and also the levels of Parabolic SAR.
Stochastic in Technical Indicators
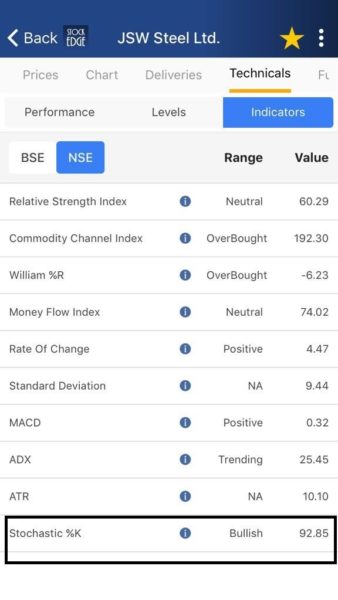
Stochastic is an important technical indicator which compares where a security’s price closes over a selected number of periods. The most commonly 14 periods stochastic is used. The stochastic indicator always moves between zero and hundred, hence it is also known as the stochastic oscillator. The value of stochastic oscillator near to zero signifies that today’s close is near to lowest price security traded over a selected period and similarly value of stochastic oscillator near to hundred signifies that today’s close is near to highest price security traded over a selected period. Now we can find this in the version 3.4 of StockEdge.
Additions in Premium Offerings:
Above we have discussed the new features of StockEdge 3.4 version for free users. Now let us discuss the new features of the paid version of StockEdge version 3.4:-
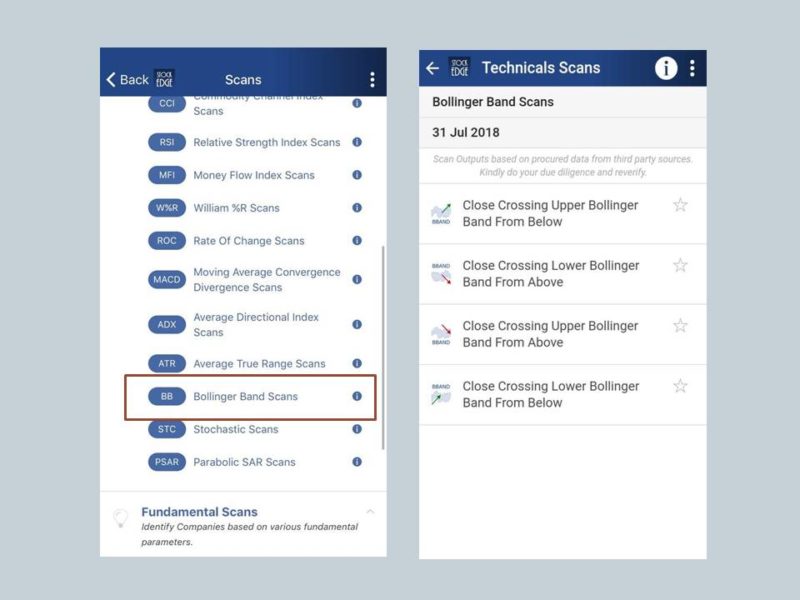
Bollinger Bands Scans
Bollinger Bands are volatility bands which are placed above and below the moving average. These bands automatically widen when volatility increases and thickens as volatility decreases. As this is an important indicator to check how much volatility is in there in the price movement, StockEdge has added this scan in their new version. We can see from the image below there are four scans under this indicator.
Stochastic Scans
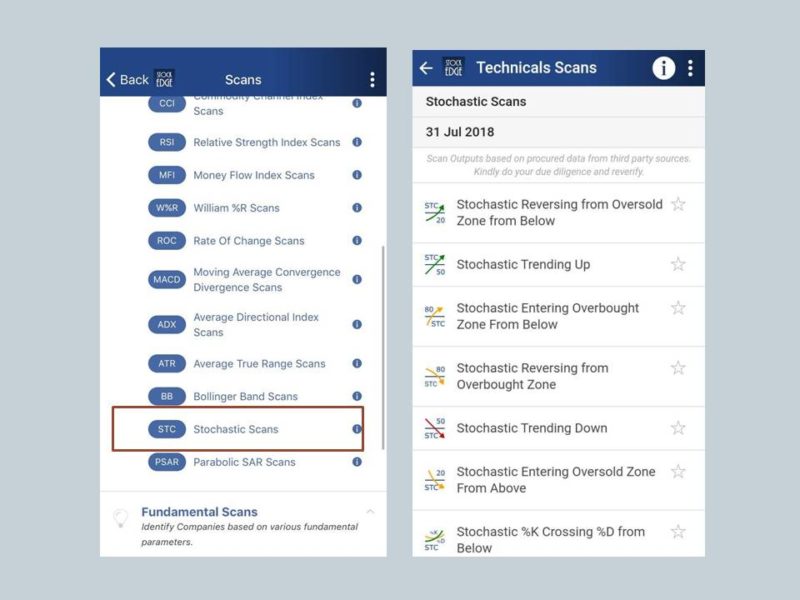
We have discussed above what stochastic indicator is all about. For the premium users, StockEdge has bought ten new scans of stochastic in their updated version 3.4 under the technical scan section. These scans will help us to filter out the stocks in a better way. From the image below we can see scans of different conditions of Stochastic.
Parabolic SAR Scans
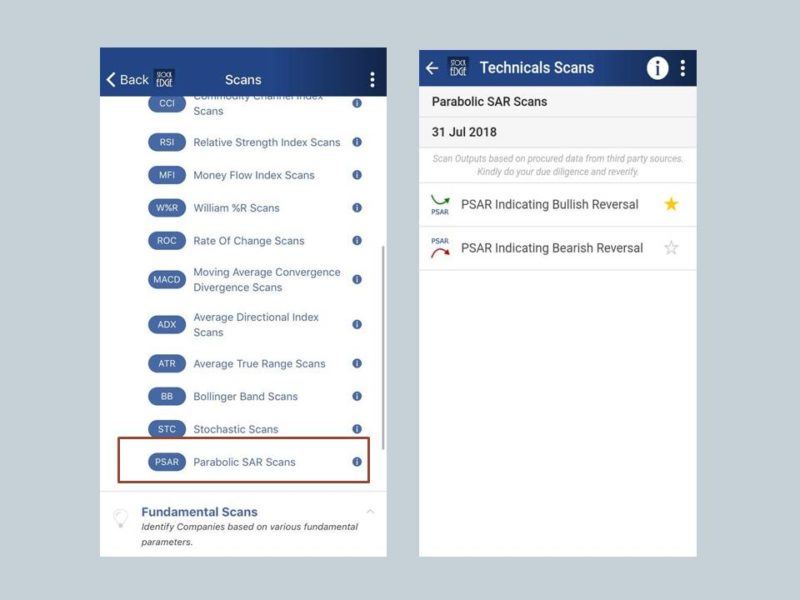
Parabolic SAR is a technical indicator which is used to determine the price direction of a stock as well as draw attention when the price direction is changing. This indicator appears as a series of dots either placed above or below the price. If it is placed below the price then it is a bullish signal, and when it is placed above the price then it is a bearish signal. This indicator is important as it is used to gauge stock’s directions. This indicator is now available for the premium users in the updated version of StockEdge.
Normal Price Chart
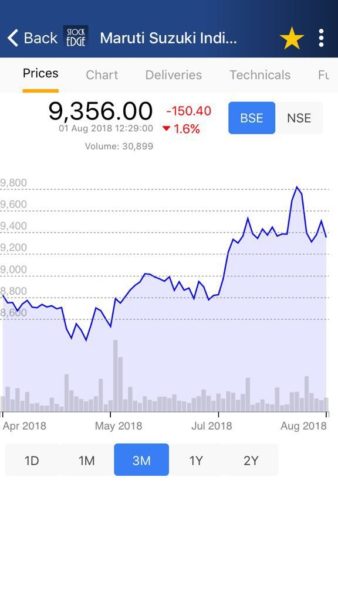
The basic price chart is now available for the premium users along with the Advanced chart. Users who prefer a simple chart and are not comfortable in using technical indicators can easily use this price chart.
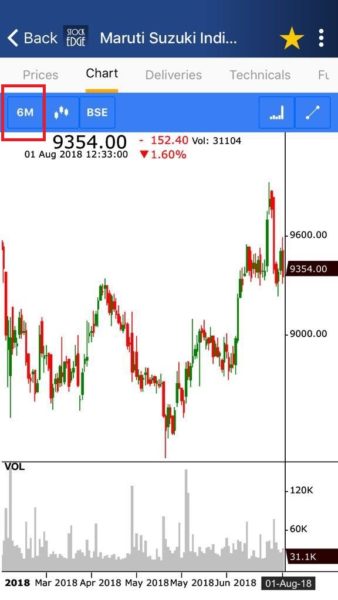
6 Month Time-Frame
In the advanced chart, 6-month time frame was not available. So in the version 3.4 of StockEdge now we can see 6-month time frame chart also.
Bottom Line
All the features that we have discussed above are important when we research about any particular stock. StockEdge has brought those technical indicators that a technical trader uses in their daily trading system. Now we can easily filter out the stocks using those indicators.


