StockEdge.com
  • Products
    • StockEdge Premium
    • StockEdge Pro
    • StockEdge Club
    • Compare Plans
StockEdge Blog
  • Trending Stocks
  • Insights
    • All
    • Business Houses
    • Markets themes
    • Stock Insights
    Top 5 Textile stocks

    Top 5 Textile Stocks in India: From Cotton to Cash

    multi-bagger stocks for 2025

    5 Multibagger Stocks to keep an eagle-eye for 2025

    Jindal Saw – Strong Earnings Momentum Ahead

    Jindal Saw – Strong Earnings Momentum Ahead

    Kirloskar Group- A Legacy of 134 Years

    Kirloskar Group- A Legacy of 134 Years

    renewable energy stocks in india

    Top Renewable Energy Stocks in India

    blue chip stocks

    Top 5 Blue Chip Stocks to Buy and Invest in 2023

    Budget 2023: Stocks to keep an eye on

    Budget 2023: Stocks to keep an eye on

    Adani Enterprises FPO: Detailed Analysis, GMP and Review?

    Adani Enterprises FPO: Detailed Analysis, GMP and Review?

    Top 5 Defence Stocks to Invest in India

    Top 5 Defence Stocks to Invest in India

  • Technical Analysis
    Chart Patterns – Holy grail of Stock Market Analysis

    Chart Patterns – Holy grail of Stock Market Analysis

    StockEdge Version Update : 9.0

    StockEdge Version Update : 9.0

    Beat the street with Sector Rotation Strategy

    Beat the street with Sector Rotation Strategy

    StockEdge Version Update 8.2

    StockEdge Version Update 8.2

    Derivative Analytics

    An Insightful Research Tool For Derivative Analytics

    Introducing Put-Call Ratio a Derivative Indicator in the Market

    Introducing Put-Call Ratio a Derivative Indicator in the Market

    A Powerful Technical Indicator Beta & Beta Scans

    A Powerful Technical Indicator Beta & Beta Scans

    Technical Analysis using Edge Charts

    Technical Analysis using Edge Charts

    adaptive relative strength and static relative strength scans

    What is Adaptive Relative Strength & Static Relative Strength Scans?

  • Fundamental Analysis
    • All
    • Cash Flow Ratios
    • Efficiency ratios
    • Growth Ratios
    • Liquidity Ratios
    • Return Ratios
    • Solvency ratios
    • Valuation Ratios
    high dividend paying stocks

    Identifying High Dividend Paying Stocks

    Understanding the Importance of creating Fundamental Scans

    Understanding the Importance of creating Fundamental Scans

    Using My Combination Scan to Identify best in an Industry

    Using My Combination Scan to Identify best in an Industry

    Cost Income ratio

    Cost to Income Ratio(%)

    Cost of Liability

    Cost of Liabilities (%)

    Operating Cost to Assets Ratio (%)

    Operating Cost to Assets Ratio (%)

  • StockEdge Tutorials
    StockEdge Club: An Exclusive Investors Hub & Analytics platform

    StockEdge Club: An Exclusive Investors Hub & Analytics platform

    FII/DII Data: Leading Indicators of Stock Market

    FII/DII Data: Leading Indicators of Stock Market

    Chart Patterns – Holy grail of Stock Market Analysis

    Chart Patterns – Holy grail of Stock Market Analysis

    StockEdge Version Update : 9.0

    StockEdge Version Update : 9.0

    Powerful Investment Themes for Retail Investors

    Powerful Investment Themes for Retail Investors

    Beat the street with Sector Rotation Strategy

    Beat the street with Sector Rotation Strategy

    StockEdge Version Update 8.3

    StockEdge Version Update 8.3

    StockEdge Version Update 8.2

    StockEdge Version Update 8.2

    Using Investor Portfolios Section to track Big Bulls like Rakesh Jhunjhunwala

    Using Investor Portfolios Section to track Big Bulls like Rakesh Jhunjhunwala

  • Mutual Fund
    Top 5 Mutual Funds for 2022 where you can start your SIP

    Top 5 Mutual Funds for 2022 where you can start your SIP

    What are Value Funds and its Advantages?

    What are Value Funds and its Advantages?

    thematic funds

    Thematic Funds : Everything you need to know

    Understanding Sector Funds and their Benefits to our Portfolio

    Understanding Sector Funds and their Benefits to our Portfolio

    Are Dividend Yield Funds a good option to invest in?

    Are Dividend Yield Funds a good option to invest in?

    What are Contra Funds and their advantages?

    What are Contra Funds and their advantages?

    Trending Tags

    No Result
    View All Result
    • Trending Stocks
    • Insights
      • All
      • Business Houses
      • Markets themes
      • Stock Insights
      Top 5 Textile stocks

      Top 5 Textile Stocks in India: From Cotton to Cash

      multi-bagger stocks for 2025

      5 Multibagger Stocks to keep an eagle-eye for 2025

      Jindal Saw – Strong Earnings Momentum Ahead

      Jindal Saw – Strong Earnings Momentum Ahead

      Kirloskar Group- A Legacy of 134 Years

      Kirloskar Group- A Legacy of 134 Years

      renewable energy stocks in india

      Top Renewable Energy Stocks in India

      blue chip stocks

      Top 5 Blue Chip Stocks to Buy and Invest in 2023

      Budget 2023: Stocks to keep an eye on

      Budget 2023: Stocks to keep an eye on

      Adani Enterprises FPO: Detailed Analysis, GMP and Review?

      Adani Enterprises FPO: Detailed Analysis, GMP and Review?

      Top 5 Defence Stocks to Invest in India

      Top 5 Defence Stocks to Invest in India

    • Technical Analysis
      Chart Patterns – Holy grail of Stock Market Analysis

      Chart Patterns – Holy grail of Stock Market Analysis

      StockEdge Version Update : 9.0

      StockEdge Version Update : 9.0

      Beat the street with Sector Rotation Strategy

      Beat the street with Sector Rotation Strategy

      StockEdge Version Update 8.2

      StockEdge Version Update 8.2

      Derivative Analytics

      An Insightful Research Tool For Derivative Analytics

      Introducing Put-Call Ratio a Derivative Indicator in the Market

      Introducing Put-Call Ratio a Derivative Indicator in the Market

      A Powerful Technical Indicator Beta & Beta Scans

      A Powerful Technical Indicator Beta & Beta Scans

      Technical Analysis using Edge Charts

      Technical Analysis using Edge Charts

      adaptive relative strength and static relative strength scans

      What is Adaptive Relative Strength & Static Relative Strength Scans?

    • Fundamental Analysis
      • All
      • Cash Flow Ratios
      • Efficiency ratios
      • Growth Ratios
      • Liquidity Ratios
      • Return Ratios
      • Solvency ratios
      • Valuation Ratios
      high dividend paying stocks

      Identifying High Dividend Paying Stocks

      Understanding the Importance of creating Fundamental Scans

      Understanding the Importance of creating Fundamental Scans

      Using My Combination Scan to Identify best in an Industry

      Using My Combination Scan to Identify best in an Industry

      Cost Income ratio

      Cost to Income Ratio(%)

      Cost of Liability

      Cost of Liabilities (%)

      Operating Cost to Assets Ratio (%)

      Operating Cost to Assets Ratio (%)

    • StockEdge Tutorials
      StockEdge Club: An Exclusive Investors Hub & Analytics platform

      StockEdge Club: An Exclusive Investors Hub & Analytics platform

      FII/DII Data: Leading Indicators of Stock Market

      FII/DII Data: Leading Indicators of Stock Market

      Chart Patterns – Holy grail of Stock Market Analysis

      Chart Patterns – Holy grail of Stock Market Analysis

      StockEdge Version Update : 9.0

      StockEdge Version Update : 9.0

      Powerful Investment Themes for Retail Investors

      Powerful Investment Themes for Retail Investors

      Beat the street with Sector Rotation Strategy

      Beat the street with Sector Rotation Strategy

      StockEdge Version Update 8.3

      StockEdge Version Update 8.3

      StockEdge Version Update 8.2

      StockEdge Version Update 8.2

      Using Investor Portfolios Section to track Big Bulls like Rakesh Jhunjhunwala

      Using Investor Portfolios Section to track Big Bulls like Rakesh Jhunjhunwala

    • Mutual Fund
      Top 5 Mutual Funds for 2022 where you can start your SIP

      Top 5 Mutual Funds for 2022 where you can start your SIP

      What are Value Funds and its Advantages?

      What are Value Funds and its Advantages?

      thematic funds

      Thematic Funds : Everything you need to know

      Understanding Sector Funds and their Benefits to our Portfolio

      Understanding Sector Funds and their Benefits to our Portfolio

      Are Dividend Yield Funds a good option to invest in?

      Are Dividend Yield Funds a good option to invest in?

      What are Contra Funds and their advantages?

      What are Contra Funds and their advantages?

      Trending Tags

      No Result
      View All Result
      StockEdge Blog
      Home Tutorials
      How to use stochastic using Stockedge

      Using Stochastic Indicator

      StockEdge by StockEdge
      August 27, 2018
      Reading Time: 5 mins read
      4.3k
      VIEWS
      Share on FacebookShare on TwitterShare On WhatsApp

      Table of Contents

      • Let’s discuss about Stochastic Indicator:
        • What is Stochastic?
        • How is it used?
          • Overbought and oversold zones
        • Trading divergences
      • Stochastic scans in StockEdge
        • Conditions
        • Conclusion

      Let’s discuss about Stochastic Indicator:

      Stochastic Indicator is one of the technical leading indicators developed by George Lane. According to him, stochastic does not follow any price or volume but it follows the speed or momentum of price.

      He also said that as a rule, the momentum of the price of the stock changes faster than the price itself.

      In this way stochastic oscillator can be used to foreshadow reversals when the indicator reveals bullish or bearish divergences.

      Let us discuss about in details:-

      What is Stochastic?

      The Stochastic indicator compares where a security’s price closes over a selected number of period. The most commonly 14 periods stochastic is used. The Stochastic indicator is designated by “%K” which is just a mathematical representation of a ratio.

      The formula for calculating Stochastic is:

      %K= (Today’s Close)-(Lowest low over a selected period)/ (Highest high over a selected period)- (Lowest low over a selected period)

      The stochastic indicator always moves between zero and hundred, hence it is also known as the stochastic oscillator.

      The value of stochastic oscillator near to zero signifies that today’s close is near to lowest price security traded over a selected period and similarly value of stochastic oscillator near to hundred signifies that today’s close is near to highest price security traded over a selected period.

      How is it used?

      Stochastic can be used in the following ways:

      Overbought and oversold zones

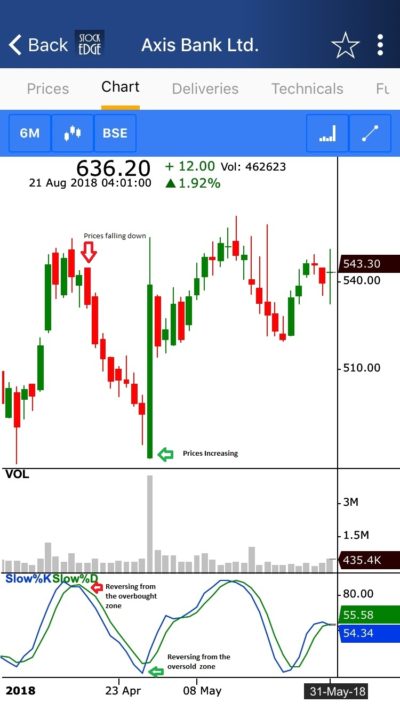
      Generally, stochastic oscillator reading above 80 is considered overbought and stochastic oscillator reading below 20 is considered oversold.

      Stochastic Reversing from Overbought or Oversold zones mainly works in the trading market as compared in the trending market.

      This is explained from the example below:-

      We can see from the chart below that the axis bank was in consolidation for quite some time.

      Whenever stochastic reversed from the overbought zone it fell down and whenever it reversed from the oversold zone the prices went up.
      stochastic indicator and oversold Stockedge

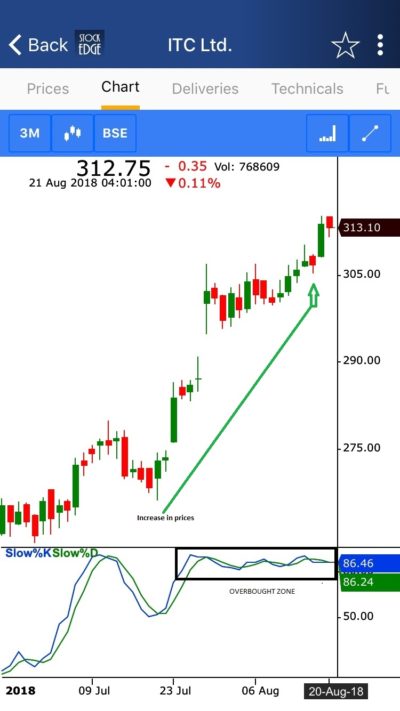
      While in the trending stock like ITC we can see that Stochastic is still in the overbought zone and it is still trending up:-
      Stochastic Overbought area Stochastic

      Trading divergences

      • Positive Divergence is formed when price makes a new low, but stochastic oscillator fails to make new low. This divergence suggests a reversal of trend from down to up.
      • Negative Divergence is formed when price makes new high, but stochastic oscillator fails to make new high. This divergence suggests a reversal of trend from up to down.

      Stochastic scans in StockEdge

       There are many conditions of stochastic available in StockEdge where we can scan and filter out stocks according to it. Let us discuss how stochastic indicator can be used with the help of StockEdge:-

      stochastic Stockedge

      Conditions

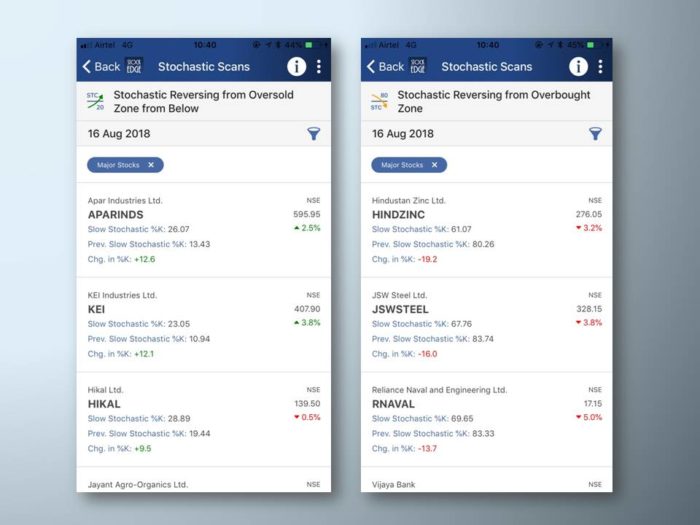
      Stochastic Reversing from Oversold zone from below:  A bullish price reversal has been attempted. One should buy when the price moves above 20 from the oversold zone.

      This is indicating that the price is bullish and now moving towards the overbought zone.

      We get list of the stocks in StockEdge those which are reversing from oversold zone from below.

      Stochastic Reversing from Overbought zone: A bearish price reversal has taken place.

      One should sell when the price moves down below 80 from the overbought zone.

      This is indicating that the price has become bearish and now moving forward to the oversold zone.
      Stochastic Scans


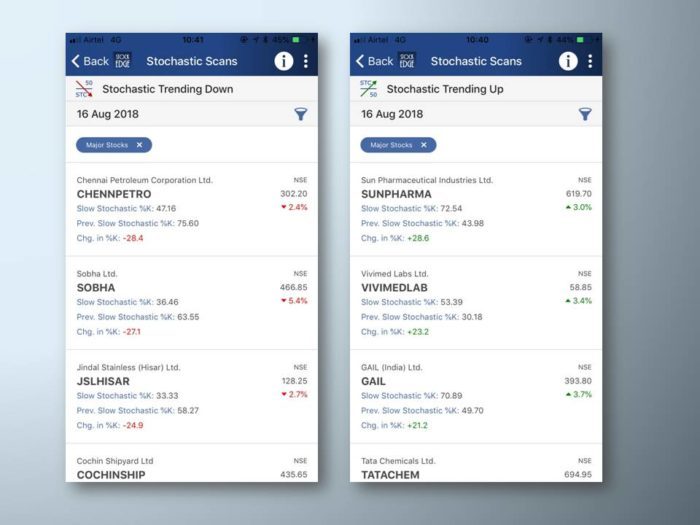
      Stochastic Trending Down: When the stochastic falls beyond 50, we sat that stochastic is trending down. It signifies continuation in the downtrend

      Stochastic Trending Up:  When the stochastic rises above 50, we say the stochastic is trending up. It signifies continuation in the uptrend.

      We can see the name of the companies which fulfil these conditions in the image below:
      stochastic Stockedge scans


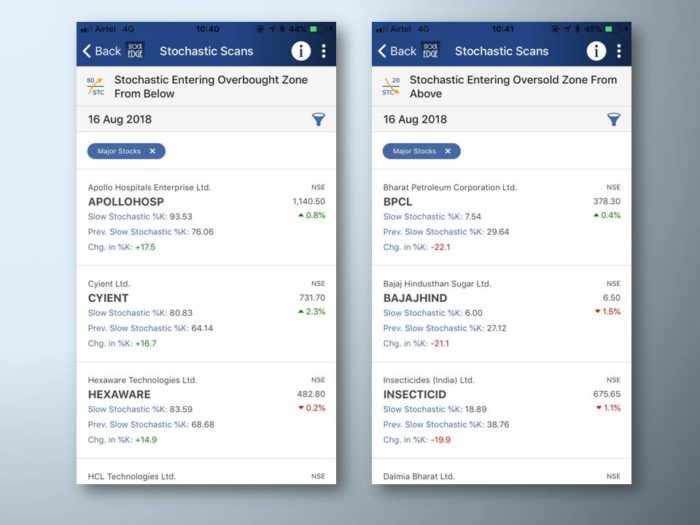
      Stochastic Entering Overbought zone from below: This is also a bullish continuation scan. It indicates that the prices have crossed 80 and now in the overbought zone.

      Stochastic Entering Oversold zone from above: It is a bearish continuation scan. This indicates that the prices have crossed 20 and from above and likely to enter the oversold zone.

      We can see the name of the companies which fulfil these two conditions in the image below:
      stochastic stockedge scan

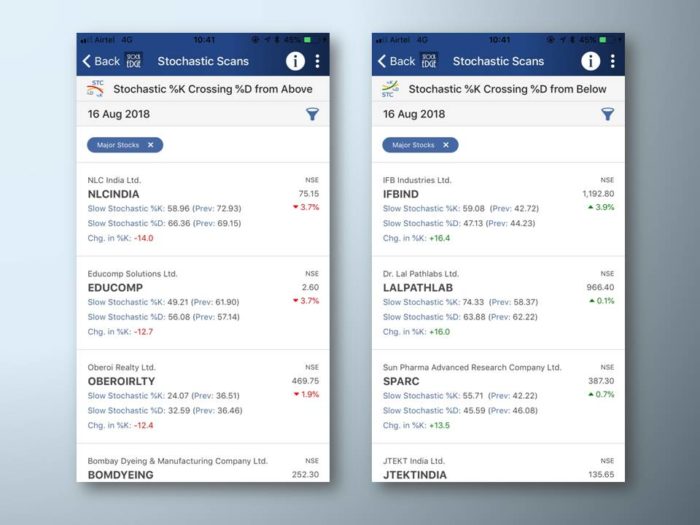
      Stochastic %K Crossing %D from Below: This is a bullish crossover. We get a buy signal when %K crosses %D from below.

      Stochastic %K Crossing %D from Above: This is a bearish crossover. We get a sell signal in the stock when %K crosses %D from above.

      From the image below we can see which stocks fulfil these two conditions:-
      stochastic Stockedge scan

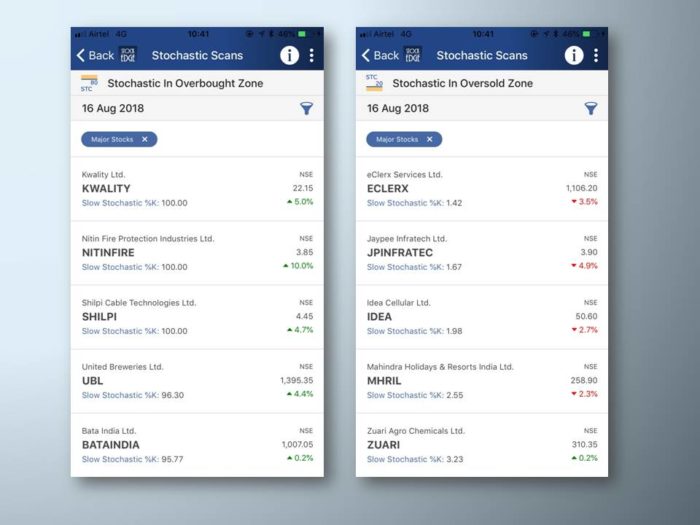
      Stochastic in Overbought zone: In the overbought zone we should usually book profit and avoid taking new buy in this zone. 80-100 is considered as the overbought zone.

      Stochastic in Oversold zone: In the oversold zone 0-20 is considered as the oversold zone.

      We get the names of the stocks which are in the overbought and oversold zones.
      stochastic Stockedge scan

      Conclusion

      This momentum indicator is one of the favourite indicators of most of the technicians. Stochastic can really work very well in the trading markets as well as the trending market.

      This momentum indicator helps in making entry and exits decisions. StockEdge helps us to easily filter out the stocks using the above conditions of Stochastic.

      Stochastic Scan is a premium offering available to paid users, to subscribe to the plans and know more about the offerings, you can click on here.

      To get a comprehensive idea on Stochastic, click here.

      Tags: leading indicatorsmomentum oscillatorNegative DivergenceStochasticStockEdge
      ShareTweetSend
      Subscribe On Telegram Subscribe On Telegram Subscribe On Telegram
      Previous Post

      Analyze 3 Stock Market Charts Like Never Before

      Next Post

      How to use Bollinger Bands?

      StockEdge

      StockEdge

      StockEdge is a self-help Equity and Mutual Fund research tool. It empowers retail investors to identify investment opportunity with all the necessary data and analytics.

      Next Post
      Bollinger Band using Stockedge App

      How to use Bollinger Bands?

      What’s new Version 3.5

      What's new Version 3.5

      Shareholding Scan Stockedge

      Shareholding Pattern: Impacts, Institutional & Investors

      Comments 1

      1. Y D GURUPRASAD says:
        3 years ago

        Excellent, it gave me knowledge of entry and exit of the stock, very much useful

        Reply

      Leave a Reply Cancel reply

      Your email address will not be published. Required fields are marked *

      Contact Us
      • Timing (Mon-Sat): 10 am to 7 pm
      • Sales: +919830994463
      • Support: +919830994402
      • Club Support: +916289906895
      • Affiliate: +917003567131
      Recent Posts
      Top 5 Textile stocks
      Top 5 Textile Stocks in India: From Cotton to Cash
      multi-bagger stocks for 2025
      5 Multibagger Stocks to keep an eagle-eye for 2025
      Important Links
      • StockEdge.com
      • StockEdge Premium
      • - Quarterly Membership
      • - Annual Membership
      • StockEdge Analyst
      • StockEdge Club
      • Compare Plans
      An Initiative Of

      © 2023 Kredent InfoEdge Pvt Ltd.

      Facebook-f Twitter Instagram Linkedin-in Youtube Pinterest-p

      Get StockEdge App

      No Result
      View All Result
      • Home
      • Article Categories
        • Fundamental Analysis
        • Technical Analysis
        • Market Themes
        • StockEdge Tutorials
        • StockEdge Version Updates
      • Products
        • StockEdge Premium
        • StockEdge Pro
        • StockEdge Club
        • Compare Plans
      • Visit StockEdge.com

      © 2023 Kredent InfoEdge Pvt Ltd.