StockEdge.com
  • Go Premium
    • StockEdge Quarterly Plan
    • StockEdge Annual Plan
    • StockEdge Analyst
    • StockEdge Club
    • Compare Plans
StockEdge Blog
  • Trending Stocks
  • Insights
    • All
    • Business Houses
    • Markets themes
    • Stock Insights
    Piramal Enterprises: Demerger to unlock value

    Piramal Enterprises: Demerger to unlock value

    Top 5 High-Quality Small-Cap Stocks for H2 FY23

    Top 5 High-Quality Small-Cap Stocks for H2 FY23

    Top 3 High Growth Stocks for wealth creation in the next ten years

    Top 3 High Growth Stocks for wealth creation in the next ten years

    Top 5 High-Quality Mid-Cap Stocks for 2022

    Top 5 High-Quality Mid-Cap Stocks for 2022

    How Page Industries is creating a “branded” opportunity in a fragmented market

    How Page Industries is creating a “branded” opportunity in a fragmented market

    5 Stocks which are Consistently Paying Dividend

    5 Stocks which are Consistently Paying Dividend

    Elgi Equipments – Enjoying Strong Tailwinds

    Elgi Equipments – Enjoying Strong Tailwinds

    J.B. Chemicals & Pharmaceuticals – One of India’s fastest-growing pharmaceutical companies

    J.B. Chemicals & Pharmaceuticals – One of India’s fastest-growing pharmaceutical companies

    Blue Dart Express – A market leader in Air Express Industry

    Blue Dart Express – A market leader in Air Express Industry

  • Technical Analysis
    Derivative Analytics

    Derivative Analytics – An Insightful Research Tool

    Put-Call Ratio – A Powerful Derivatives Indicator

    Put-Call Ratio – A Powerful Derivatives Indicator

    Beta & Beta Scans – A Powerful Technical Indicator

    Beta & Beta Scans – A Powerful Technical Indicator

    Technical Analysis using Edge Charts

    Technical Analysis using Edge Charts

    Adaptive Relative Strength & Static Relative Strength Scans

    Adaptive Relative Strength & Static Relative Strength Scans

    SuperTrend Indicator : Sell or Buy Signals

    SuperTrend Indicator : Sell or Buy Signals

    2 year and 5 year Price Breakout Scans

    2 year and 5 year Price Breakout Scans

    What is Narrow Range Scans (NR)

    What is Narrow Range Scans (NR)

    Relative Strength (RS)

    Relative Strength (RS)

  • Fundamental Analysis
    • All
    • Cash Flow Ratios
    • Efficiency ratios
    • Growth Ratios
    • Liquidity Ratios
    • Return Ratios
    • Solvency ratios
    • Valuation Ratios
    Understanding the Importance of creating Fundamental Scans

    Understanding the Importance of creating Fundamental Scans

    Using My Combination Scan to Identify best in an Industry

    Using My Combination Scan to Identify best in an Industry

    Cost Income ratio

    Cost to Income Ratio(%)

    Cost of Liability

    Cost of Liabilities (%)

    Operating Cost to Assets Ratio (%)

    Operating Cost to Assets Ratio (%)

    Promoter pledge

    Promoter Pledge: Know Everything about it

  • StockEdge Tutorials
    Using Investor Portfolios Section to track Big Bulls like Rakesh Jhunjhunwala

    Using Investor Portfolios Section to track Big Bulls like Rakesh Jhunjhunwala

    StockEdge Version 8.1 – It keeps getting Better & Better

    StockEdge Version 8.1 – It keeps getting Better & Better

    StockEdge Version Update 8.0 – Like never before

    StockEdge Version Update 8.0 – Like never before

    Derivative Analytics

    Derivative Analytics – An Insightful Research Tool

    Market Breadth – A Bird’s Eye View of the Market at 1 place

    Market Breadth – A Bird’s Eye View of the Market at 1 place

    StockEdge Version 7.6 released – Enhancing your investment journey further!

    StockEdge Version 7.6 released – Enhancing your investment journey further!

    Beta & Beta Scans – A Powerful Technical Indicator

    Beta & Beta Scans – A Powerful Technical Indicator

    StockEdge Version Update 7.4 – Enhancing your Investment Journey

    StockEdge Version Update 7.4 – Enhancing your Investment Journey

    StockEdge 7.3 Release

    StockEdge 7.3 Release

  • Mutual Fund
    Top 5 Mutual Funds for 2022 where you can start your SIP

    Top 5 Mutual Funds for 2022 where you can start your SIP

    What are Value Funds and its Advantages?

    What are Value Funds and its Advantages?

    A Beginners Guide to Thematic Funds

    A Beginners Guide to Thematic Funds

    Understanding Sector Funds and their Benefits to our Portfolio

    Understanding Sector Funds and their Benefits to our Portfolio

    Are Dividend Yield Funds a good option to invest in?

    Are Dividend Yield Funds a good option to invest in?

    What are Contra Funds and their advantages?

    What are Contra Funds and their advantages?

    Trending Tags

    No Result
    View All Result
    • Trending Stocks
    • Insights
      • All
      • Business Houses
      • Markets themes
      • Stock Insights
      Piramal Enterprises: Demerger to unlock value

      Piramal Enterprises: Demerger to unlock value

      Top 5 High-Quality Small-Cap Stocks for H2 FY23

      Top 5 High-Quality Small-Cap Stocks for H2 FY23

      Top 3 High Growth Stocks for wealth creation in the next ten years

      Top 3 High Growth Stocks for wealth creation in the next ten years

      Top 5 High-Quality Mid-Cap Stocks for 2022

      Top 5 High-Quality Mid-Cap Stocks for 2022

      How Page Industries is creating a “branded” opportunity in a fragmented market

      How Page Industries is creating a “branded” opportunity in a fragmented market

      5 Stocks which are Consistently Paying Dividend

      5 Stocks which are Consistently Paying Dividend

      Elgi Equipments – Enjoying Strong Tailwinds

      Elgi Equipments – Enjoying Strong Tailwinds

      J.B. Chemicals & Pharmaceuticals – One of India’s fastest-growing pharmaceutical companies

      J.B. Chemicals & Pharmaceuticals – One of India’s fastest-growing pharmaceutical companies

      Blue Dart Express – A market leader in Air Express Industry

      Blue Dart Express – A market leader in Air Express Industry

    • Technical Analysis
      Derivative Analytics

      Derivative Analytics – An Insightful Research Tool

      Put-Call Ratio – A Powerful Derivatives Indicator

      Put-Call Ratio – A Powerful Derivatives Indicator

      Beta & Beta Scans – A Powerful Technical Indicator

      Beta & Beta Scans – A Powerful Technical Indicator

      Technical Analysis using Edge Charts

      Technical Analysis using Edge Charts

      Adaptive Relative Strength & Static Relative Strength Scans

      Adaptive Relative Strength & Static Relative Strength Scans

      SuperTrend Indicator : Sell or Buy Signals

      SuperTrend Indicator : Sell or Buy Signals

      2 year and 5 year Price Breakout Scans

      2 year and 5 year Price Breakout Scans

      What is Narrow Range Scans (NR)

      What is Narrow Range Scans (NR)

      Relative Strength (RS)

      Relative Strength (RS)

    • Fundamental Analysis
      • All
      • Cash Flow Ratios
      • Efficiency ratios
      • Growth Ratios
      • Liquidity Ratios
      • Return Ratios
      • Solvency ratios
      • Valuation Ratios
      Understanding the Importance of creating Fundamental Scans

      Understanding the Importance of creating Fundamental Scans

      Using My Combination Scan to Identify best in an Industry

      Using My Combination Scan to Identify best in an Industry

      Cost Income ratio

      Cost to Income Ratio(%)

      Cost of Liability

      Cost of Liabilities (%)

      Operating Cost to Assets Ratio (%)

      Operating Cost to Assets Ratio (%)

      Promoter pledge

      Promoter Pledge: Know Everything about it

    • StockEdge Tutorials
      Using Investor Portfolios Section to track Big Bulls like Rakesh Jhunjhunwala

      Using Investor Portfolios Section to track Big Bulls like Rakesh Jhunjhunwala

      StockEdge Version 8.1 – It keeps getting Better & Better

      StockEdge Version 8.1 – It keeps getting Better & Better

      StockEdge Version Update 8.0 – Like never before

      StockEdge Version Update 8.0 – Like never before

      Derivative Analytics

      Derivative Analytics – An Insightful Research Tool

      Market Breadth – A Bird’s Eye View of the Market at 1 place

      Market Breadth – A Bird’s Eye View of the Market at 1 place

      StockEdge Version 7.6 released – Enhancing your investment journey further!

      StockEdge Version 7.6 released – Enhancing your investment journey further!

      Beta & Beta Scans – A Powerful Technical Indicator

      Beta & Beta Scans – A Powerful Technical Indicator

      StockEdge Version Update 7.4 – Enhancing your Investment Journey

      StockEdge Version Update 7.4 – Enhancing your Investment Journey

      StockEdge 7.3 Release

      StockEdge 7.3 Release

    • Mutual Fund
      Top 5 Mutual Funds for 2022 where you can start your SIP

      Top 5 Mutual Funds for 2022 where you can start your SIP

      What are Value Funds and its Advantages?

      What are Value Funds and its Advantages?

      A Beginners Guide to Thematic Funds

      A Beginners Guide to Thematic Funds

      Understanding Sector Funds and their Benefits to our Portfolio

      Understanding Sector Funds and their Benefits to our Portfolio

      Are Dividend Yield Funds a good option to invest in?

      Are Dividend Yield Funds a good option to invest in?

      What are Contra Funds and their advantages?

      What are Contra Funds and their advantages?

      Trending Tags

      No Result
      View All Result
      StockEdge Blog
      Home Tutorials
      ADvanced Charting by Stockedge

      Analyze 3 Stock Market Charts Like Never Before

      StockEdge by StockEdge
      August 22, 2018
      Reading Time: 5 mins read
      3.1k
      VIEWS
      Share on FacebookShare on TwitterShare On WhatsApp

      Table of Contents

      • Using Drawing Tool with Charts:
        • Magnet:
        • Free Hand Trend line:
        • Crosshair:

      We know the importance of charting while making a trading decision or short-term investment in the stock market. Without charts it is really difficult to analyze the stock price trends, right?

      With the introduction of version 3.0 of the StockEdge application, we introduced you to our StockEdge’s charting solution and with each upgraded version of the application we keep on upgrading the charting solution.

      Let’s discuss its feature one by one.

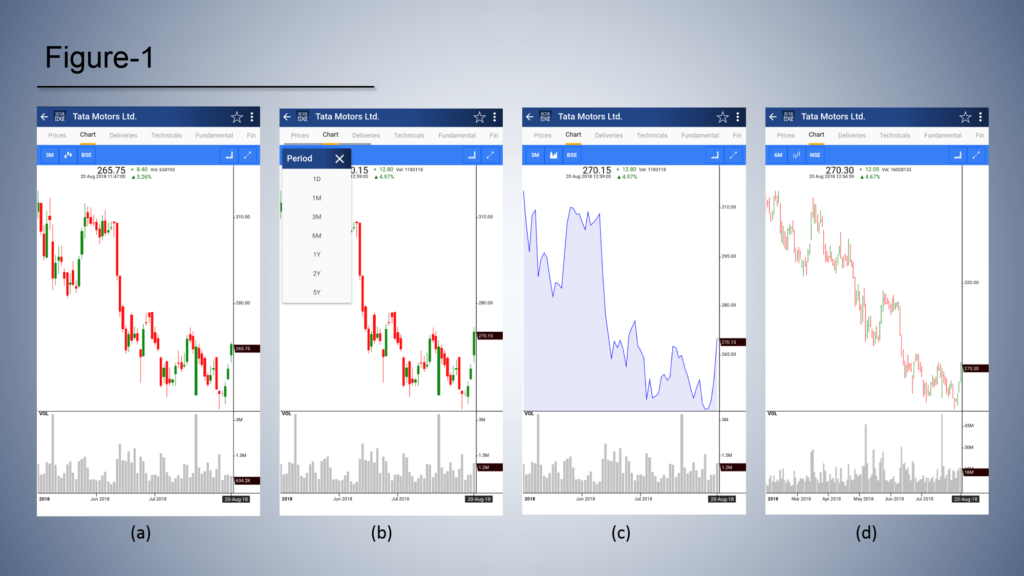
      Fig-1(a)

      Representing the chart of Tata Motors. Price is represented here as candlestick and in the lower section we have the volume indicator.

      In the top section of the chart, there is a blue panel that contains some different features. Let’s explore them.
      Download StockEdge App Download StockEdge App Download StockEdge App

      price charts of Tata Motor in Stockedge app

      Fig-1 (b),

      This is the Time frame tab and it contains seven different time frames. Starting from 1 day’s price action, you can select price action for up to 5 years.

      Fig-1 (c),

      This section contains 4 different styles of price charts.

      1. Candlestick
      2. Bar chart
      3. Line chart
      4. Area chart

      Please remember, for a 1-day time frame only area and line is available.

      Fig-1 (d),

      This tab consists of two different exchange, they are NSE and BSE. By switching between the exchanges, a user can explore between two exchanges.

      So far we have understood how to change time frame, chart type (candle, line, bar etc.) and the type of exchanges. Now, we will discuss indicators and the drawing tool which is pretty much essential for analyzing a chart.
      Tata motor Chart Analysis

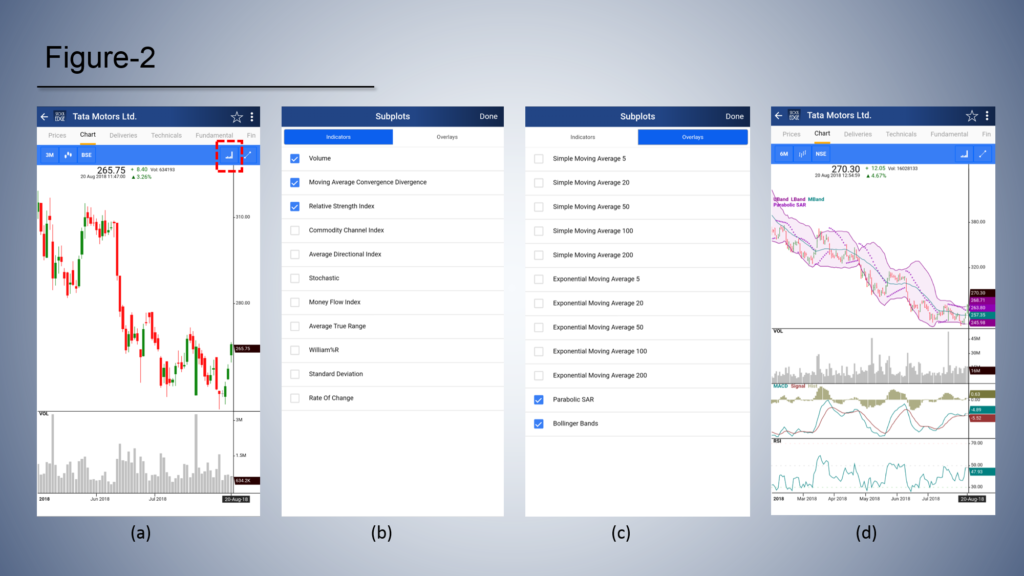
      To select an indicator click on the subplots which shows both Indicators and Overlays (Fig- 2a)

      In the indicator segment, we have eleven different indicators which are mostly used by the traders. As we know Indicators are plotted below the price, so any selection from this segment will be plotted below the price.

      In this segment Indicators like Volume, RSI, MACD, etc. are available. For applying any indicator, we need to just tap on the indicator and once we are done with our selection we can press the ‘Done’ button. To delete an indicator from the chart we can go to the Subplots section again and tap on the pre-selected indicator (select the indicator, you want to delete) to deselect it.

      In the overlay segment indicators are plotted directly on the price section. These indicators are popular as well as very much effective.

      The procedure is the same as the indicator segment. We need to select an option to apply it on the chart.

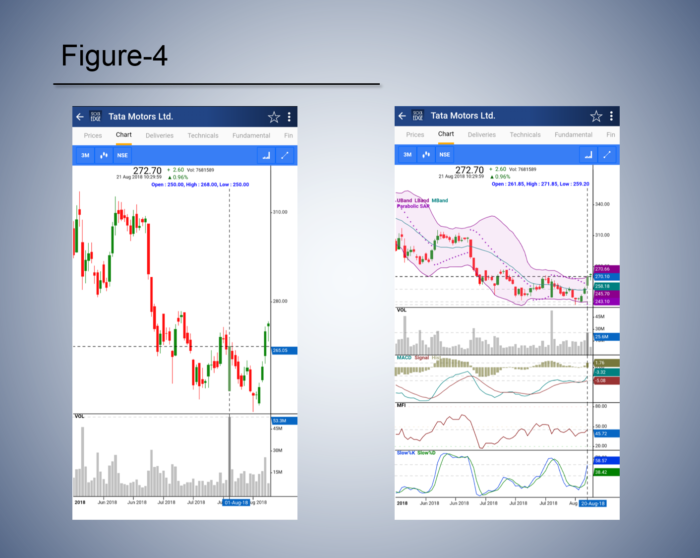
       The important point we need to remember is that for technical analysis it is very important to keep the chart clean so that we can interact with it easily and can understand the price action well. Due to this reason, we have restricted the indicator and overlay selection. A user can select up to 4 indicators and 3 overlays on the chart. We believe these are more than enough while analyzing a chart.

      In Figure-2 (d) we have shared an image which is explaining how a chart looks when four subplots and three overlays are plotted on it.

      Using Drawing Tool with Charts:

      We know how important to draw a trend line, support line, resistance line in the chart for developing good trading practice and filtering our Entry and Exit decisions. For the user’s convenience, we have provided two important drawing tools.
      Using Drawing Tool in StockEdge

      They are-

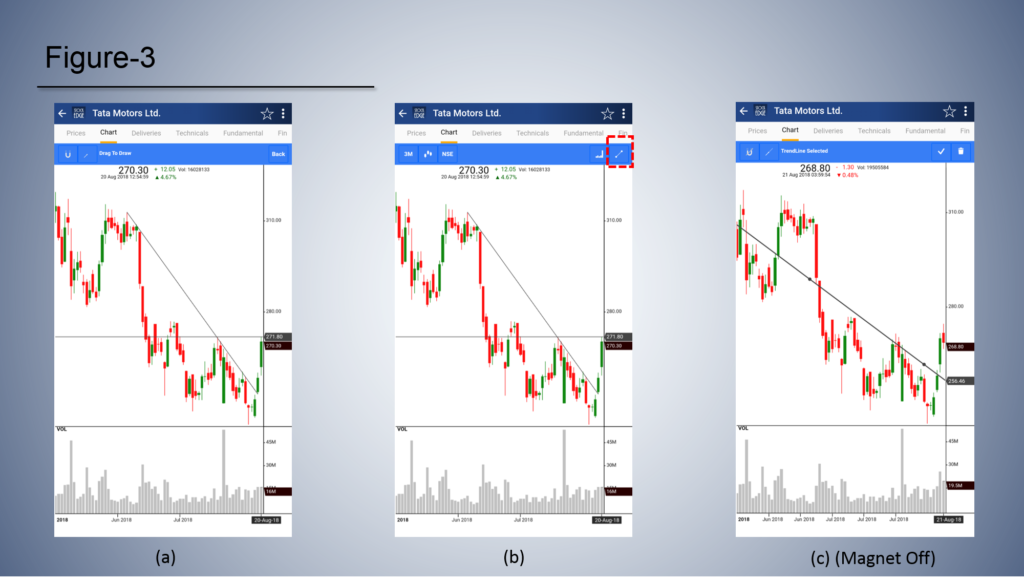
                      1.    Magnet (Fig 3-a)

                      2.   Free hand Trendline (Fig 3-b)

                                      a. Horizontal trend line(with the extension on)

                                      b. Trendline (with the extension off)

      To ease your understanding we will first discuss the Trendline and then we will discuss the Magnet button.

      Magnet:

      Magnet is selected by default, once you click on the trendline button in the toolbar indicated in the fig 3b, you will find a customized trendline toolbar proving you with the information of the trendline to be drawn. Now you may draw a trendline anywhere in the chart itself. The point of the trendline will automatically snap to major points depending on the type of chart used and the position of your finger. Basically, this option helps to draw the lines more accurately and in an easy way.

      Free Hand Trend line:

      To draw a free-hand trend line all you need to do is to deselect the magnet icon in the trendline toolbar as indicated in fig 3 c. Now you are can move the points of your trendline anywhere within the chart. The points won’t automatically span to open, high, low, etc. like in magnet.

      Crosshair:

      As you all know crosshair is an important tool for chart analysis. Crosshair helps to point out a particular price point and show us the corresponding price along with Open, High, Low, Close (OHLC) and date.

      In the StockEdge application, you just need to tap on the candle or on the price bar to see their consecutive prices. The crosshair is normally not visible on the screen. Once any price point is tapped we get to see the crosshair and the details of that point.

      Crosshair also shows the value of the applied indicators and overlays. When the indicators, overlays or both are applied in the chart we need to tap on the price bar or the candle to see the value of those indicators or overlays.
      stockedge price chart

      A user can open a chart by typing its name in the search button or can select the stocks button and then search the name of the stock to see its chart.

      An important feature of this application is, when you are in the scan section and click on any stock, it takes you to an advanced chart page with pre-defined technical conditions as in the scan, the stock’s chart appears with that technical indicator automatically plotted.

      To avail this feature, a user first needs to select or define some technical parameters from the Scans section (Home tab) and when the results appear one can explore their charts.

      Advanced Edge Chart is a premium offering available to paid users, know more about the advanced offerings.

      Get a comprehensive idea of advanced charts.

      Tags: advanced chartingCrosshairIndicatorsMagnetresistance lineshort-term investmentStockEdgesupport linetrading decisiontrend line
      ShareTweetSend
      Subscribe On Telegram Subscribe On Telegram Subscribe On Telegram
      Previous Post

      New Features in StockEdge version 3.4

      Next Post

      Using Stochastic Indicator

      StockEdge

      StockEdge

      StockEdge is a self-help Equity and Mutual Fund research tool. It empowers retail investors to identify investment opportunity with all the necessary data and analytics.

      Related Posts

      Using Investor Portfolios Section to track Big Bulls like Rakesh Jhunjhunwala
      StockEdge Tutorials

      Using Investor Portfolios Section to track Big Bulls like Rakesh Jhunjhunwala

      July 25, 2022
      16.5k
      StockEdge Version 8.1 – It keeps getting Better & Better
      StockEdge Tutorials

      StockEdge Version 8.1 – It keeps getting Better & Better

      June 13, 2022
      3.2k
      StockEdge Version Update 8.0 – Like never before
      StockEdge Tutorials

      StockEdge Version Update 8.0 – Like never before

      April 28, 2022
      7.5k
      Next Post
      How to use stochastic using Stockedge

      Using Stochastic Indicator

      Bollinger Band using Stockedge App

      How to use Bollinger Bands?

      What’s new Version 3.5

      What's new Version 3.5

      Comments 5

      1. Ritesh Gaggar says:
        4 years ago

        Can we save selected technical parameters on the chart by default so that we do not have to select the parameters again and again if we change company ticker?

        Reply
        • Surbhi lohia says:
          4 years ago

          Currently, we do not have that feature. Your feature request has been noted.

          Reply
      2. Prince Jamwal says:
        3 years ago

        Sir ji mob pe kaun c aap pe chart dekna h

        Reply
        • Surbhi Lohia says:
          3 years ago

          Download stockedge app https://www.stockedge.com/?download=1

          Reply
      3. Pingback: Candlestick Chart Pattern - A quick guide to Candlesticks

      Leave a Reply Cancel reply

      Your email address will not be published. Required fields are marked *

      Contact Us

      • Timing (Mon-Sat): 10 am to 7 pm
      • Sales: +919830994463
      • Support: +919830994402
      • Club Support: +916289906895
      • Affiliate: +917003567131

      Recent Posts

      Piramal Enterprises: Demerger to unlock value

      August 14, 2022

      Top 5 High-Quality Small-Cap Stocks for H2 FY23

      August 1, 2022

      Important Links

      • StockEdge.com
      • StockEdge Premium
      • - Quarterly Membership
      • - Annual Membership
      • StockEdge Analyst
      • StockEdge Club
      • Compare Plans

      An Initiative Of

      © 2021 Kredent InfoEdge Pvt Ltd.

      Facebook-f Twitter Instagram Linkedin-in Youtube Pinterest-p

      Get StockEdge App

      No Result
      View All Result
      • Home
      • Article Categories
        • Fundamental Analysis
        • Technical Analysis
        • Market Themes
        • StockEdge Tutorials
        • StockEdge Version Updates
      • StockEdge Premium
        • Quarterly Membership
        • Annual Membership
        • StockEdge Analyst
        • StockEdge Club
        • Compare Plans
      • Visit StockEdge.com

      © 2021 Kredent InfoEdge Pvt Ltd.