Table of Contents
Market Breadth is a premium feature introduced by StockEdge which gives an overall performance of the NIFTY 50, NIFTY BANK, NIFTY 500, NIFTY MIDCAP and other major indices of the market over different time periods. It is segmented into three parts:
- Market Breadth
- Periodic High/Low
- Advance/Decline
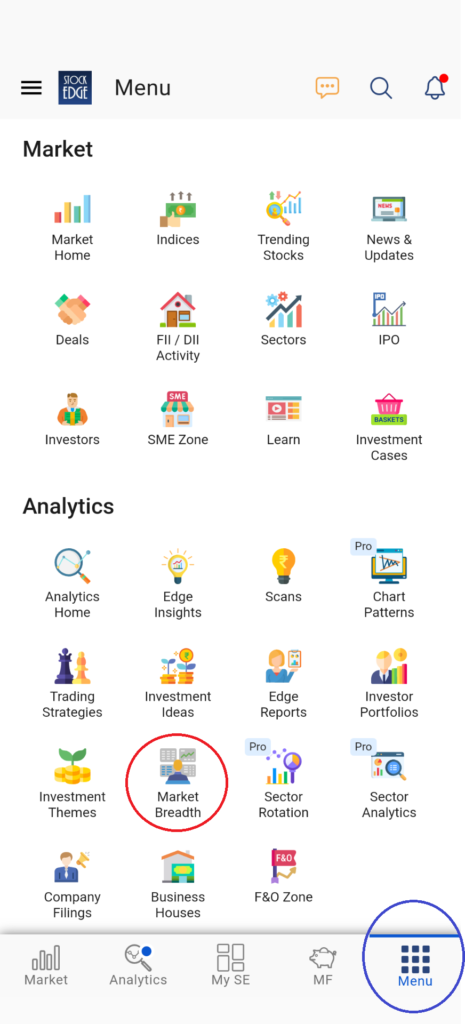
You can find the Market breadth segment on the analytics heading of the StockEdge menu:
Segments of Market Breadth
Breadth
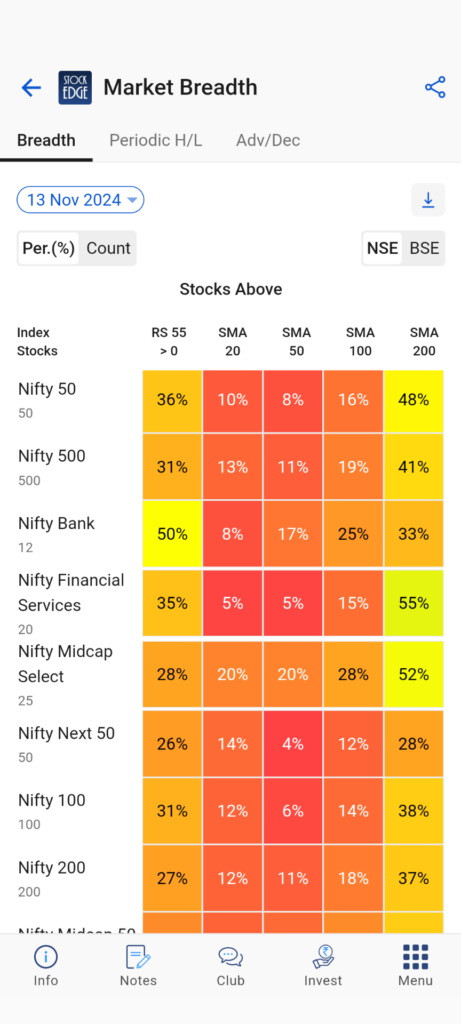
Breadth shows the per cent or count of securities that have outperformed market benchmark NIFTY 50 over a period of 55 days through the RS 55 column and the per cent or count of securities in major market indices whose closing price is trading above SMA 20, SMA 50, SMA 100 and SMA 200 respectively for a period of 50 days.
So, with the help of market breadth, you can analyze the overall sentiment of the market as well as specific sectors through other major market indices.
If the count or per cent is high, it is shaded in green, in yellow if it is neutral and in shades of red for a low count. Green shades indicate an uptrend, yellow shades indicate a neutral outlook and red shades indicate a downtrend. This gives the users an overall idea of the price trends in the market and where it is headed in the future.
In the above image you can clearly see that the majority of market indices are downtrend whereas only Nifty Bank where 50% of the stocks are trading RS positive is depicting neutral outlook in the current market. Other than this if you wish to see the historical data of any particular market index, click on that particular index to view its historical market breadth.
Periodic High/Low
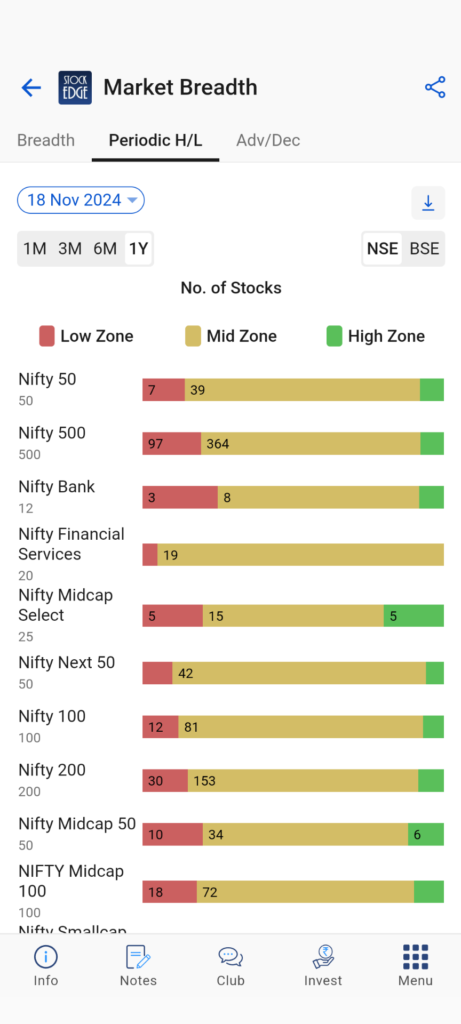
Periodic high/ low refers to the high and low reached in a given time period. Users can view the count of stocks that are trading near their periodic high or low for different time periods. When a security is trading at a value which is within 20% of its High-Low range, it qualifies to be shown in the Period High/Low Analysis. For better understanding, let us refer to an example. Suppose a stock has a 1 month high of Rs. 150 and a 1 month low of Rs. 90. The range of the periodic high/low is 60 and 20% of the range is 12.
So if the stock is trading at Rs. 138 or above or if it is trading at 102 or below, we consider it to be trading near its periodic High/Low. When the count of stocks trading near periodic high is increasing consistently, an uptrend in the market is indicated and when the per cent or count of stocks trading near the periodic low is constantly increasing, a downtrend is indicated. Users can use this segment to see where the stocks lie relative to their period high/low values.
Advance/Decline
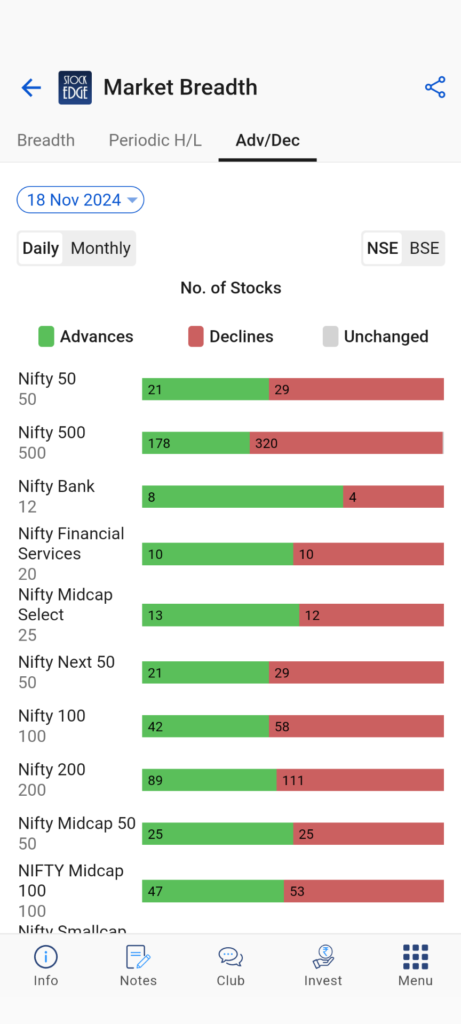
Advance refers to the number of stocks that have closed above their previous close and Decline refers to the number of stocks that have closed below their previous low. The bar chart shows the advance/decline for Nifty 50, Nifty Bank, Nifty 500 and other major indices of the market for different time periods. If advances are greater than declines consistently, an uptrend is indicated and if declines are greater than advances consistently, a downtrend is indicated. As the number of Advances increases, it indicates that stocks are performing better comparatively and an overall uptrend will come by.
This feature aims to provide users information about market trends in a very comprehensive manner. An overall look at any of the segments will help users form an opinion on market trends. Equity Research will become more efficient and faster if users use this feature efficiently.
Check out StockEdge’s Premium Plans to get the most out of it.
Also, keep watching this space for our midweek and weekend editions of ‘Trending Stocks‘ and ‘Stock Insights‘.


