StockEdge.com
  • Products
    • StockEdge Premium
    • StockEdge Pro
    • StockEdge Club
    • Compare Plans
StockEdge Blog
  • Trending Stocks
  • Insights
    • All
    • Business Houses
    • Markets themes
    • Stock Insights
    Top 5 Textile stocks

    Top 5 Textile Stocks in India: From Cotton to Cash

    multi-bagger stocks for 2025

    5 Multibagger Stocks to keep an eagle-eye for 2025

    Jindal Saw – Strong Earnings Momentum Ahead

    Jindal Saw – Strong Earnings Momentum Ahead

    Kirloskar Group- A Legacy of 134 Years

    Kirloskar Group- A Legacy of 134 Years

    renewable energy stocks in india

    Top Renewable Energy Stocks in India

    blue chip stocks

    Top 5 Blue Chip Stocks to Buy and Invest in 2023

    Budget 2023: Stocks to keep an eye on

    Budget 2023: Stocks to keep an eye on

    Adani Enterprises FPO: Detailed Analysis, GMP and Review?

    Adani Enterprises FPO: Detailed Analysis, GMP and Review?

    Top 5 Defence Stocks to Invest in India

    Top 5 Defence Stocks to Invest in India

  • Technical Analysis
    Chart Patterns – Holy grail of Stock Market Analysis

    Chart Patterns – Holy grail of Stock Market Analysis

    StockEdge Version Update : 9.0

    StockEdge Version Update : 9.0

    Beat the street with Sector Rotation Strategy

    Beat the street with Sector Rotation Strategy

    StockEdge Version Update 8.2

    StockEdge Version Update 8.2

    Derivative Analytics

    An Insightful Research Tool For Derivative Analytics

    Introducing Put-Call Ratio a Derivative Indicator in the Market

    Introducing Put-Call Ratio a Derivative Indicator in the Market

    A Powerful Technical Indicator Beta & Beta Scans

    A Powerful Technical Indicator Beta & Beta Scans

    Technical Analysis using Edge Charts

    Technical Analysis using Edge Charts

    adaptive relative strength and static relative strength scans

    What is Adaptive Relative Strength & Static Relative Strength Scans?

  • Fundamental Analysis
    • All
    • Cash Flow Ratios
    • Efficiency ratios
    • Growth Ratios
    • Liquidity Ratios
    • Return Ratios
    • Solvency ratios
    • Valuation Ratios
    high dividend paying stocks

    Identifying High Dividend Paying Stocks

    Understanding the Importance of creating Fundamental Scans

    Understanding the Importance of creating Fundamental Scans

    Using My Combination Scan to Identify best in an Industry

    Using My Combination Scan to Identify best in an Industry

    Cost Income ratio

    Cost to Income Ratio(%)

    Cost of Liability

    Cost of Liabilities (%)

    Operating Cost to Assets Ratio (%)

    Operating Cost to Assets Ratio (%)

  • StockEdge Tutorials
    StockEdge Club: An Exclusive Investors Hub & Analytics platform

    StockEdge Club: An Exclusive Investors Hub & Analytics platform

    FII/DII Data: Leading Indicators of Stock Market

    FII/DII Data: Leading Indicators of Stock Market

    Chart Patterns – Holy grail of Stock Market Analysis

    Chart Patterns – Holy grail of Stock Market Analysis

    StockEdge Version Update : 9.0

    StockEdge Version Update : 9.0

    Powerful Investment Themes for Retail Investors

    Powerful Investment Themes for Retail Investors

    Beat the street with Sector Rotation Strategy

    Beat the street with Sector Rotation Strategy

    StockEdge Version Update 8.3

    StockEdge Version Update 8.3

    StockEdge Version Update 8.2

    StockEdge Version Update 8.2

    Using Investor Portfolios Section to track Big Bulls like Rakesh Jhunjhunwala

    Using Investor Portfolios Section to track Big Bulls like Rakesh Jhunjhunwala

  • Mutual Fund
    Top 5 Mutual Funds for 2022 where you can start your SIP

    Top 5 Mutual Funds for 2022 where you can start your SIP

    What are Value Funds and its Advantages?

    What are Value Funds and its Advantages?

    thematic funds

    Thematic Funds : Everything you need to know

    Understanding Sector Funds and their Benefits to our Portfolio

    Understanding Sector Funds and their Benefits to our Portfolio

    Are Dividend Yield Funds a good option to invest in?

    Are Dividend Yield Funds a good option to invest in?

    What are Contra Funds and their advantages?

    What are Contra Funds and their advantages?

    Trending Tags

    No Result
    View All Result
    • Trending Stocks
    • Insights
      • All
      • Business Houses
      • Markets themes
      • Stock Insights
      Top 5 Textile stocks

      Top 5 Textile Stocks in India: From Cotton to Cash

      multi-bagger stocks for 2025

      5 Multibagger Stocks to keep an eagle-eye for 2025

      Jindal Saw – Strong Earnings Momentum Ahead

      Jindal Saw – Strong Earnings Momentum Ahead

      Kirloskar Group- A Legacy of 134 Years

      Kirloskar Group- A Legacy of 134 Years

      renewable energy stocks in india

      Top Renewable Energy Stocks in India

      blue chip stocks

      Top 5 Blue Chip Stocks to Buy and Invest in 2023

      Budget 2023: Stocks to keep an eye on

      Budget 2023: Stocks to keep an eye on

      Adani Enterprises FPO: Detailed Analysis, GMP and Review?

      Adani Enterprises FPO: Detailed Analysis, GMP and Review?

      Top 5 Defence Stocks to Invest in India

      Top 5 Defence Stocks to Invest in India

    • Technical Analysis
      Chart Patterns – Holy grail of Stock Market Analysis

      Chart Patterns – Holy grail of Stock Market Analysis

      StockEdge Version Update : 9.0

      StockEdge Version Update : 9.0

      Beat the street with Sector Rotation Strategy

      Beat the street with Sector Rotation Strategy

      StockEdge Version Update 8.2

      StockEdge Version Update 8.2

      Derivative Analytics

      An Insightful Research Tool For Derivative Analytics

      Introducing Put-Call Ratio a Derivative Indicator in the Market

      Introducing Put-Call Ratio a Derivative Indicator in the Market

      A Powerful Technical Indicator Beta & Beta Scans

      A Powerful Technical Indicator Beta & Beta Scans

      Technical Analysis using Edge Charts

      Technical Analysis using Edge Charts

      adaptive relative strength and static relative strength scans

      What is Adaptive Relative Strength & Static Relative Strength Scans?

    • Fundamental Analysis
      • All
      • Cash Flow Ratios
      • Efficiency ratios
      • Growth Ratios
      • Liquidity Ratios
      • Return Ratios
      • Solvency ratios
      • Valuation Ratios
      high dividend paying stocks

      Identifying High Dividend Paying Stocks

      Understanding the Importance of creating Fundamental Scans

      Understanding the Importance of creating Fundamental Scans

      Using My Combination Scan to Identify best in an Industry

      Using My Combination Scan to Identify best in an Industry

      Cost Income ratio

      Cost to Income Ratio(%)

      Cost of Liability

      Cost of Liabilities (%)

      Operating Cost to Assets Ratio (%)

      Operating Cost to Assets Ratio (%)

    • StockEdge Tutorials
      StockEdge Club: An Exclusive Investors Hub & Analytics platform

      StockEdge Club: An Exclusive Investors Hub & Analytics platform

      FII/DII Data: Leading Indicators of Stock Market

      FII/DII Data: Leading Indicators of Stock Market

      Chart Patterns – Holy grail of Stock Market Analysis

      Chart Patterns – Holy grail of Stock Market Analysis

      StockEdge Version Update : 9.0

      StockEdge Version Update : 9.0

      Powerful Investment Themes for Retail Investors

      Powerful Investment Themes for Retail Investors

      Beat the street with Sector Rotation Strategy

      Beat the street with Sector Rotation Strategy

      StockEdge Version Update 8.3

      StockEdge Version Update 8.3

      StockEdge Version Update 8.2

      StockEdge Version Update 8.2

      Using Investor Portfolios Section to track Big Bulls like Rakesh Jhunjhunwala

      Using Investor Portfolios Section to track Big Bulls like Rakesh Jhunjhunwala

    • Mutual Fund
      Top 5 Mutual Funds for 2022 where you can start your SIP

      Top 5 Mutual Funds for 2022 where you can start your SIP

      What are Value Funds and its Advantages?

      What are Value Funds and its Advantages?

      thematic funds

      Thematic Funds : Everything you need to know

      Understanding Sector Funds and their Benefits to our Portfolio

      Understanding Sector Funds and their Benefits to our Portfolio

      Are Dividend Yield Funds a good option to invest in?

      Are Dividend Yield Funds a good option to invest in?

      What are Contra Funds and their advantages?

      What are Contra Funds and their advantages?

      Trending Tags

      No Result
      View All Result
      StockEdge Blog
      Home Mutual Fund
      Important Mutual Fund Ratios

      Important Mutual Fund Ratios

      StockEdge by StockEdge
      October 30, 2020
      Reading Time: 7 mins read
      3.9k
      VIEWS
      Share on FacebookShare on TwitterShare On WhatsApp

      Table of Contents

      • Average
        • The formula for Average Return:
        • What is the significance of Average Return?
      • Semi Standard Deviation
      • Standard Deviation 
      • Beta
      • How Beta is calculated?
        • Calculating the Beta with the help of an example:- 
      • Correlation 
      • Beta Correlation 
        • Calculating the Beta with the help of an example:- 
        • How to find the different mutual fund ratios in StockEdge?
      • Conclusion

      When we think of making an investment in a mutual fund, it is advisable to analyze its performance on the basis of certain mutual fund ratios so that it helps you to estimate the future returns and determine whether it will be beneficial for you to invest in the respective fund or not. Here are a few key mutual fund ratios that will help you to evaluate the performance of the mutual fund.

      As a sensible investor, it is important for you to know about these mutual fund ratios before you decide to invest in it. These mutual fund ratios will help you in better investment, the scheme’s performance and evaluate whether you’ll be able to achieve your goals by investing in it or not.

      Average

      It is the mathematical average of a series of returns generated over a period of time (maybe 1 year, 2 years, 5 years, 10 years, etc.). An average return is calculated in a similar manner a simple average is calculated for any set of numbers. 

      The formula for Average Return:

      Average Return = Sum of Returns​/ Number of Returns

      What is the significance of Average Return?

      The average return is a very important mutual fund ratios it tells an investor what kind of returns for an asset or a fund has been in the past or what the returns of a portfolio of companies are. It is not the same as an annualized return. The average return does not factor in compounding.

      Semi Standard Deviation

      The semi-standard deviation is used to measure the below-mean fluctuations in the returns on investment. It reveals the worst-case scenario performance to be expected from a risky investment. It is an alternative measurement to standard deviation which is most often used to evaluate the downside risk of an investment considering only at the negative price fluctuations.

      In the stock market, the semi-standard deviation is used to measure the dispersion of an asset’s price from an observed mean or target value. 

      The objective is to determine the gravity of the downside risk of an investment. The asset’s semi-deviation number can be then compared to the benchmark number, such as an index, to see if it is more or less risky than other potential investments. 

      Standard Deviation 

      It is a statistical measure which tells us the dispersion of a dataset with respect to its mean and is calculated as the square root of the variance. If the data points are away from the mean, the deviation is higher within the data set; therefore, if the spread out the data is more, the standard deviation is higher. 

      A volatile stock will have a high standard deviation, while the deviation of a stable blue-chip stock like Infosys is low. The standard deviation calculates all uncertainty as risk, even when it’s in the investor’s favor for example above average returns.

      An index fund is likely to have a low standard deviation compared to its benchmark index, as the objective of the fund is to replicate the index. Similarly, one can expect growth funds to have a high standard deviation compared to its relative stock indices, as the fund managers make aggressive bets to generate higher returns.

      Beta

      Beta is a metric used in fundamental analysis to determine the sensitivity of an asset or portfolio/fund with respect to the overall market. The market has a beta of 1.0, and individual stocks are ranked accordingly on how much they deviate from the market.

      A stock that fluctuates more than the market has a beta > 1.0. If the stock moves less than the market, the stock’s beta is < 1.0. Stocks with high beta value tend to be riskier but the potential for higher returns is also high whereas stocks with low beta have less risk therefore yielding low returns.

      Therefore, beta is often used as a risk-reward measure which helps investors determine how much risk they are willing to take for the desired return. 

      How Beta is calculated?

      The covariance between the return of the stock/portfolio/fund and the return of the market must be known, as well as the variance of the market returns.

      Beta = Covariance/ Variance 

      Where, Covariance = measure of a stock’s return relative to that of the market

      Variance = Measure of how the market moves relative to its mean

      Covariance measures how two stocks move together. A positive covariance means the stocks tend to move together when their prices go up or down. A negative covariance means the stocks move opposite of each other.

      Variance, on the other hand, refers to how far a stock moves relative to its mean. For example, the variance is used in measuring the volatility of an individual stock’s price over time. Covariance is used to measure the correlation in price moves of two different stocks. 

      The formula for calculating beta is the covariance of the return of an asset with the return of the benchmark divided by the variance of the return of the benchmark over a certain period.

      Calculating the Beta with the help of an example:- 

      Let’s assume an investor, Rohan, wants to calculate the beta of Stock X as compared to the Index XYZ. Based on data over the past 10 years, Stock X and Index XYZ have a covariance of 0.044, and the variance of Index XYZ is 0.026.

      Beta of X =0.044/0.026 = 1.69

      In this case, Stock X is considered more volatile than the market as its beta of 1.69 indicates that the stock experiences 69% more volatility than the Index XYZ.

      See also: 5 Steps to analyze Mutual Funds for better Investments

      Correlation 

      Correlation is a statistical measure that tells us the degree to which two assets move in relation to each other. Correlations are used in portfolio management, computed as the correlation coefficient, which has a value that falls between -1.0 and +1.0. A perfect positive correlation means that the correlation coefficient is exactly 1 which implies that if the price of one asset moves up or down, the price of the other asset moves in the same direction. A perfect negative correlation means that two assets move in opposite directions when the correlation coefficient is -1, while a 0 correlation implies that there is no linear relationship between the assets.

      For example, Large-cap mutual funds generally have a high positive correlation to the NIFTY. 

      Correlation helps portfolio management to measure the amount of diversification among the assets contained in a portfolio. The objective is to optimize expected returns against a certain level of risk taken. Assets that have a low correlation to each other helps in reducing the amount of overall risk for a portfolio.

      Beta Correlation 

      It measures a fund’s volatility compared to that of a benchmark. It is used to evaluate how much a fund’s performance would swing compared to a benchmark.

      Calculating the Beta with the help of an example:- 

      An investor, Rakesh, wants to calculate the beta of Stock A as compared to the Index ABC. Based on data over the past 10 years, the correlation between Stock A and Index ABC is 0.88. Stock A has a standard deviation of return of 25% and Index ABC has a standard deviation of return of 36%.

      Beta of Stock A = 0.88× (0.25/0.36) =0.611

      In this case, Stock A is considered less volatile than the market as its beta of 0.611 indicates that the stock experiences 39% less volatility than the Index ABC.

      How to find the different mutual fund ratios in StockEdge?

      It’s very difficult to calculate all the above mutual fund ratios and compare before investing especially in a country like India where there are more than 2500 active schemes. So StockEdge provides all the above ratios calculated for all the mutual funds’ schemes so it becomes easy for the users to compare and analyze before investing. All you need to do is download the application click on the Mutual Fund tab, and explore. Steps to be followed:

      • Click on the M.F tab on the home screen of the application.
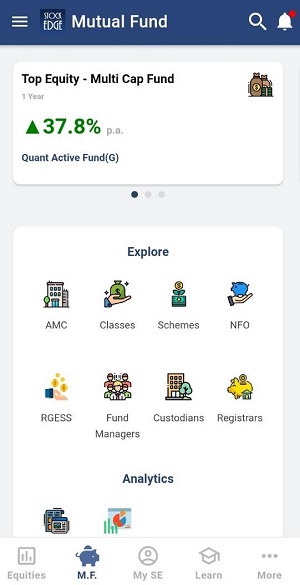
      Important Mutual Fund Ratios

      • Click on Classes and select the type (Equity, Debt, Hybrid, Others). For e.g.:- You select Equity and select “Market Cap Fund – Large & Mid Cap”.
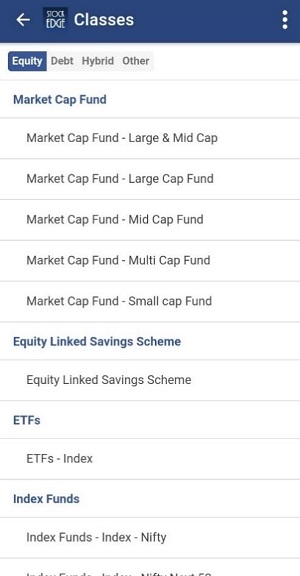
      Mutual fund - Market cap (Mutual fund ratios)

      • You can select the different schemes and can compare their mutual fund ratios like in the picture depicted below:-
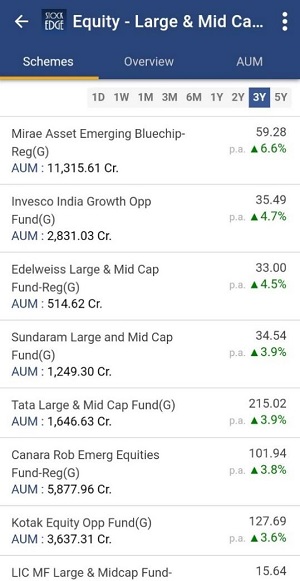
      Mutual Fund Equity (Mutual fund ratios)

      • Select the first fund and scroll towards the right to check the mutual fund ratios section. Now you can compare the ratios with other funds and schemes and use this information along with other parameters. Also, you can check the holdings of the fund by clicking on the section.
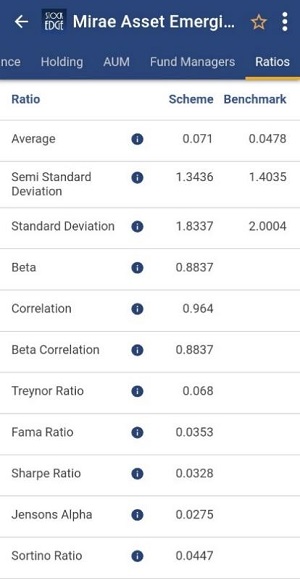
      Mutual fund ratios

      Conclusion

      So StockEdge is the only platform where you get filtered information, which helps in making your analysis faster, better, and easier within minutes. So what are you waiting to start using Stock and Mutual Fund Analytics today and become a profitable and smart trader cum investor.

      Click here to know more about the Premium offering of StockEdge.

      You can check out the desktop version of StockEdge using this link.

      Tags: betacorrelationmutual funds
      ShareTweetSend
      Subscribe On Telegram Subscribe On Telegram Subscribe On Telegram
      Previous Post

      Adani Group – Empowering India – Shaping a new future

      Next Post

      Bharti Airtel Limited- Connecting homes-Touching millions of lives

      StockEdge

      StockEdge

      StockEdge is a self-help Equity and Mutual Fund research tool. It empowers retail investors to identify investment opportunity with all the necessary data and analytics.

      Next Post
      Bharti Airtel Limited- Connecting homes-Touching millions of lives

      Bharti Airtel Limited- Connecting homes-Touching millions of lives

      Aditya Birla Group – Milestones Achieved, Miles to Go

      Aditya Birla Group - Milestones Achieved, Miles to Go

      Granules India Limited – Outperforming the Pandemic

      Granules India Limited - Outperforming the Pandemic

      Comments 5

      1. Sudhir Bhimani says:
        2 years ago

        Very good article.

        Reply
        • Ganga says:
          2 years ago

          thank you

          Reply
      2. Vivek Gadodia says:
        2 years ago

        This is really useful, very detailed and scientific

        Agar aalsi ho gaye, toh Mutual Fund Sahi Nahin Hai !

        Reply
      3. Pingback: Should we choose focused funds for our portfolio?
      4. [email protected] says:
        2 years ago

        Verygoodtknowledgefromstockedge

        Reply

      Leave a Reply Cancel reply

      Your email address will not be published. Required fields are marked *

      Contact Us
      • Timing (Mon-Sat): 10 am to 7 pm
      • Sales: +919830994463
      • Support: +919830994402
      • Club Support: +916289906895
      • Affiliate: +917003567131
      Recent Posts
      Top 5 Textile stocks
      Top 5 Textile Stocks in India: From Cotton to Cash
      multi-bagger stocks for 2025
      5 Multibagger Stocks to keep an eagle-eye for 2025
      Important Links
      • StockEdge.com
      • StockEdge Premium
      • - Quarterly Membership
      • - Annual Membership
      • StockEdge Analyst
      • StockEdge Club
      • Compare Plans
      An Initiative Of

      © 2023 Kredent InfoEdge Pvt Ltd.

      Facebook-f Twitter Instagram Linkedin-in Youtube Pinterest-p

      Get StockEdge App

      No Result
      View All Result
      • Home
      • Article Categories
        • Fundamental Analysis
        • Technical Analysis
        • Market Themes
        • StockEdge Tutorials
        • StockEdge Version Updates
      • Products
        • StockEdge Premium
        • StockEdge Pro
        • StockEdge Club
        • Compare Plans
      • Visit StockEdge.com

      © 2023 Kredent InfoEdge Pvt Ltd.