Table of Contents
In the world of stock trading, the saying “Buy Low-Sell High” holds true for value investing, but a different approach is required when it comes to intraday stock trading. With over 6000 stocks listed on the NSE and BSE, it becomes a challenge to identify which stocks are going to trend in the market. Irrespective of a bullish or bearish market scenario, you will always find some 52-week high stocks or 52-week low stocks in the broader markets.
The key to success is swiftly identifying these trending stocks and capitalizing on their momentum. This can increase the probability of correct trades identified. In today’s blog, let’s delve into the art of identifying trending stocks and effectively riding the wave of their trend.
But before we move forward with intraday trading strategies, let’s understand the basics of stock trading and the different types of trading.
What is Stock Trading?
Buying and selling shares of a company listed in the stock exchanges in order to make a profit from the price movements in stocks is known as stock trading.
For example, Buying 100 shares of SBI @ 600/share and selling them after one week @ 620/ share, making a profit of 20/share or a total profit of (20*100)= Rs. 2000 is stock trading.
Types of Trading
In the stock market, the aim of a trader is to make a profit. Right!
So, in order to do that, traders have developed different trading techniques over the years based on their risk – reward appetite and their personality. The most common ones are:
- Intraday Trading or Day Trading
- Swing Trading
- Positional Trading
In this blog, we will focus on how we can identify stocks for Intraday trading and generate trade ideas. So, let’s find out first;
What is Intraday in trading?
Intraday trading is buying and selling stock on the same day. Stock prices fluctuate during the market, and the objective of intraday traders is to make a profit and close the position by the end of the trading session. This is commonly known as Day trading.
But what is the difference between intraday trading and regular trading?
Intraday trading involves purchasing and selling stocks within the same day to capitalize on short-term price changes and generate profits. In contrast, regular trading involves acquiring and retaining stocks for longer durations, more than one day to one week or months, allowing for greater profit potential and the opportunity to benefit from additional sources of income such as dividends, bonus shares, rights issues, apart from price appreciation.
Intraday trading has several advantages compared to regular trading, let’s find out what they are?
Benefits of Intraday Trading
- Leverage: Intraday trading offers the advantage of brokers providing additional capital for stock trading, allowing traders to borrow money and increase their exposure in open positions, thus boosting profit potential. However, it’s important to note that leverage is a double-edged sword. While it can amplify profits, it also increases the risk of losses. It is crucial to familiarize oneself with the rules and regulations imposed by different brokers before engaging in leveraged trading or margin trading.
- No Overnight Risk: As intraday traders close their positions by the end of the trading day, reducing the exposure to any overnight market risk, such as unexpected news or events that can impact stock prices.
- Short Sell: Short selling of stocks in intraday trading is a strategy where you sell stocks in the cash market that you do not own with the intention of buying them back at a lower price later at the end of the day. This is only possible intraday and you can’t short-sell stock and hold the position for more than a day. However, short selling of stocks in f&o is possible to hold for more than a day or till the expiry of the futures contract.
Now, the big question is;
How to identify stocks for intraday trading?
For beginners, it is challenging to identify stocks from thousands of listed stocks in the market. Hence, we at StockEdge have a feature tab called Trending Stocks. So how does this feature work, and how can you benefit from it? Let’s find out!
In StockEdge, there is a section called Trending Stocks which you will find under Explore on the homepage. (see the image below)
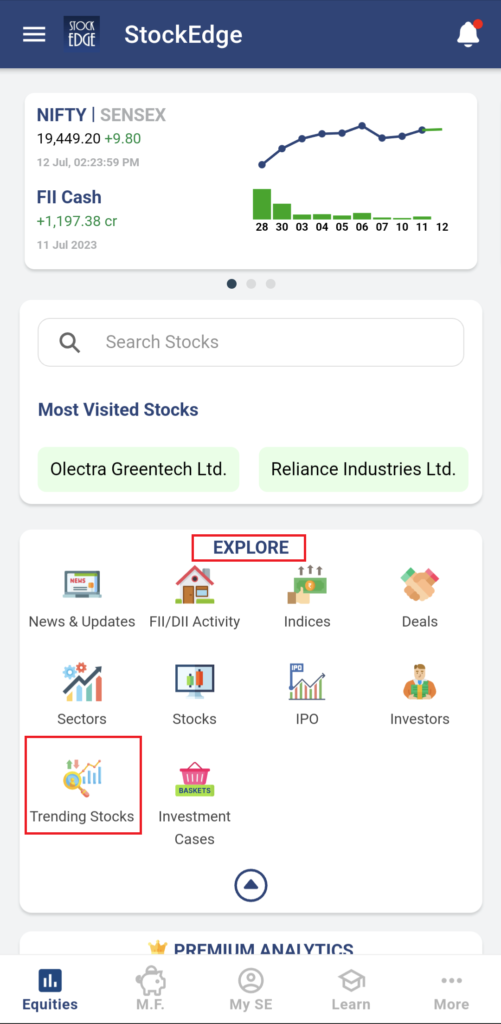
Click on the Trending Stocks icon, you will notice there are three sub sections under it. They are:
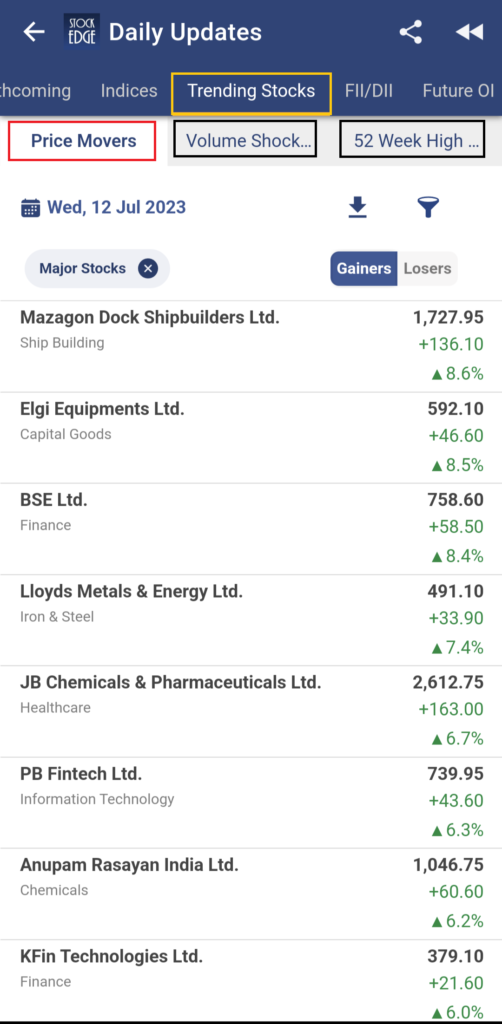
Now, let’s discuss what each subsection under the trending stocks has to offer:
Price Movers
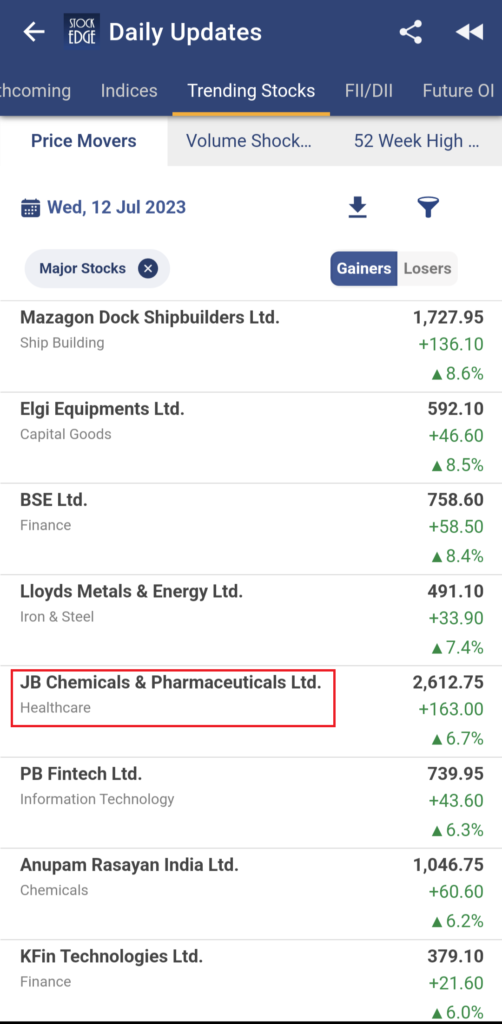
It shows the list of stocks that have at least gained more than +2% or lost more than -2% in terms of prices compared to the closing price of the previous trading day.
You can choose gainers and losers from the tab given in the right-hand corner. The list shows the stocks in descending order of the % gain or % loss (in case of Losers Tab)
Volume Shockers
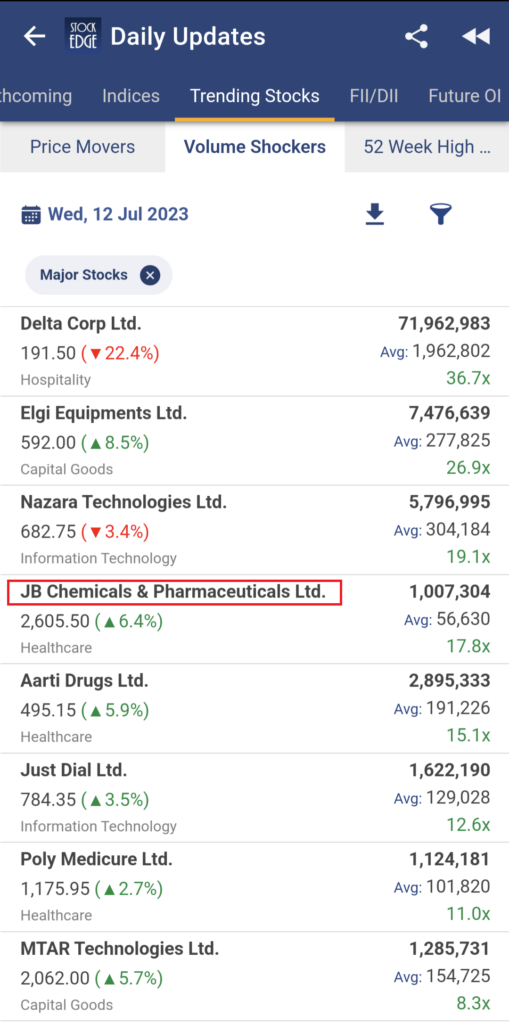
It shows the list of stocks whose today’s traded Volume is above their last 5 days’ average traded Volume. The stocks are sorted from highest Volume to lowest volume gainers based on the number of times it is higher than its 5 days’ average Volume.
52 Week High Low
It shows the list of stocks that have created new 52 week High/Low in terms of price. By default, the list shows the stock which has made fresh 52 week highs and is sorted based on the percentage of price from highest to lowest. To view the list of stocks that are making new 52 week lows, you need to simply click on the ‘Low’ tab on the top right corner of the page.
All Time High Low
It shows the list of stocks that have created new life highs or lows in terms of price. By default, the list shows the stock which has made new lifetime highs and is sorted based on the percentage of price from highest to lowest. Similarly you can view the list of stocks that are marking new lifetime lows by selecting the ‘ Low’ tab on the top right corner of the page.
Most Visited Stocks
It shows the list of top ten stocks that our users have visited the most during the day. The list of stocks is sorted in descending order based on the number of searches. It is updated at the end of the day.
Kindly note, that apart from the Most Visited Stocks, all other sections under the Trending Stocks are updated live, meaning that prices are updated every 1 minute for NSE stocks and every 5 minutes for BSE stocks.
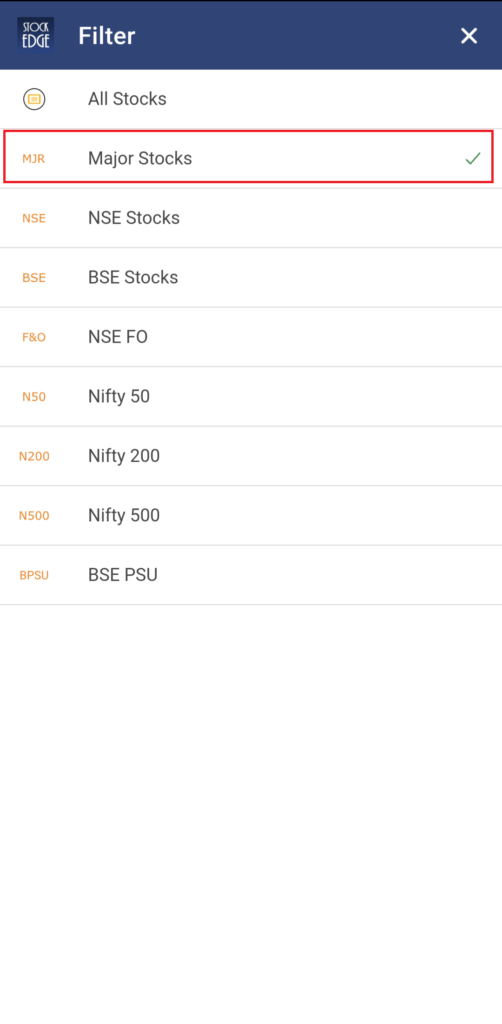
Also, by default, the list of stocks which are shown is from the major stocks, which are from Nifty 50 and Nifty 500 stocks. However, in case you want to filter out a specific basket of stocks like from Nifty 200 or only NSE listed stocks or BSE listed stock can be easily filtered out as shown in the image below:
All these features are very powerful if used correctly, carefully and at the right time. So, let’s take a practical example to identify trending stocks for intraday trading.
How to find stocks for Intraday Trading with StockEdge?
Launch the StockEdge app, click on the Trending stocks icon to see the list of Price moves. By default it shows the list of top gainers in the market. Let’s take a look at a very simple intraday trading strategy based on a 15 min candle chart.
- First select a stock from the trending stocks section and open up a chart for a 15 min time frame.
- Mark the highs and lows of the first 15 min candle and convert the chart into 5 min.
- Once the stock gives a 5 min closing above the high of the 15 min candle, enter into a long trade and vice versa if it breaks below the low of that 15 min candle.
- The risk-reward is simple: your Stop loss is the previous candle’s low on a 5 min chart and the take profit will be 1.5x of your stop loss.
- The main objective of this strategy is to ride the on going momentum in the stock and you may keep trailing your stop loss.
Let’s apply the same strategy now by taking an example of JB Chemicals and Pharmaceuticals Limited as it has appeared both Price Moves and Volume Shockers (as shown in the image below)
Now, let’s open the price chart of this stock. We have marked the first 15 min candle’s high and low and monitor it on a 5 min chart for a breakout.
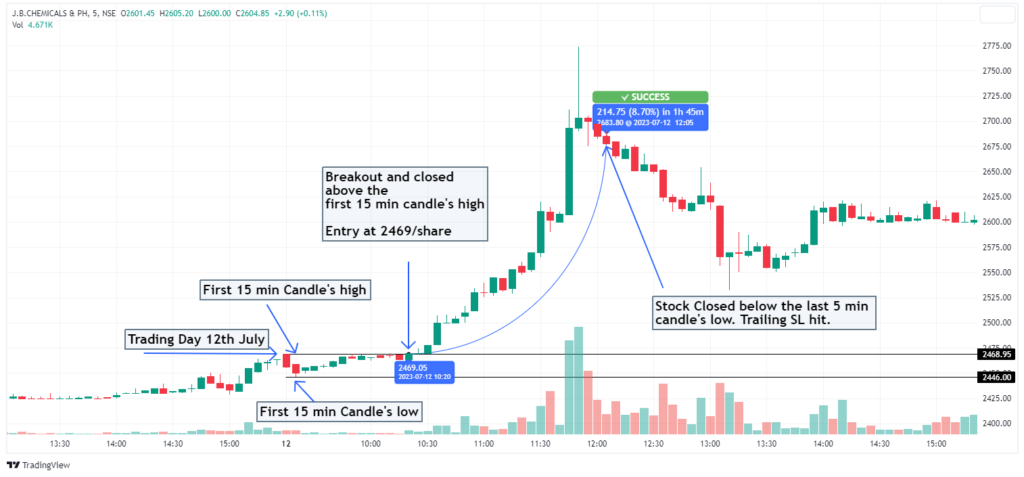
In the above chart, you can see we made a profit of 8.7% intraday by keeping trailing Stop loss of the last 5 min candle’s low on a closing basis.
A profit of more than 8% in intraday trading is quite lucrative. StockEdge is a powerful tool. It depends how you use it.
Therefore, identifying stocks for intraday trading can be easily done using the Trending Stocks feature in StockEdge. The above example shown below is not a rule by any means. Your selection criteria can differ from what has been shown in the above example. There are many other trading strategies in the market. Here are 5 Best Intraday Trading Strategies you can learn!
The Bottom Line
The steps to identify intraday stocks are fairly simple:
- Identifying price movers combined with volume shockers or 52 week high low stocks from the list of trending stocks.
- Analyze their price chart to find stocks for intraday trading that best suits your trading style.
- Always pre-defined your target and stop loss levels before entering any trade.
- Stay disciplined and maintain your predetermined targets and stop loss for every trade.
Lastly, identifying stocks for intraday trading is a valuable skill that can be significantly enhanced using StockEdge. By employing a tool that combines finding price movers with high volume and technical analysis you can increase your chances of selecting the best stocks that offer potential profits within a single trading day. Remember to focus on liquidity, volatility, and volume when evaluating potential candidates, and always conduct thorough research to understand the underlying factors influencing the stock’s performance.
Additionally, it is crucial to develop a disciplined approach to risk management, employing appropriate stop-loss orders and position sizing to protect your capital. With practice, patience, and a commitment to continuous learning, you can become adept at identifying stocks for intraday trading, opening up new opportunities for financial success in the dynamic world of the stock market.
Happy trading!


