Table of Contents
When we study the fundamentals of the company then the cash flow statement is an important statement to analyze. The cash flow statement tells us if the company is able to generate cash from its business. There are certain ratios which are used to analyze cash flow statements. Free cash flow per share is one of them. Let us discuss the Free Cash Flow per Share.
Free Cash Flow per Share (Rs)
This ratio is used to measure the company’s financial flexibility. Free cash flow per share is calculated by dividing free cash flow by the total number of shares outstanding. Free cash flow subtracts capital expenditure (CAPEX) from the company’s total operating cash flow. Therefore it reflects the actual cash flow which is available to fund asset related growth in the company.
Watch the video below on Everything you want to know about Free Cash Flow per Share:
Impact of Free Cash Flow per Share (Rs)
Free cash flow per share is used to measure the company’s ability to pay the debt, buyback, dividends and facilitate the growth of the business. This ratio can be also be used to forecast future share prices. Increase in free cash flow and low share price indicates that the share price may rise. This is because the high cash flow per share means that earning per share should be high.
See also: Why You Should Track Cash Flow Per Share
Formula:
Free Cash Flow Per Share = Free Cash Flow / Common Shares Outstanding
For example:
Let’s assume that during the fourth quarter, Company ABC reported free cash flow of Rs. 40 lakhs. During the same time frame, the company had a total of 100 lakhs shares outstanding. We calculate the company’s quarterly cash flow per share as follows:
40,00,000 / 10,000,000 = 0.4

See also: Why You Should Track Cash Flow Per Share
Stockedge App
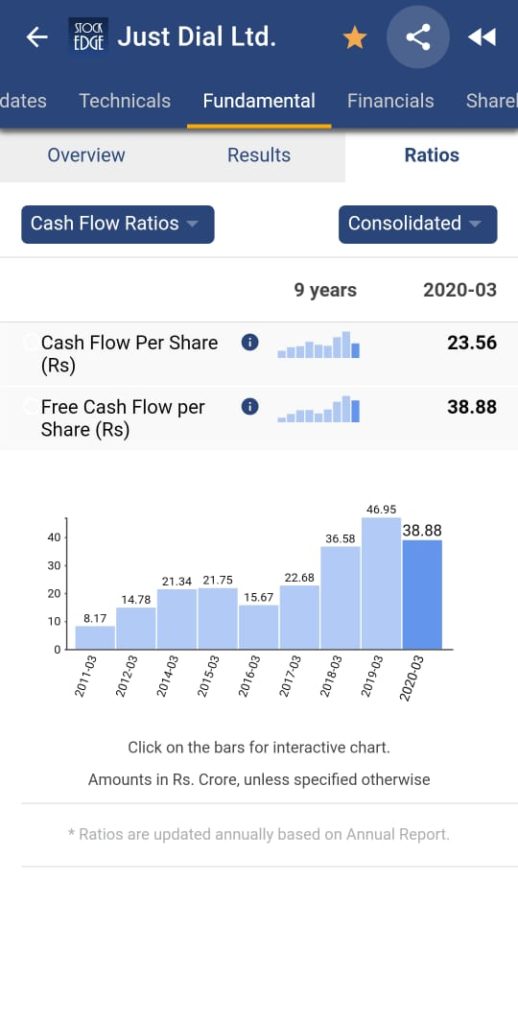
We don’t have to calculate Free Cash flow per share on our own. StockEdge app gives Free Cash flow per share of the last five years of any company listed in the stock exchange. We can look and compare Free Cash flow per share of any company and filter out stocks accordingly.
Suppose we want to look at Free Cash flow per share of Just Dial Ltd. of last 5 years. In the Fundamental tab of Just Dial Ltd., click on the fundamentals tab, we will get Ratios tab. Then in the Ratios tab click on Cash Flow Ratios, Free Cash flow per share will come of Just Dial Ltd.
Check out this ratio along with other ratios on our StockEdge Web Version.
Bottomline
Free cash flow ratio gives a better understanding of a company’s financial health as compared to P/E ratio. It indicates a better measure of a company’s performance. With a click of a button, you can see the comparison of the company’s cash flow for five years. Haven’t subscribed to stockedge yet? So what are you waiting for, subscribe immediately to use this free feature. We also have paid featured scans based on Solvency, with the help of these ready-made scans you can with the click of a button filter out good companies. These scans are part of the premium offerings of StockEdge app.
Click here to avail the premium plans on StockEdge.


Nicely explained.
Thank you