Table of Contents
Investors fancy often uses valuation parameters when it comes to studying the fundamentals of a company. A financial ratio is a representation of numerical values taken from a company’s financial statements. It helps in deciding the investible strength of a company. There are a lot of ratios which helps the investor to take investment decisions, one of such ratios is the earnings per share growth which depicts the efficiency of a company.
What is Earnings per Share Growth
EPS measures the amount of net income earned per share of stock outstanding. In other words, this is the amount of money each share of stock would receive if all of the profits were distributed to the outstanding shares at the end of the year. Earnings per share is also a calculation that shows how profitable a company is on a shareholder basis. So a larger company’s profits per share can be compared to smaller company’s profits per share. Obviously, this calculation is heavily influenced on how many shares are outstanding. Thus, a larger company will have to split its earning amongst many more shares of stock compared to a smaller company
Watch the below video to know Everything you want to know about Earnings Per Share Growth:
Factors affecting Earnings per Share Growth (%)
The company reports Earnings per Share Growth (%) after adjustment of extraordinary items (i.e. one-time income or expenses) and potential share dilution (i.e. increase in the number of potential shareholders due to an exercise of a stock option, conversion of a debenture or preference shares into equity, bonus issue, etc. Any bonus, split, conversion of debenture or preference share into equity, warrant issue, etc. must be reflected in the calculation of weighted average number of shares outstanding at the end of a period.
Kinds of EPS
There are various kinds of EPS used under different circumstances for different kinds of calculations. Thus we have Basic EPS, Diluted EPS and Cash EPS.
- Basic EPS: It is a rough measurement of a company’s profit that can be allocated to one share of its stock. It does not factor in the diluted effect of convertible securities. Basic EPS is calculated as follows: basic EPS means
Basic EPS = (Net income – Preference dividend) / Weighted average no of share outstanding
- Diluted EPS: If a company has a complex capital structure i.e. they have issued potentially dilutive securities, then diluted EPS is considered to be more precise metric than basic EPS. It takes into account all the outstanding diluted securities that could preferably be exercised and shows how such action would affect earnings per share. It can be calculated as:
Diluted EPS = {Net income – preference dividend (which are not convertible) + Interest on debenture (if such debenture is convertible)} / (Weighted average no of share outstanding + conversion of diluted securities)
- Cash EPS: Cash EPS or more commonly operating cash flow per share measures financial performance of the company. Free from non-cash items like depreciation which is included in basic EPS calculation, cash EPS may prove to be a more reliable measure of financial and operational health of the company. Higher the company’s cash EPS, better it is considered to have performed over a period. The formula for calculating the company’s cash EPS is:
Cash EPS = Operating cash flow / Diluted shares outstanding
Formula
EPS is calculated as Net profit/No of shares outstanding.
EPS growth percentage is (EPS of the current year- EPS of the prior year)/EPS of the prior year.
Suppose company A made a Net profit of 15 crores and has outstanding shares of 5 crores in 2016-2017 then EPS is 3. Now company A made a Net profit of 20 crores with same number outstanding shares of 5 crores in 2017-2018 than EPS is 4. Thus EPS of company A is 3 in Period 1 and 4 in period 2, then EPS growth percentage is (4-3)/3*100= 33.33%.
Nowadays we don’t have to calculate EPS growth (%) on our own. StockEdge gives us EPS growth (%) of the last five years of any company listed in the stock exchange. We can look and compare EPS growth (%) of any company and filter out stocks accordingly.

.
Check Out Also: Are You Making Profits From StockEdge By Using The Scans?
Example
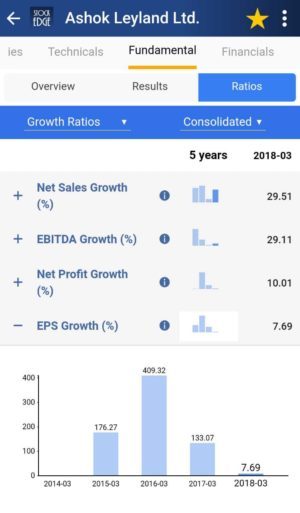
Suppose we want to look at the Earnings per Share Growth (%) of Ashok Leyland of the last 5 years. In the Fundamental tab of Ashok Leyland, click on the fundamentals tab, we will get the Ratios tab. Then in the Ratios tab click on Growth Ratios, EPS growth (%) will come of Ashok Leyland in a flicker of a second making our work simpler.
Bottomline
Eps growth percentage is an important barometer to gauge the growth and future prospects of a company. Earning per share is one of the most important variables in determining a shares price. It is a major component used in calculating valuation ratio such as Price to Earnings ratio. It is considered as the single most important variable determining the share price. It is also used in evaluating the company as it breaks down profits in per share basis. This data is easily available under ratios section of each share. This ratio is freely available to the app user which helps simplify their investment decisions.
Subscribe for free if you have not already subscribed to our StockEdge App.
If you want to know more about this then visit YouTube.


