Let’s discuss Net Sales Growth. Investors always enquire about the fundamentals of a company and the best tool to answer their queries is financial ratios. A financial ratio is a representation of selected numerical values from a company’s financial statements. Financial ratios help in deciding the financial valuation of the company. There are a lot of ratios such as sales growth ratio, Net profit margin, interest coverage ratio, etc. used for the valuation analysis of a company. Here we will discuss the Net sales Growth ratio.
You can also watch the video below to know about Everything you want to know about Net Sales Growth:
Net sales are the total sales of an organization minus the return inwards, discounts, etc. This ratio helps in checking whether the company is on a growth trajectory or not compared to the previous year. Consistent growth in sales is a measure of management’s quality and performance. Growing sales signify a growth-oriented company.

Influence of Net Sales Growth
Consistent Net sales growth is a positive measure of a management’s performance. The historical growth data helps to estimate future growth outlook. The higher the current period net sales, the higher will be the net sales growth percentage. If it is consistent over the years and there is no growth (apart from exceptional circumstances), it makes sense to invest in the company.
Exceptions Regarding Net Sales Growth
However historical data may not always be a foolproof way towards future perception as the industrial and economic conditions may vary every year, especially for the cyclical stocks.
See also: Sales Growth Ratio
Formula
- Net Sales Growth (%) = (Current period net sales- Prior period net sales)/Prior Period net sales
For Example
Suppose in 2016-17, the net sales of a company is 10 crores and in 2017-18 it is 11 crores, then net sales growth % is (11-10)/10= 10%.
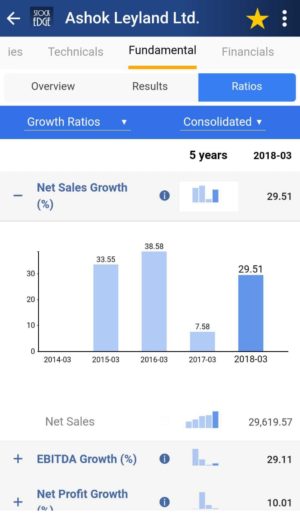
Nowadays we don’t have to calculate Net Sales Growth (%) on our own. StockEdge gives us the Net Sales Growth (%) of the last five years of any company listed in the stock exchange. We can look at and compare the Net Sales Growth (%) of any company and filter out stocks accordingly.
Suppose we want to look at the Net Sales Growth (%) of Ashok Leyland for the last 5 years. In the Fundamental tab of Ashok Leyland, click on the Fundamentals tab, and we will get the Ratios tab. Then in the Ratios tab click on growth Ratios, and we get the Sales growth in a miniscule of a second.
Bottomline
The sales growth ratio is an important barometer to understand the growth and future perception of the company. This data is easily available under the ratios section of each share free of cost. We also have paid featured scans based on Sales growth, with the help of these ready-made scans you can with the click of a button filter out good companies. These scans are part of the premium offerings of the StockEdge app.
Join StockEdge Club to get more such Stock Insights. Click to know more!
You can check out the desktop version of StockEdge.


