StockEdge.com
  • Products
    • StockEdge Premium
    • StockEdge Pro
    • StockEdge Club
    • Compare Plans
StockEdge Blog
  • Trending Stocks
  • Insights
    • All
    • Business Houses
    • Markets themes
    • Stock Insights
    Top 5 Textile stocks

    Top 5 Textile Stocks in India: From Cotton to Cash

    multi-bagger stocks for 2025

    5 Multibagger Stocks to keep an eagle-eye for 2025

    Jindal Saw – Strong Earnings Momentum Ahead

    Jindal Saw – Strong Earnings Momentum Ahead

    Kirloskar Group- A Legacy of 134 Years

    Kirloskar Group- A Legacy of 134 Years

    renewable energy stocks in india

    Top Renewable Energy Stocks in India

    blue chip stocks

    Top 5 Blue Chip Stocks to Buy and Invest in 2023

    Budget 2023: Stocks to keep an eye on

    Budget 2023: Stocks to keep an eye on

    Adani Enterprises FPO: Detailed Analysis, GMP and Review?

    Adani Enterprises FPO: Detailed Analysis, GMP and Review?

    Top 5 Defence Stocks to Invest in India

    Top 5 Defence Stocks to Invest in India

  • Technical Analysis
    Chart Patterns – Holy grail of Stock Market Analysis

    Chart Patterns – Holy grail of Stock Market Analysis

    StockEdge Version Update : 9.0

    StockEdge Version Update : 9.0

    Beat the street with Sector Rotation Strategy

    Beat the street with Sector Rotation Strategy

    StockEdge Version Update 8.2

    StockEdge Version Update 8.2

    Derivative Analytics

    An Insightful Research Tool For Derivative Analytics

    Introducing Put-Call Ratio a Derivative Indicator in the Market

    Introducing Put-Call Ratio a Derivative Indicator in the Market

    A Powerful Technical Indicator Beta & Beta Scans

    A Powerful Technical Indicator Beta & Beta Scans

    Technical Analysis using Edge Charts

    Technical Analysis using Edge Charts

    adaptive relative strength and static relative strength scans

    What is Adaptive Relative Strength & Static Relative Strength Scans?

  • Fundamental Analysis
    • All
    • Cash Flow Ratios
    • Efficiency ratios
    • Growth Ratios
    • Liquidity Ratios
    • Return Ratios
    • Solvency ratios
    • Valuation Ratios
    high dividend paying stocks

    Identifying High Dividend Paying Stocks

    Understanding the Importance of creating Fundamental Scans

    Understanding the Importance of creating Fundamental Scans

    Using My Combination Scan to Identify best in an Industry

    Using My Combination Scan to Identify best in an Industry

    Cost Income ratio

    Cost to Income Ratio(%)

    Cost of Liability

    Cost of Liabilities (%)

    Operating Cost to Assets Ratio (%)

    Operating Cost to Assets Ratio (%)

  • StockEdge Tutorials
    StockEdge Club: An Exclusive Investors Hub & Analytics platform

    StockEdge Club: An Exclusive Investors Hub & Analytics platform

    FII/DII Data: Leading Indicators of Stock Market

    FII/DII Data: Leading Indicators of Stock Market

    Chart Patterns – Holy grail of Stock Market Analysis

    Chart Patterns – Holy grail of Stock Market Analysis

    StockEdge Version Update : 9.0

    StockEdge Version Update : 9.0

    Powerful Investment Themes for Retail Investors

    Powerful Investment Themes for Retail Investors

    Beat the street with Sector Rotation Strategy

    Beat the street with Sector Rotation Strategy

    StockEdge Version Update 8.3

    StockEdge Version Update 8.3

    StockEdge Version Update 8.2

    StockEdge Version Update 8.2

    Using Investor Portfolios Section to track Big Bulls like Rakesh Jhunjhunwala

    Using Investor Portfolios Section to track Big Bulls like Rakesh Jhunjhunwala

  • Mutual Fund
    Top 5 Mutual Funds for 2022 where you can start your SIP

    Top 5 Mutual Funds for 2022 where you can start your SIP

    What are Value Funds and its Advantages?

    What are Value Funds and its Advantages?

    thematic funds

    Thematic Funds : Everything you need to know

    Understanding Sector Funds and their Benefits to our Portfolio

    Understanding Sector Funds and their Benefits to our Portfolio

    Are Dividend Yield Funds a good option to invest in?

    Are Dividend Yield Funds a good option to invest in?

    What are Contra Funds and their advantages?

    What are Contra Funds and their advantages?

    Trending Tags

    No Result
    View All Result
    • Trending Stocks
    • Insights
      • All
      • Business Houses
      • Markets themes
      • Stock Insights
      Top 5 Textile stocks

      Top 5 Textile Stocks in India: From Cotton to Cash

      multi-bagger stocks for 2025

      5 Multibagger Stocks to keep an eagle-eye for 2025

      Jindal Saw – Strong Earnings Momentum Ahead

      Jindal Saw – Strong Earnings Momentum Ahead

      Kirloskar Group- A Legacy of 134 Years

      Kirloskar Group- A Legacy of 134 Years

      renewable energy stocks in india

      Top Renewable Energy Stocks in India

      blue chip stocks

      Top 5 Blue Chip Stocks to Buy and Invest in 2023

      Budget 2023: Stocks to keep an eye on

      Budget 2023: Stocks to keep an eye on

      Adani Enterprises FPO: Detailed Analysis, GMP and Review?

      Adani Enterprises FPO: Detailed Analysis, GMP and Review?

      Top 5 Defence Stocks to Invest in India

      Top 5 Defence Stocks to Invest in India

    • Technical Analysis
      Chart Patterns – Holy grail of Stock Market Analysis

      Chart Patterns – Holy grail of Stock Market Analysis

      StockEdge Version Update : 9.0

      StockEdge Version Update : 9.0

      Beat the street with Sector Rotation Strategy

      Beat the street with Sector Rotation Strategy

      StockEdge Version Update 8.2

      StockEdge Version Update 8.2

      Derivative Analytics

      An Insightful Research Tool For Derivative Analytics

      Introducing Put-Call Ratio a Derivative Indicator in the Market

      Introducing Put-Call Ratio a Derivative Indicator in the Market

      A Powerful Technical Indicator Beta & Beta Scans

      A Powerful Technical Indicator Beta & Beta Scans

      Technical Analysis using Edge Charts

      Technical Analysis using Edge Charts

      adaptive relative strength and static relative strength scans

      What is Adaptive Relative Strength & Static Relative Strength Scans?

    • Fundamental Analysis
      • All
      • Cash Flow Ratios
      • Efficiency ratios
      • Growth Ratios
      • Liquidity Ratios
      • Return Ratios
      • Solvency ratios
      • Valuation Ratios
      high dividend paying stocks

      Identifying High Dividend Paying Stocks

      Understanding the Importance of creating Fundamental Scans

      Understanding the Importance of creating Fundamental Scans

      Using My Combination Scan to Identify best in an Industry

      Using My Combination Scan to Identify best in an Industry

      Cost Income ratio

      Cost to Income Ratio(%)

      Cost of Liability

      Cost of Liabilities (%)

      Operating Cost to Assets Ratio (%)

      Operating Cost to Assets Ratio (%)

    • StockEdge Tutorials
      StockEdge Club: An Exclusive Investors Hub & Analytics platform

      StockEdge Club: An Exclusive Investors Hub & Analytics platform

      FII/DII Data: Leading Indicators of Stock Market

      FII/DII Data: Leading Indicators of Stock Market

      Chart Patterns – Holy grail of Stock Market Analysis

      Chart Patterns – Holy grail of Stock Market Analysis

      StockEdge Version Update : 9.0

      StockEdge Version Update : 9.0

      Powerful Investment Themes for Retail Investors

      Powerful Investment Themes for Retail Investors

      Beat the street with Sector Rotation Strategy

      Beat the street with Sector Rotation Strategy

      StockEdge Version Update 8.3

      StockEdge Version Update 8.3

      StockEdge Version Update 8.2

      StockEdge Version Update 8.2

      Using Investor Portfolios Section to track Big Bulls like Rakesh Jhunjhunwala

      Using Investor Portfolios Section to track Big Bulls like Rakesh Jhunjhunwala

    • Mutual Fund
      Top 5 Mutual Funds for 2022 where you can start your SIP

      Top 5 Mutual Funds for 2022 where you can start your SIP

      What are Value Funds and its Advantages?

      What are Value Funds and its Advantages?

      thematic funds

      Thematic Funds : Everything you need to know

      Understanding Sector Funds and their Benefits to our Portfolio

      Understanding Sector Funds and their Benefits to our Portfolio

      Are Dividend Yield Funds a good option to invest in?

      Are Dividend Yield Funds a good option to invest in?

      What are Contra Funds and their advantages?

      What are Contra Funds and their advantages?

      Trending Tags

      No Result
      View All Result
      StockEdge Blog
      Home Tutorials
      debt to equity ratio

      Debt To Equity Ratio: Definition, Formula & Examples

      StockEdge by StockEdge
      October 29, 2018
      Reading Time: 5 mins read
      5k
      VIEWS
      Share on FacebookShare on TwitterShare On WhatsApp

      Table of Contents

      • Total Debt to Equity Ratio
      • Importance of Total Debt to Equity Ratio:
          • See also: How To Identify Stocks To Avoid For Investment?
      • Debt to Equity Ratio Formula:
      • For example:
      • Debt-Equity ratio (Leverage) Scans
      • Bottomline

      Every investor’s investment decision majorly looks for companies which have low debt in their books, as such companies normally stand out in adverse macro scenarios.  This ratio indicates how much is the company leveraged itself for the working of its business. Total Debt to Equity Ratio is one of the important Solvency ratios. Let us discuss it:

      Total Debt to Equity Ratio

      The D/E Ratio measures a company’s financial leverage. This ratio is calculated by dividing a company’s total debt by its net worth. The total debt consists of the company’s long term and short term borrowings which is reported under Non-Current and Current liabilities respectively. It indicates how much debt a company is using to finance its assets. If the D/E ratio is less than 1 then the company is expected to be financially strong as assets will be more than liabilities but if it’s more than 1 then its expected to be highly leveraged thus solvency will be questionable as liabilities will be higher than assets. Higher debt to equity ratio is preferable if the business is unique and dynamic or monopolistic in nature and doing exceptionally well.

      Watch the video below to Everything you want to know about Debt Equity Ratio:

      Importance of Total Debt to Equity Ratio:

      High Debt to Equity ratio indicates that the company has been aggressive in financing the growth with debt. This indicates a high level of risk. It may also result in volatile earnings as a result of an increase in interest expense. If it continues to rise then such company gets impacted more when macros turn adverse like weakening rupee or rising interest rates. Having said that, we also need to check whether the same sector companies have the same high debt to equity ratio or not. The ratio varies from sector to sector. For example, the Real estate sector will have a high debt to equity ratio compared to the Information Technology Sector.

      See also: How To Identify Stocks To Avoid For Investment?

      Debt to Equity Ratio Formula:

      The formula for calculating the Debt to Equity ratio is:

      Debt to Equity ratio= Total Debt(Long term and Short term Borrowings)/ Total Equity(Equity share capital and Reserves or other Equity)

      For example:

      Company ABC’s short term debt is Rs.10 Lac and its Long term Debt is Rs.5 Lac, its total shareholder’s equity accounts for Rs.4 Lac and its reserves amount to Rs.6 Lac then using the formula of Debt to Equity ratio {(10+5)/(4+6)} we get 1.5 times or 150%

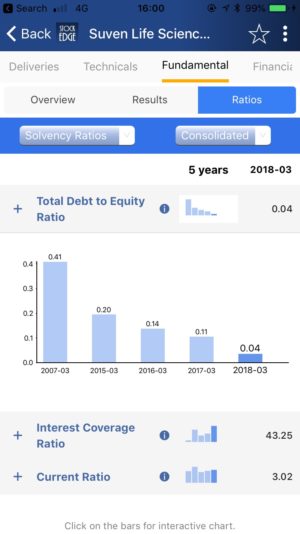
      With Stockedge App we don’t have to calculate Debt to Equity ratio on our own. StockEdge gives us the Debt to Equity ratio of the last five years of any company listed in the stock exchange. Thus we can look and compare the ratio of any company and filter out stocks accordingly. It helps us to filter out even those companies which do not have debt at all or have near zero debt comparatively.

      Suppose we want to look at Debt to Equity ratio of Suven Life Sciences Ltd. For last 5 years then in the Fundamental tab of Suven Life Sciences Ltd, click on the fundamentals tab, we will get Ratios tab.  Then in the Ratios tab click on the Solvency Ratios, we will get Debt to Equity ratio of Suven Life Sciences Ltd.
      debt to equity ratio

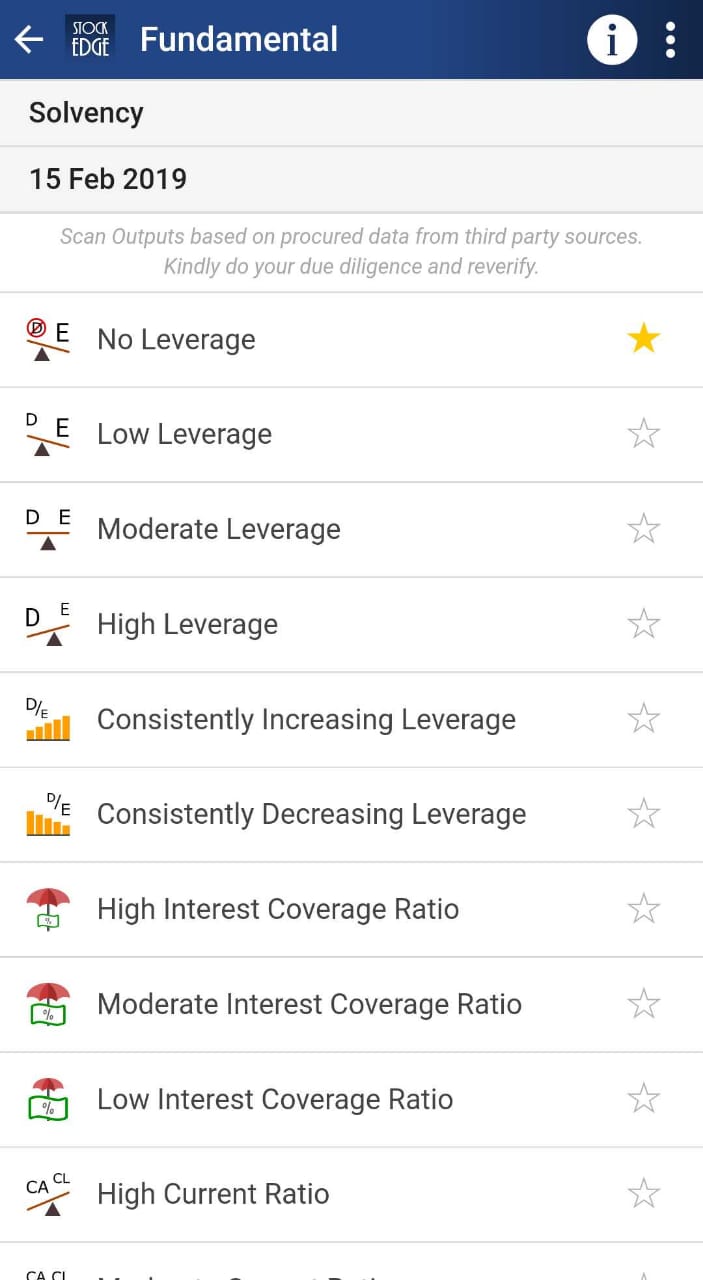
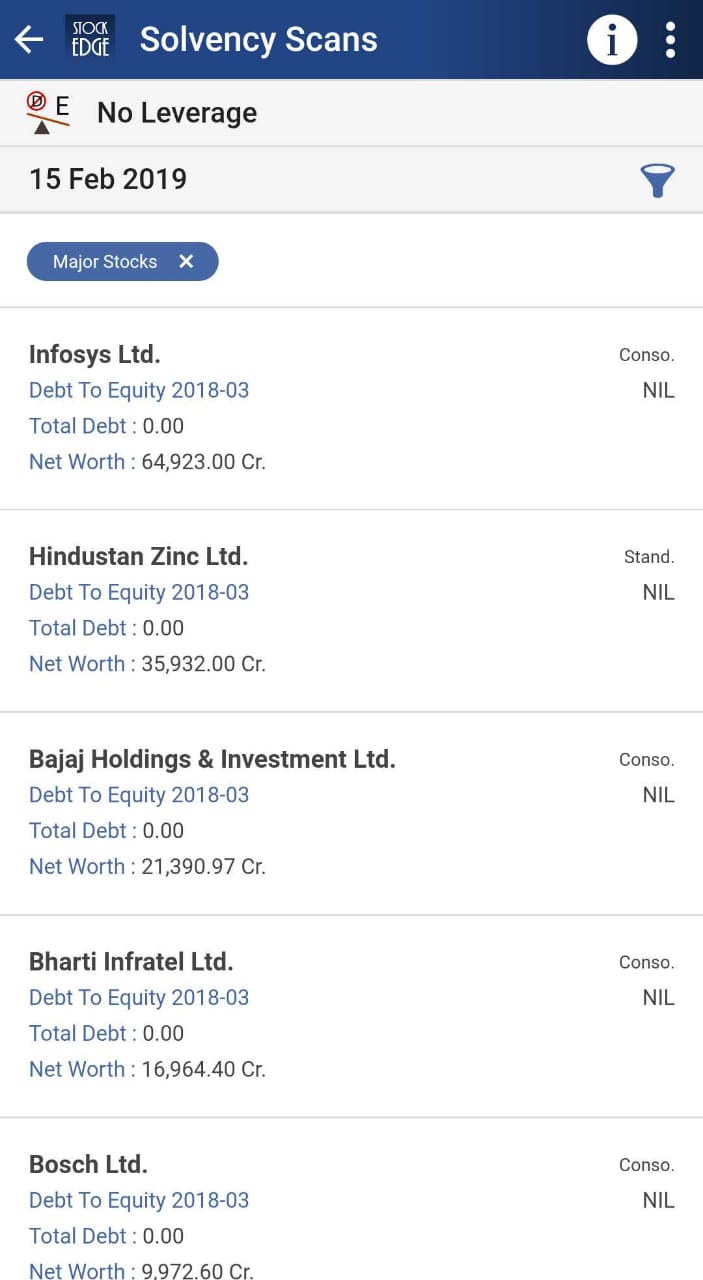
      Debt-Equity ratio (Leverage) Scans

      Using these scans with the click of a button you can identify companies with no debt, with low debt, with moderate debt and with high debt.

      Bottomline

      Debt to Equity ratio is a useful financial ratio as it is used to measure the Company’s financial leverage. It is used to measure the company’s ability to repay its obligations. This ratio is available with every stock under stockEdge app for free. Thus check peers for understanding whether a high Debt to Equity ratio is really a bad investment or not. Thus if you have not downloaded this app till now then you are missing on your investment opportunity. Download this app right now and enjoy all these scans.

      Click here to know more about the Premium offering of StockEdge.

      You can check out the desktop version of StockEdge using this link.

      Tags: Debt to Equity Ratiofinancial leverageSolvency RatiosStockEdge
      ShareTweetSend
      Subscribe On Telegram Subscribe On Telegram Subscribe On Telegram
      Previous Post

      Interest Coverage Ratio: How to calculate & Definition

      Next Post

      DIWALI DOUBLE DHAMAKA LAUNCH VERSION 4.0

      StockEdge

      StockEdge

      StockEdge is a self-help Equity and Mutual Fund research tool. It empowers retail investors to identify investment opportunity with all the necessary data and analytics.

      Next Post
      DIWALI DOUBLE DHAMAKA LAUNCH VERSION 4.0

      DIWALI DOUBLE DHAMAKA LAUNCH VERSION 4.0

      Book Value per share

      Book Value (BV) Per Share

      Operating Income growth

      Operating Income Growth(%) Ratio

      Comments 2

      1. buninqueinfoshare ya Hiralal Bopalkar says:
        3 years ago

        Nicely explained with an example, Value-added article.

        Reply
        • Ganga says:
          3 years ago

          Thanks for your kind words

          Reply

      Leave a Reply Cancel reply

      Your email address will not be published. Required fields are marked *

      Contact Us
      • Timing (Mon-Sat): 10 am to 7 pm
      • Sales: +919830994463
      • Support: +919830994402
      • Club Support: +916289906895
      • Affiliate: +917003567131
      Recent Posts
      Top 5 Textile stocks
      Top 5 Textile Stocks in India: From Cotton to Cash
      multi-bagger stocks for 2025
      5 Multibagger Stocks to keep an eagle-eye for 2025
      Important Links
      • StockEdge.com
      • StockEdge Premium
      • - Quarterly Membership
      • - Annual Membership
      • StockEdge Analyst
      • StockEdge Club
      • Compare Plans
      An Initiative Of

      © 2023 Kredent InfoEdge Pvt Ltd.

      Facebook-f Twitter Instagram Linkedin-in Youtube Pinterest-p

      Get StockEdge App

      No Result
      View All Result
      • Home
      • Article Categories
        • Fundamental Analysis
        • Technical Analysis
        • Market Themes
        • StockEdge Tutorials
        • StockEdge Version Updates
      • Products
        • StockEdge Premium
        • StockEdge Pro
        • StockEdge Club
        • Compare Plans
      • Visit StockEdge.com

      © 2023 Kredent InfoEdge Pvt Ltd.