Table of Contents
Sortino Ratio is a ratio that measures the risk-adjusted return or the performance of the investment with respect to the downward deviation. It is a variation of the Sharpe Ratio which differentiates downside volatility from the total volatility (upside + downside) by using the asset’s standard deviation of negative portfolio returns. The Sortino ratio is calculated by taking an investment or portfolio’s return and subtracting the risk-free rate and then dividing that amount by the asset’s downside deviation. For an investor, the downward volatility is a major concern. So this ratio gives a better picture of the downside risk associated with the fund.
Sortino Ratio Formula
Sortino Ratio is calculated by:
Sortino ratio = (R) – Rf /SD
where,
(R): Expected return
Rf: Risk-free rate of return
SD: Standard Deviation of the negative Asset Return.
Let’s understand it with the help of an example.
| Fund A | Fund B | |
| Annualized Return | 14% | 10% |
| Risk free rate of return | 4% | 4% |
| Standard deviation of the negative asset return | 6% | 4% |
| Sortino Ratio | 1.67 | 1.5 |
Consider Fund A has an annualized return of 14% and a downside deviation of 6%. Similarly, Fund B has an annualized return of 10% and a downside deviation of 4%. The risk-free rate is 4 percent. The Sortino ratios for both funds would be calculated as:
Mutual Fund A Sortino = (14% – 4%) / 6% = 1.67.
Mutual Fund B Sortino = (10% – 4%) / 4% = 1.5.
Pros and Cons to the Sortino Ratio
The Sortino ratio can be a better choice by properly rewarding portfolios that have a positive skew in their performance distributions.
Example: Calculation of the Sortino Ratio
Let’s say we have the following set of annual returns:
15%, 6%, 11%, -7%, 10%, -3%, 9%, -7%, 16%, and 20%
Step 1
Average Annual Return = 70%/10 =7%
The average annual return is the sum of these (which is 70%) divided by the number of returns (ten), which is 7%.
Let’s say the target return is the expected annualized returns of the Nifty 500, or about 6%.
Therefore, the excess return is 1% (7% – 6%).
Step 2
Next we calculate the downside deviation. We take into account the negative values, which are -7%, -3%, and -7%.
Step 3
We square these values:
-7%^2 = 0.0049
-3%^2 = 0.0009
-7%^2 = 0.0049
The average of these downside deviations is the sum divided by the number of returns (ten):
0.0049 + 0.0009 + 0.0049 = 0.0107
0.0107 / 10 = 0.00107 = 0.107%
Step 4
Next we calculate the target downside deviation. This is the square root of the answer from step 3:
√.0107 = 0.0327
Step 5
Finally, calculating the Sortino ratio, which is done by taking the excess return from step one and dividing by the target downside deviation from step four.
0.01 / 0.0327 = 0.305
Most of the asset classes give Sortino ratios of between 0.2 to 0.3 over the long-run.
A higher Sortino ratio in mutual funds is considered to be better. So from the given result, the Sortino ratio indicates that it is generating more return per unit of the given risk and has a greater chance of avoiding large losses.
With more than 2500 schemes in India, selecting the right mutual fund to invest in can be a tough task, especially for people with no or little knowledge. These individuals can use tools like the Sortino Ratio to evaluate or compare mutual funds.
How to find the Sortino Ratios of different mutual funds in StockEdge?
You can find the Sortino Ratios of different mutual funds easily online in our StockEdge application or the web version. StockEdge provides all the important tools and information for its users to analyze and invest in Indian mutual funds. Sortino Ratio can act as a tool of evaluation, but it can’t be considered as the only parameter.
To analyze all the important factors of any mutual fund, one should use other measuring instruments as well. For that, all you need to do is just download the application, select the Mutual Fund tab, and explore. Steps to be followed:
- Click on the M.F tab on the home screen of the application.
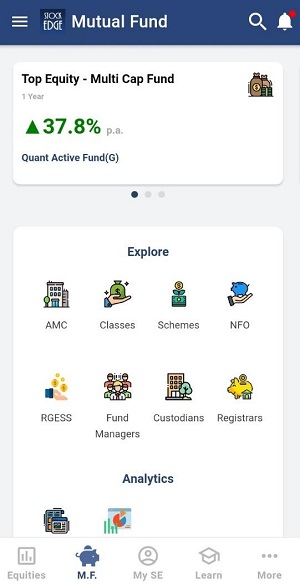
- Click on Classes and select the type (Equity, Debt, Hybrid, Others). For e.g.:- You select Equity and select “Market Cap Fund – Large & Mid Cap”.
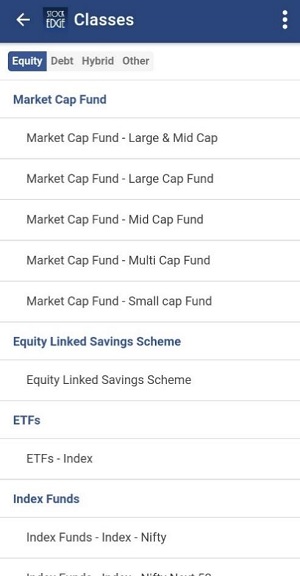
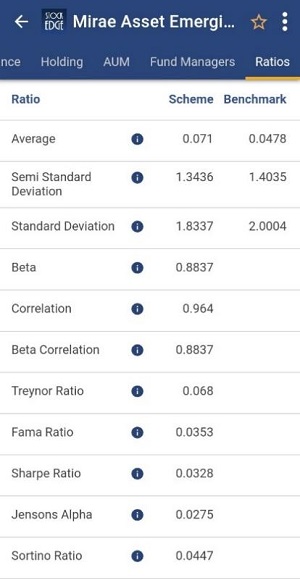
- You can select the different schemes and can compare their Sortino Ratio like in the picture depicted below:-

- Select the first fund and scroll towards the right to check the ratios section. Now you can compare the ratios with other funds and schemes and use this information along with other parameters. Also, you can check the holdings of the fund by clicking on the section.
Conclusion
So StockEdge is the only platform where you get filtered information, which helps in making your analysis faster, better, and easier within minutes. So what are you waiting for start using Stock and Mutual Fund Analytics today and become a profitable and smart trader cum investor.
Click here to know more about the Premium offering of StockEdge
You can check out the desktop version of StockEdge.


