StockEdge.com
  • Products
    • StockEdge Premium
    • StockEdge Pro
    • StockEdge Club
  • Stories
StockEdge Blog
  • Trending Stocks
  • Insights
  • Technical Analysis
  • Fundamental Analysis
  • StockEdge Tutorials
  • Mutual Fund
No Result
View All Result
  • Trending Stocks
  • Insights
  • Technical Analysis
  • Fundamental Analysis
  • StockEdge Tutorials
  • Mutual Fund
No Result
View All Result
StockEdge
Home Tutorials Technical Tutorials
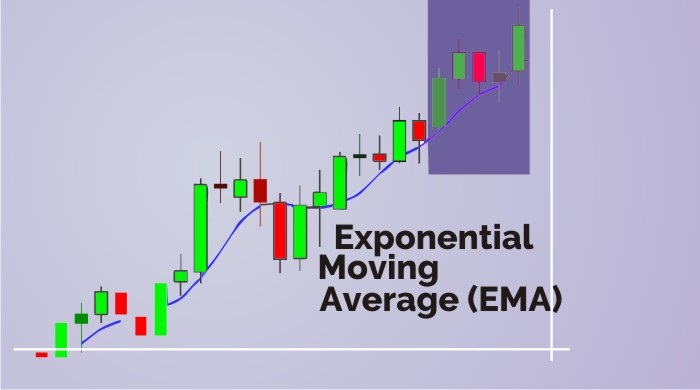
A graphical representation of stock market data in the form of candlestick bars. Green and red bars represent the rise and fall in stock prices respectively. A blue line, representing the exponential moving average (ema), is overlaid on the candlestick bars showing the average trend.

Exponential Moving Average (EMA)

StockEdge by StockEdge
November 20, 2023
Reading Time: 7 mins read
7.7k
VIEWS
Share on FacebookShare on XShare On WhatsApp

Table of Contents

  • What is Exponential Moving Average?
  • Using Exponential Moving Average in StockEdge App:
    • Example 1: Close Crossing 200 EMA from Below:
    •  
    • Example 2: 100 EMA Crossing 200 EMA from Above:
    • Example 3: 5 EMA Crossing 20 EMA from Below:

Exponential Moving Average (EMA) is a type of moving average that has a greater weight and has more significance on the recent price data.

It is also known as the “Exponentially Weighted Moving Average”.

Exponential Moving Average has more significance on the change in the recent prices than the Simple Moving Average.

Let us discuss this indicator in details:

What is Exponential Moving Average?

Exponential Moving Average (EMA) is as same as the Simple Moving Average(SMA) in terms of identifying trend direction over a specified period of time.

SMA only calculates the average price of data but EMA applies weight to the more current price data.

As it applies more weight to the current price data EMA follow prices more closely than SMA.

Suppose we are calculating the EMA for 9 periods, then the most recent price will get more weight than the previous prices.

The calculation of 9 days EMA will be: –

Exponential Moving Average (EMA) = (P1*9) + (P2 * 8) + (P3 * 7) + ………+ (P9 * 1) / (9+8+7+6+5+4+3+2+1)

Where,

P1 is the most recent price

P2 is the last day price

P3 is the 3 days ago price and so on

To know more about Exponential Moving Average, watch the video below on StockEdge EMA Scan Tutorial:

Using Exponential Moving Average in StockEdge App:

We have discussed about the basics of EMA, now let us discuss how to use this technical indicator to filter out stocks for trading:

In StockEdge there are many Exponential Moving Average scans available for filtering out stocks for trading:

Let us discuss a few of these scans:

Example 1: Close Crossing 200 EMA from Below:
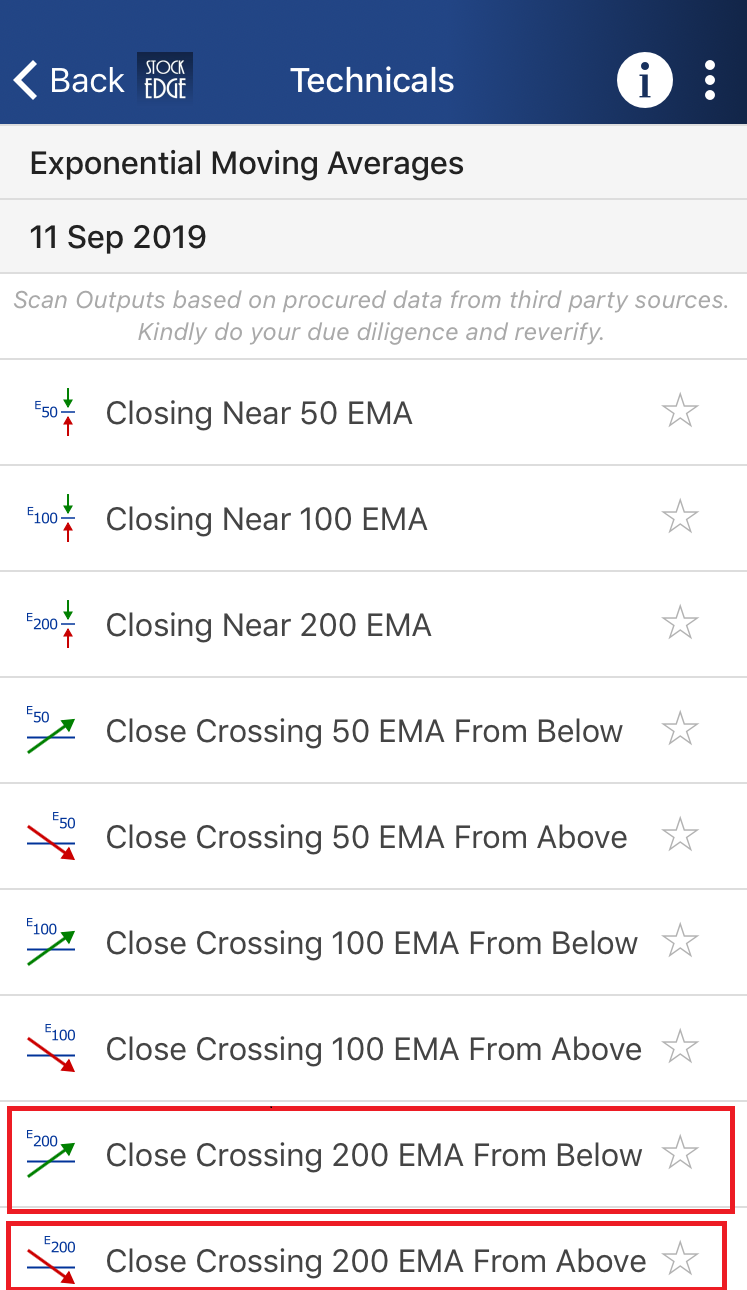
This is a screenshot of a list of stock technical analysis outputs. The list is divided into sections with red and green arrows indicating the direction of the trend. The list includes information about the exponential moving average (ema) and the closing price of the stock.

This is a bullish scan which indicates that the 200 days EMA has crossed the price from below.

When the EMA crosses the prices from below it indicates that the stock has turned bullish and when the EMA crosses the price from above like the Close Crossing 200 EMA from Above scan it indicates that the stock has turned bearish.

After clicking on this scan you can see a list of stocks which has fulfilled these criteria:
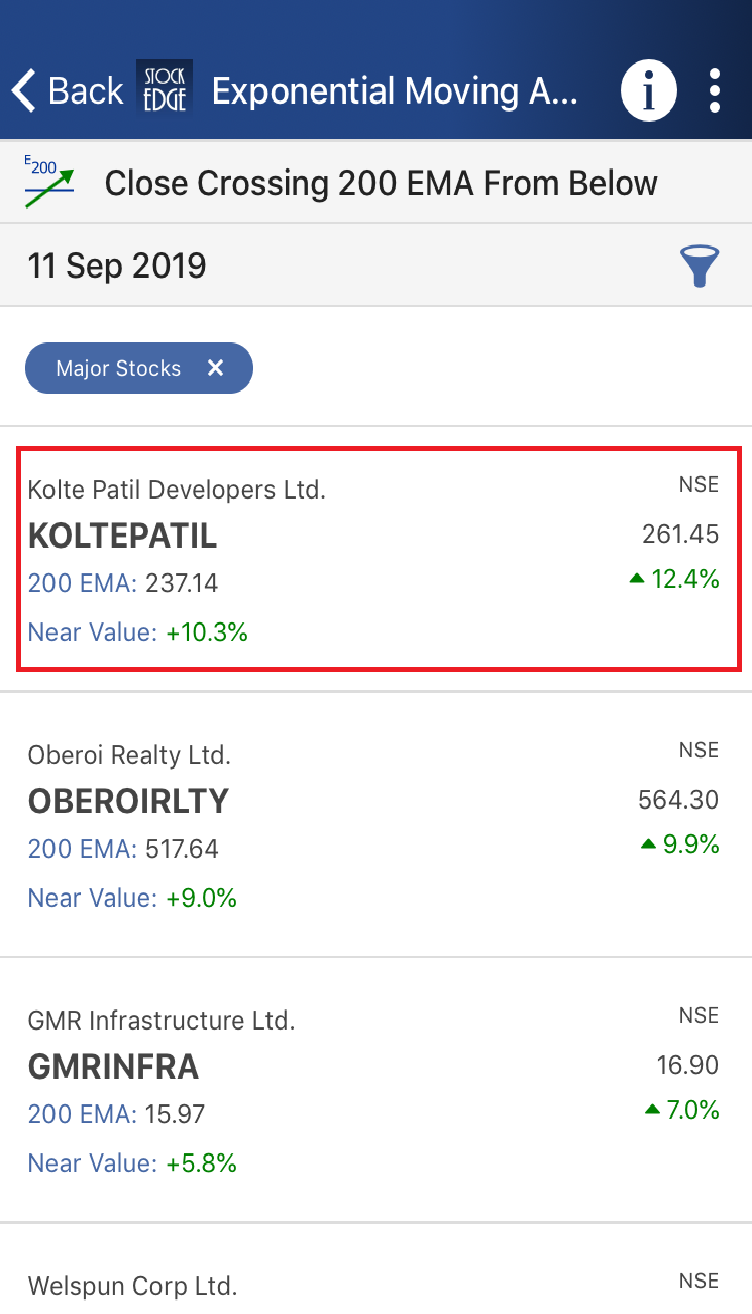
Exponential moving average on stockedge.

In StockEdge you will get the technical chart with EMA plotted by clicking on the name of stock as shown below:
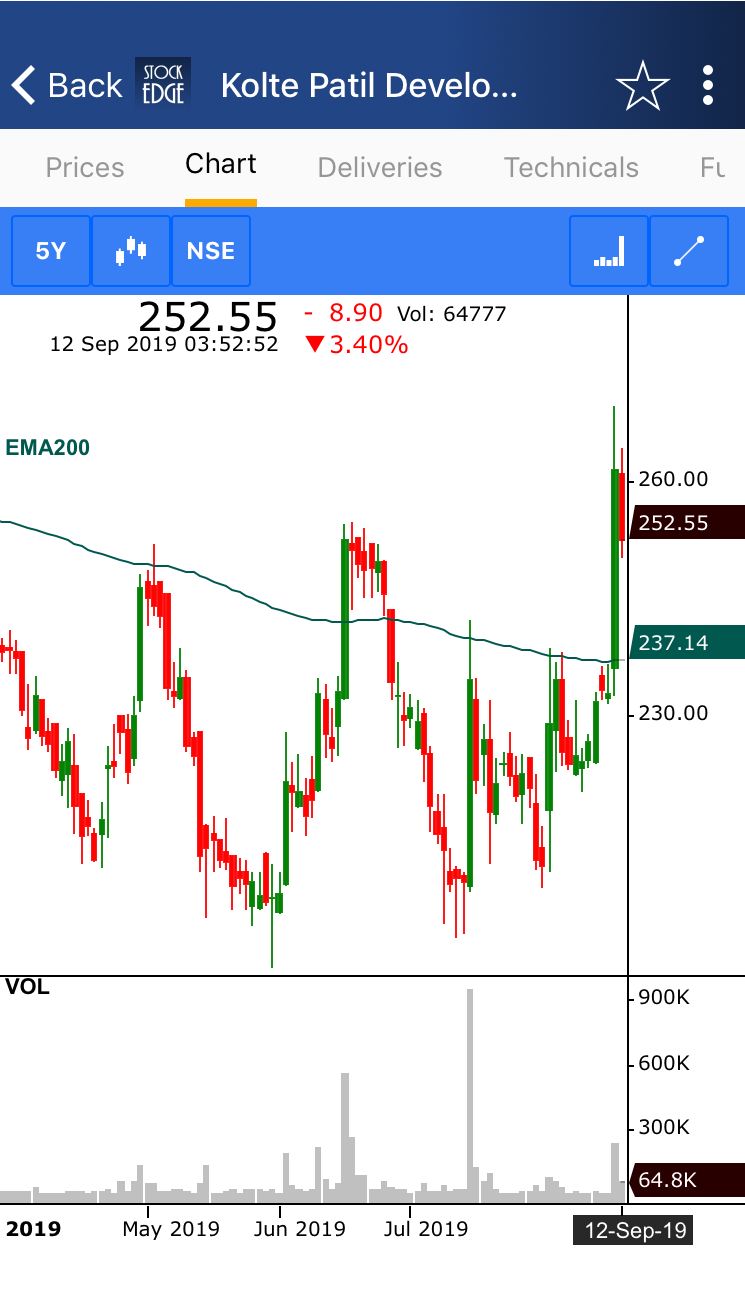
“a stock chart for kolte patil developers showing the stock price over time. ”


Example 2: 100 EMA Crossing 200 EMA from Above:
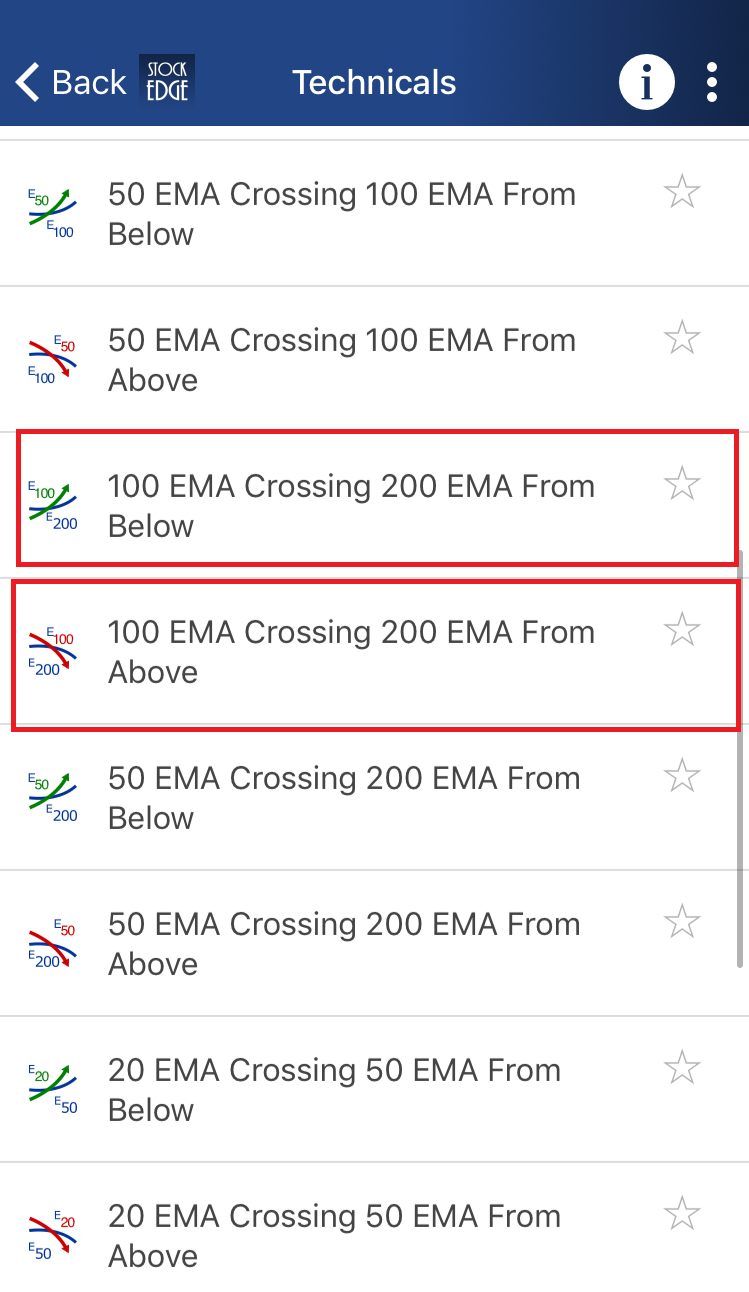
A screenshot of a list of technical indicators with red boxes around some of the items.

A trader can also get buy and sell signals from the crossovers of the smaller period EMA and longer period EMA.

This is a bearish scan which indicates that the 100 days EMA is crossing 200 days EMA from above.

If a smaller period EMA crosses longer period EMA from above, it means bearish reversal may take place and if a smaller period EMA from below like the 100 EMA Crossing 200 EMA from Below scan, it means bullish reversal may take place.

After clicking on this scan you can see a list of stocks which has fulfilled these criteria:
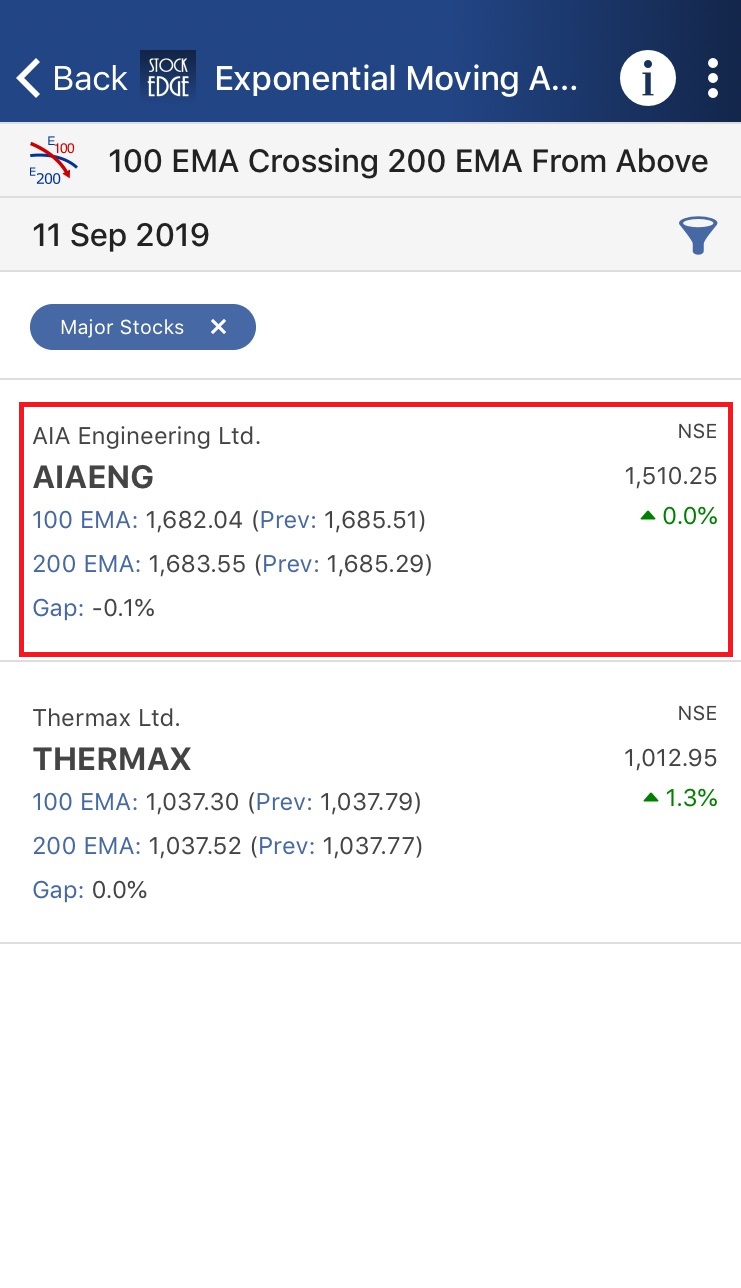
Screenshot of a stock market app ( stockedge)showing the performance of two companies

In StockEdge you will get the technical chart with EMA plotted by clicking on the name of stock as shown below:
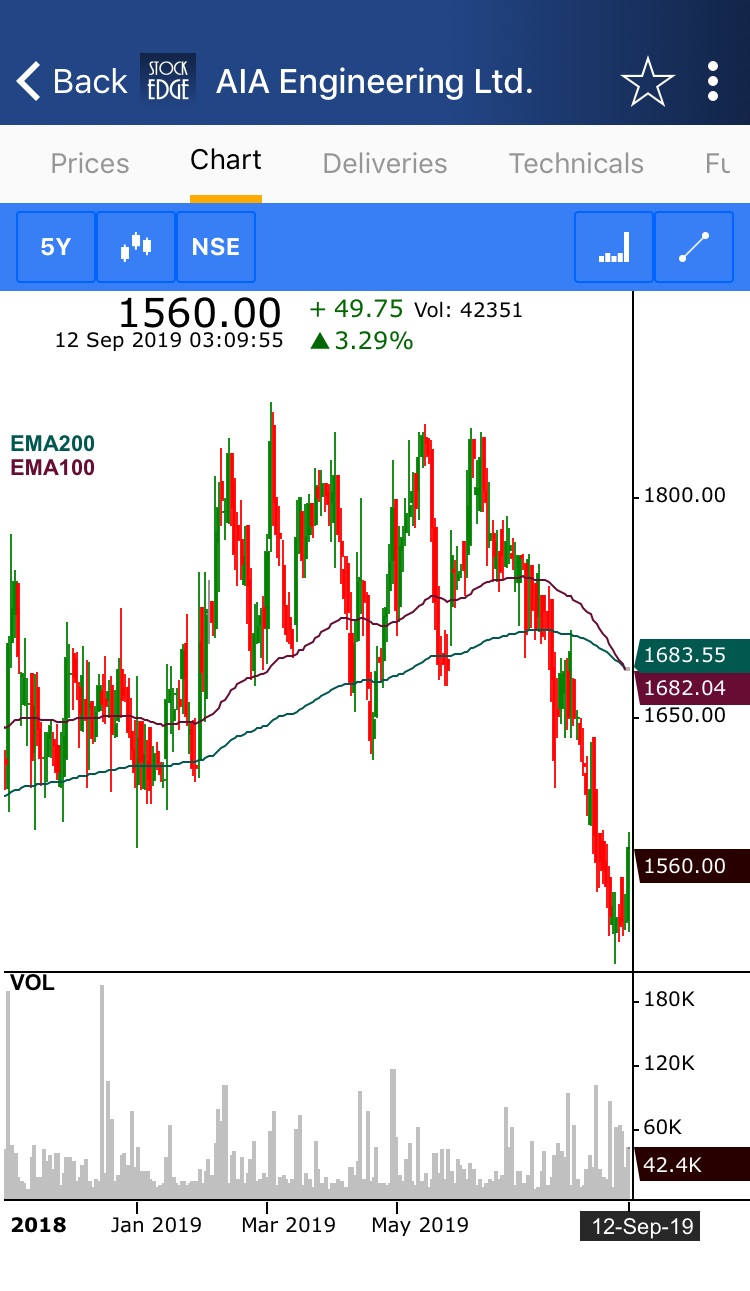
A stock chart for aia engineering ltd. Showing a decline in stock price over time.

Example 3: 5 EMA Crossing 20 EMA from Below:
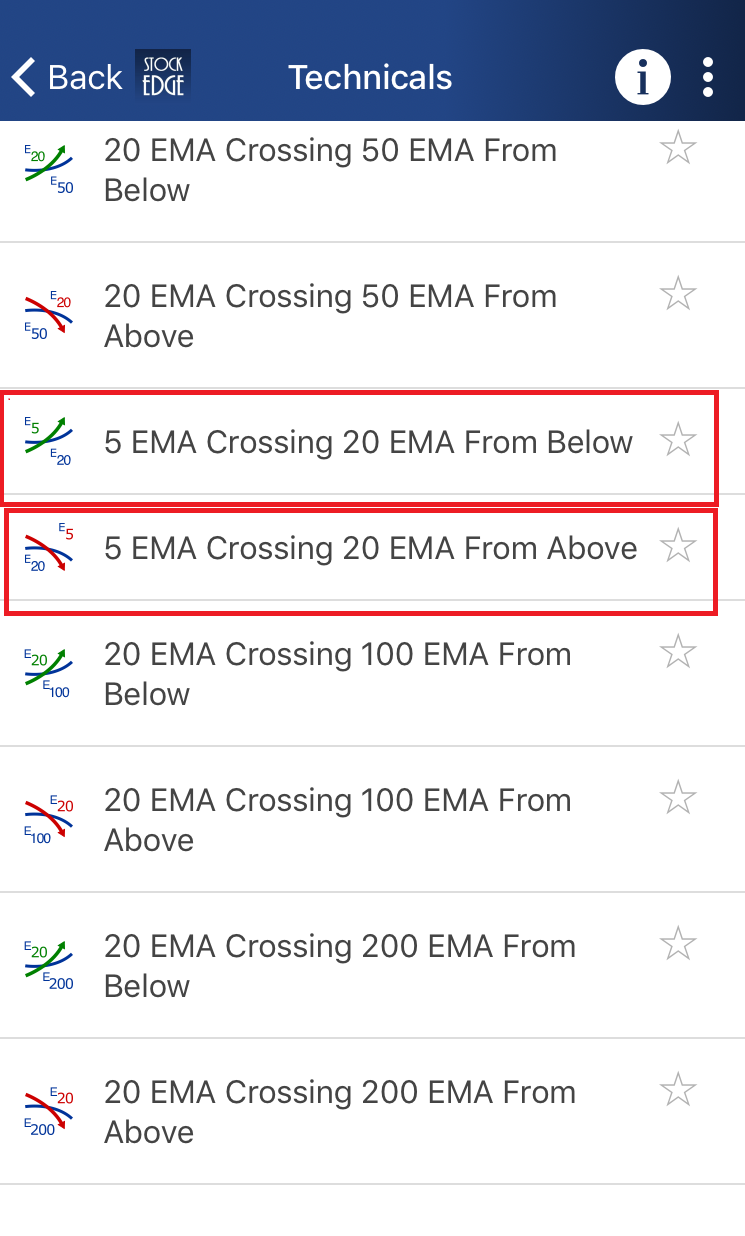
A screenshot of a list of technical indicators with red and green arrows and stars

This is a bullish scan which indicates that 5 days EMA is crossing 20 days EMA from below.

If the shorter period crosses longer period from below, it indicates a bullish reversal may take place and if shorter period crosses longer period from above just like the 5 EMA Crossing 20 EMA from Above scan it means a bearish reversal may take place.

After clicking on this scan you can see a list of stocks which has fulfilled these criteria:
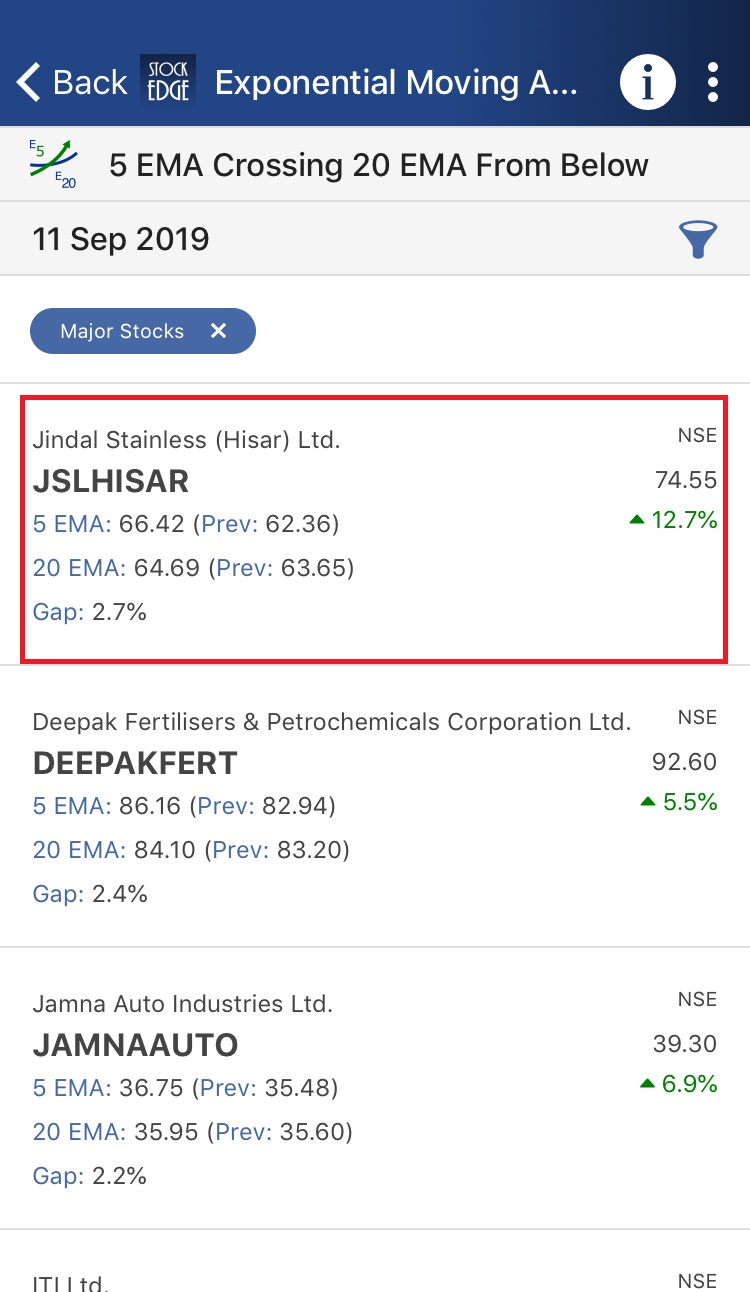
A screenshot of stcokedge app showing exponential moving averages o ffive  different stocks over a period of time.

In StockEdge you will get the technical chart with EMA plotted by clicking on the name of stock as shown below:
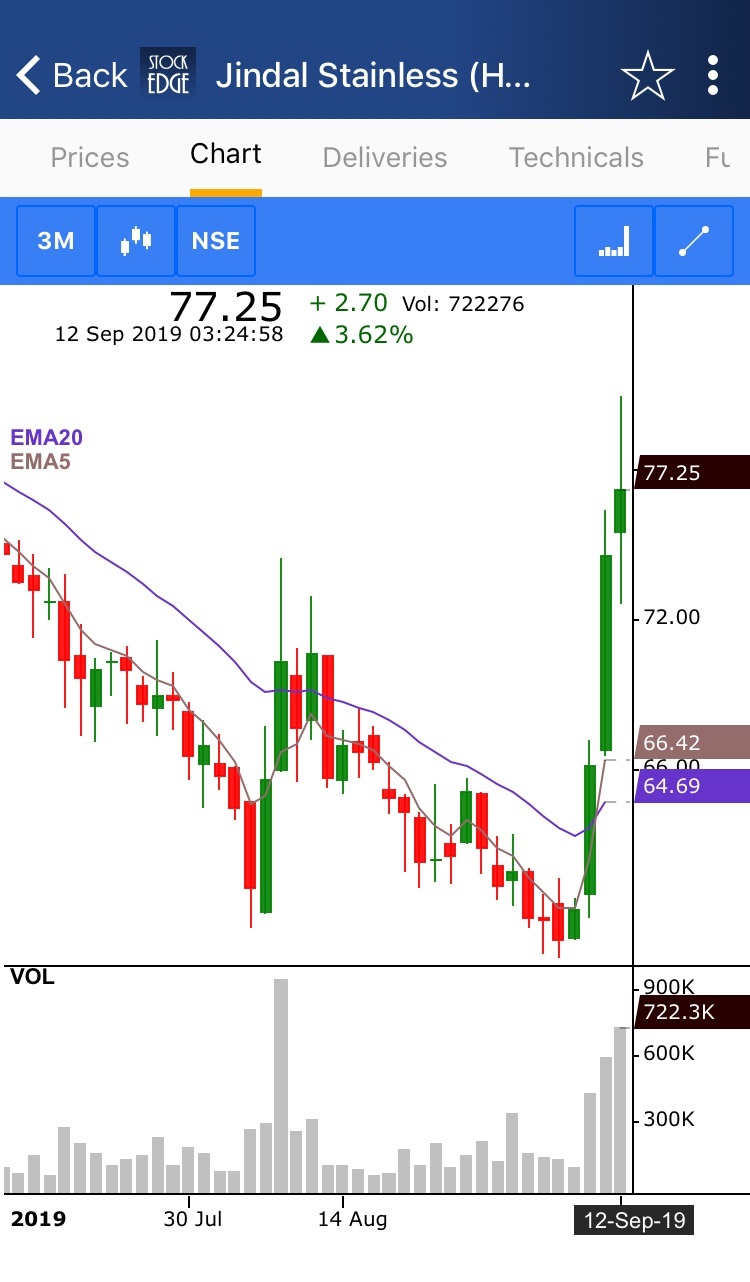
A candlestick chart of jindal stainless ltd. In national stock exchange showing the trend of stock price from july 2019 to september 2019.

Check Out Also: Simple Moving Average (SMA)

Above are examples of the EMA scans that generates buy and sell signals and also give us a list of the stock which fulfils the criteria of the scans for that particular day.

You can filter out the stocks and can trade accordingly using these scans.

Exponential Moving Average scans is one of the free tool offered by StockEdge App which you can download from the Play Store.

Interactive charts are only available for paid subscribers. You can check out our subscriber plans from here.

To have a comprehensive idea of Exponential Moving Average, StockEdge.com.

Tags: technical analysisTechnical indicatorsTechnical scans
ShareTweetSend
Open A Zero Brokerage Account In Kotak Open A Zero Brokerage Account In Kotak Open A Zero Brokerage Account In Kotak
Previous Post

Relative Strength Index (RSI)

Next Post

How to use Money Flow Index (MFI)?

StockEdge

StockEdge

StockEdge is a self-help Equity and Mutual Fund research tool. It empowers retail investors to identify investment opportunity with all the necessary data and analytics.

Next Post
How to use money flow index (mfi)?

How to use Money Flow Index (MFI)?

What is commodity channel index (cci)?

What is Commodity Channel Index (CCI)?

A line graph representing the average directional index (adx) on a blue background. The line graph is red and green in color. The x-axis is not labeled, but the y-axis is labeled with numbers from 0 to 100. The line graph has a downward trend at the beginning, then an upward trend towards the end.

How to Use Average Directional Index (ADX)

Comments 2

  1. Avatar of jayadev hiremath Jayadev Hiremath says:
    2 years ago

    Sir most useful information thanks.

  2. Avatar of jayadev hiremath Jayadev Hiremath says:
    2 years ago

    Sir most useful information thanks. yes sir I was not knowing about Ema but using.

Disclaimer

StockEdge (Kredent InfoEdge Pvt. Ltd.) is a SEBI-registered Research Analyst (RA) entity (SEBI Registration No: INH300007493). The information provided in this article is for educational and informational purposes only and should not be considered as an offer to buy or sell any securities or investment products.

The stocks, securities, and investment instruments mentioned herein are not recommendations under SEBI (Research Analysts) Regulations, 2014. Readers are advised to conduct their own due diligence and seek independent financial advice before making any investment decisions.

Investments in securities markets are subject to market risks. Please read all related documents carefully before investing. Investing in Equity Shares,
Derivatives, Mutual Funds, or other instruments carry inherent risks, including potential loss of capital. StockEdge (Kredent InfoEdge Pvt. Ltd.) does not provide any guarantee or assurance of returns on any investments. Past performance is not indicative of future performance.

Contact Us
  • Timing (Mon-Sat): 10 am to 7 pm
  • Sales: +919830994463
  • Support: +919830994402
  • Club Support: +916289906895
  • Affiliate: +917003567131
Recent Posts
3 Telecom Stocks in India
Top 3 Telecom Stocks in India
India VIX explained
NSE India VIX: Concept & Strategy
Important Links
  • StockEdge.com
  • StockEdge Premium
  • StockEdge Pro
  • StockEdge Club
  • Compare Plans
An Initiative Of
Logo of KREDENT INFOEDGE with SEBI Registration no.

© 2025 Kredent InfoEdge Pvt Ltd.

Facebook-f Twitter Instagram Linkedin-in Youtube Pinterest-p Whatsapp Telegram

Get StockEdge App

No Result
View All Result
  • Home
  • Article Categories
    • Trending Stocks
    • Insights
    • Technical Analysis
    • Fundamental Analysis
    • StockEdge Tutorials
    • Mutual Fund
  • Stories
  • Products
    • StockEdge Premium
    • StockEdge Pro
    • StockEdge Club
  • Visit StockEdge.com

© 2024 Kredent InfoEdge Pvt Ltd.

40% Off on StockEdge Annual Plans