Table of Contents
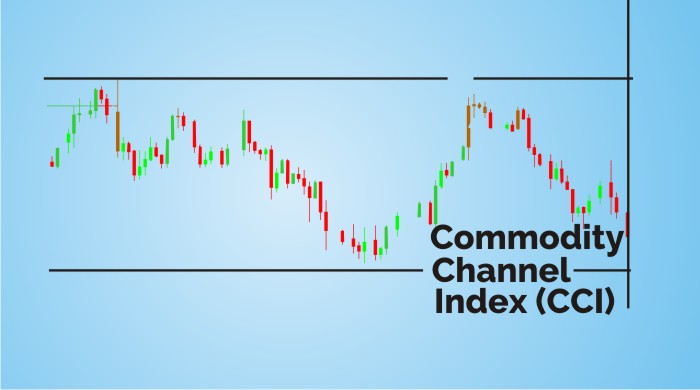
Commodity Channel Index (CCI) is an oscillator originally introduced by Donald Lambert in 1980.
CCI measures a security’s variation from the statistical mean.
The CCI is calculated as the difference between the typical price of a commodity and its simple moving average, divided by the mean absolute deviation of the typical price.
What is Commodity Channel Index?
The Commodity Channel Index (CCI) is a momentum-based oscillator used to help determine when an investment vehicle is reaching a condition of being overbought or oversold.
It is also used to assess price trend direction and strength.
This information allows traders to determine if they want to enter or exit a trade, refrain from taking a trade, or add to an existing position.
The CCI is primarily used for spotting new trends, watching for overbought and oversold levels, and spotting weakness in trends when the indicator diverges with price.
When the CCI moves from negative or near-zero territory to above 100, that may indicate the price is starting a new uptrend.
Once this occurs, traders can watch for a pullback in price followed by a rally in both price and the CCI to signal a buying opportunity.
The same concept applies to an emerging downtrend. When the indicator goes from positive or near-zero readings to below -100, then a downtrend may be starting.
This is a signal to get out of longs or to start watching for shorting opportunities
To know more about Commodity Channel Index, you can watch the video below:
Using Commodity Channel Index In StockEdge App:
Above we have discussed the commodity channel index, now let us discuss how we can use this technical indicator to filter out stocks for trading:
In StockEdge there are many Commodity Channel Index scans available for filtering out stocks for trading:
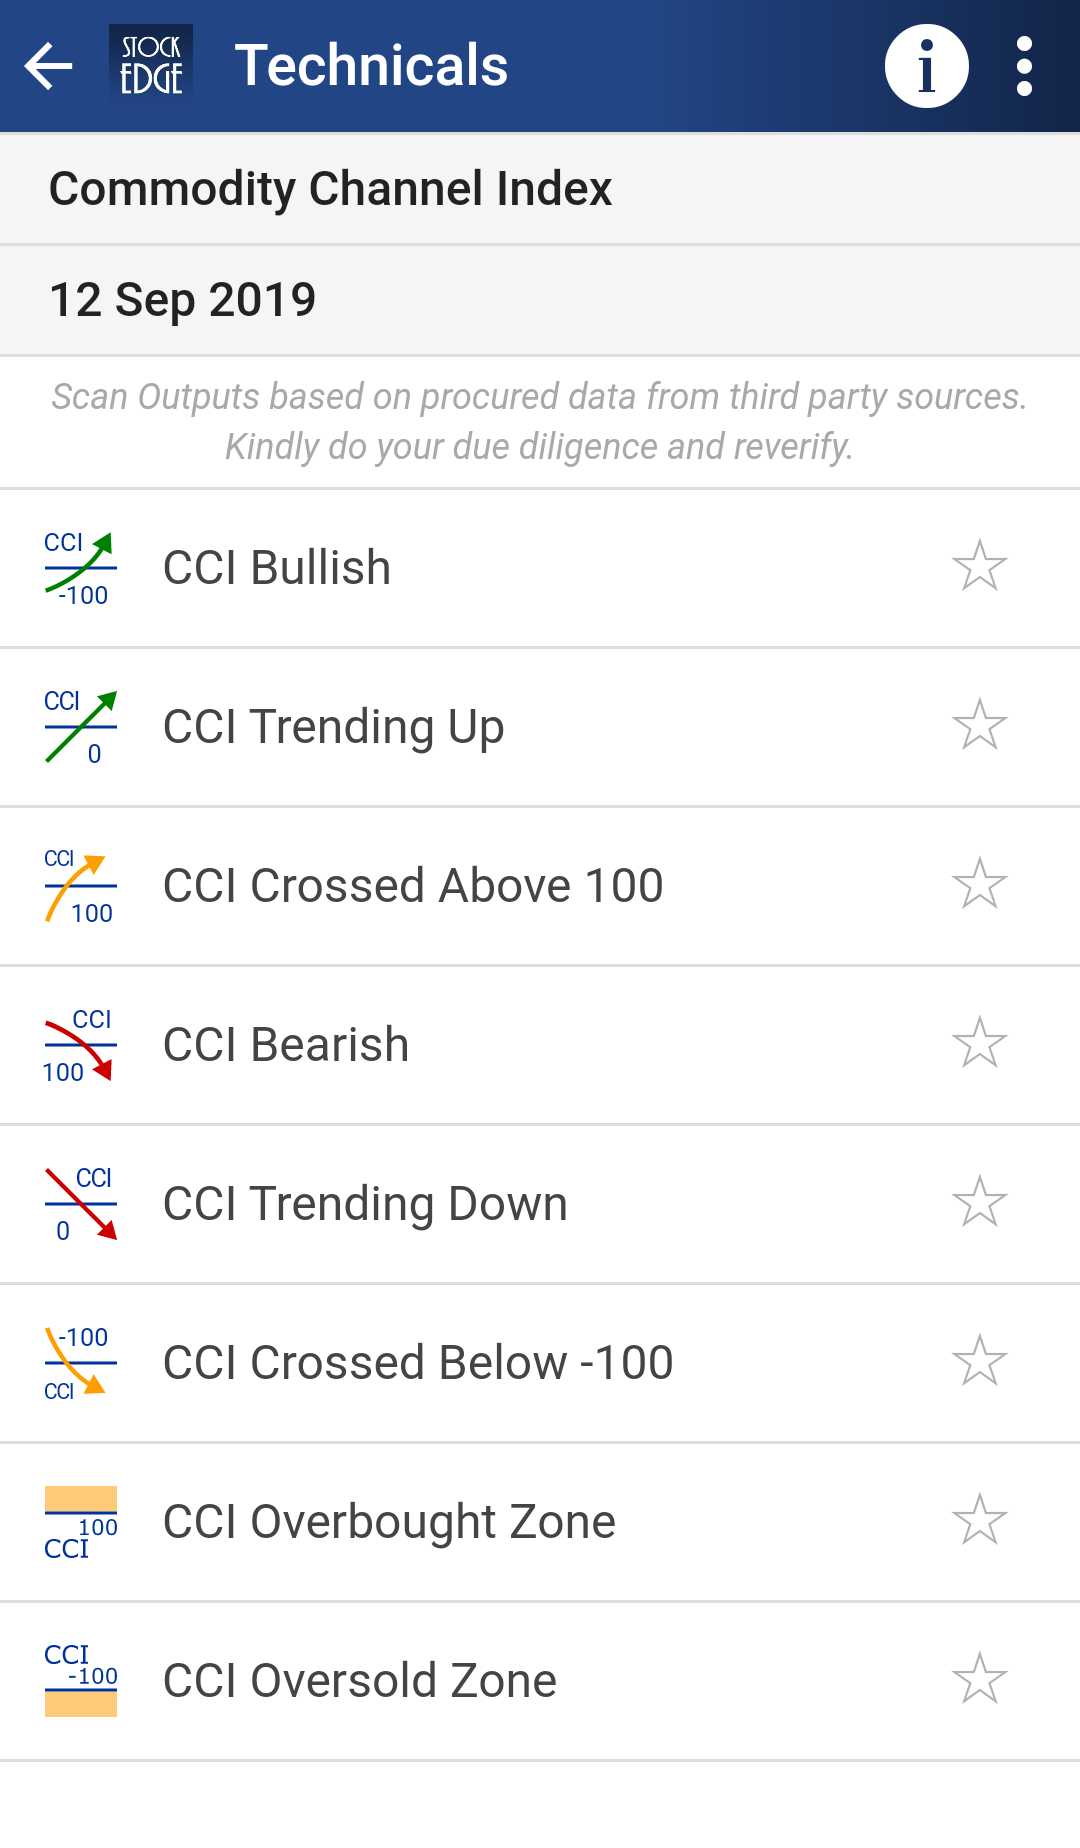
Let us discuss in details about some of these scans:
CCI Bullish :
It is a bullish scan which indicates that the CCI value has crossed above -100 indicating that the stock is exiting the oversold zone.
Following is a list of stocks which has fulfilled this criterion on 12th September:
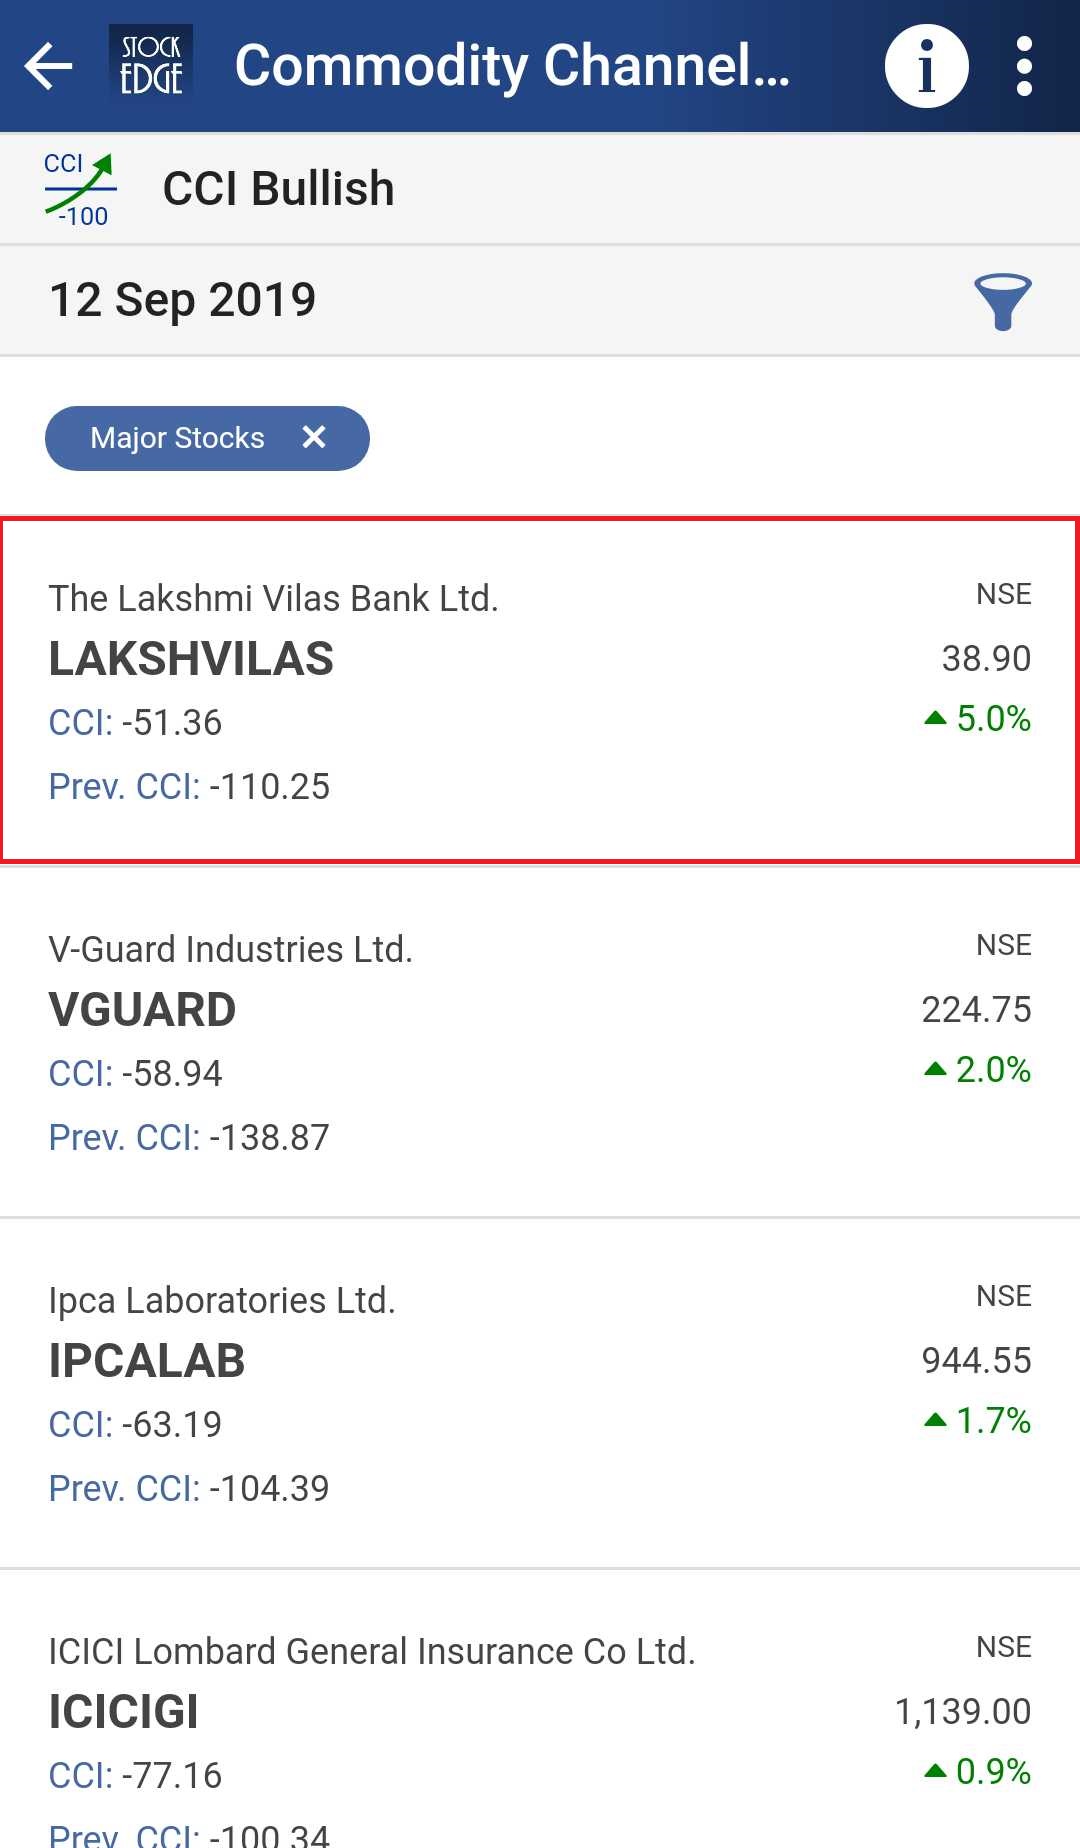
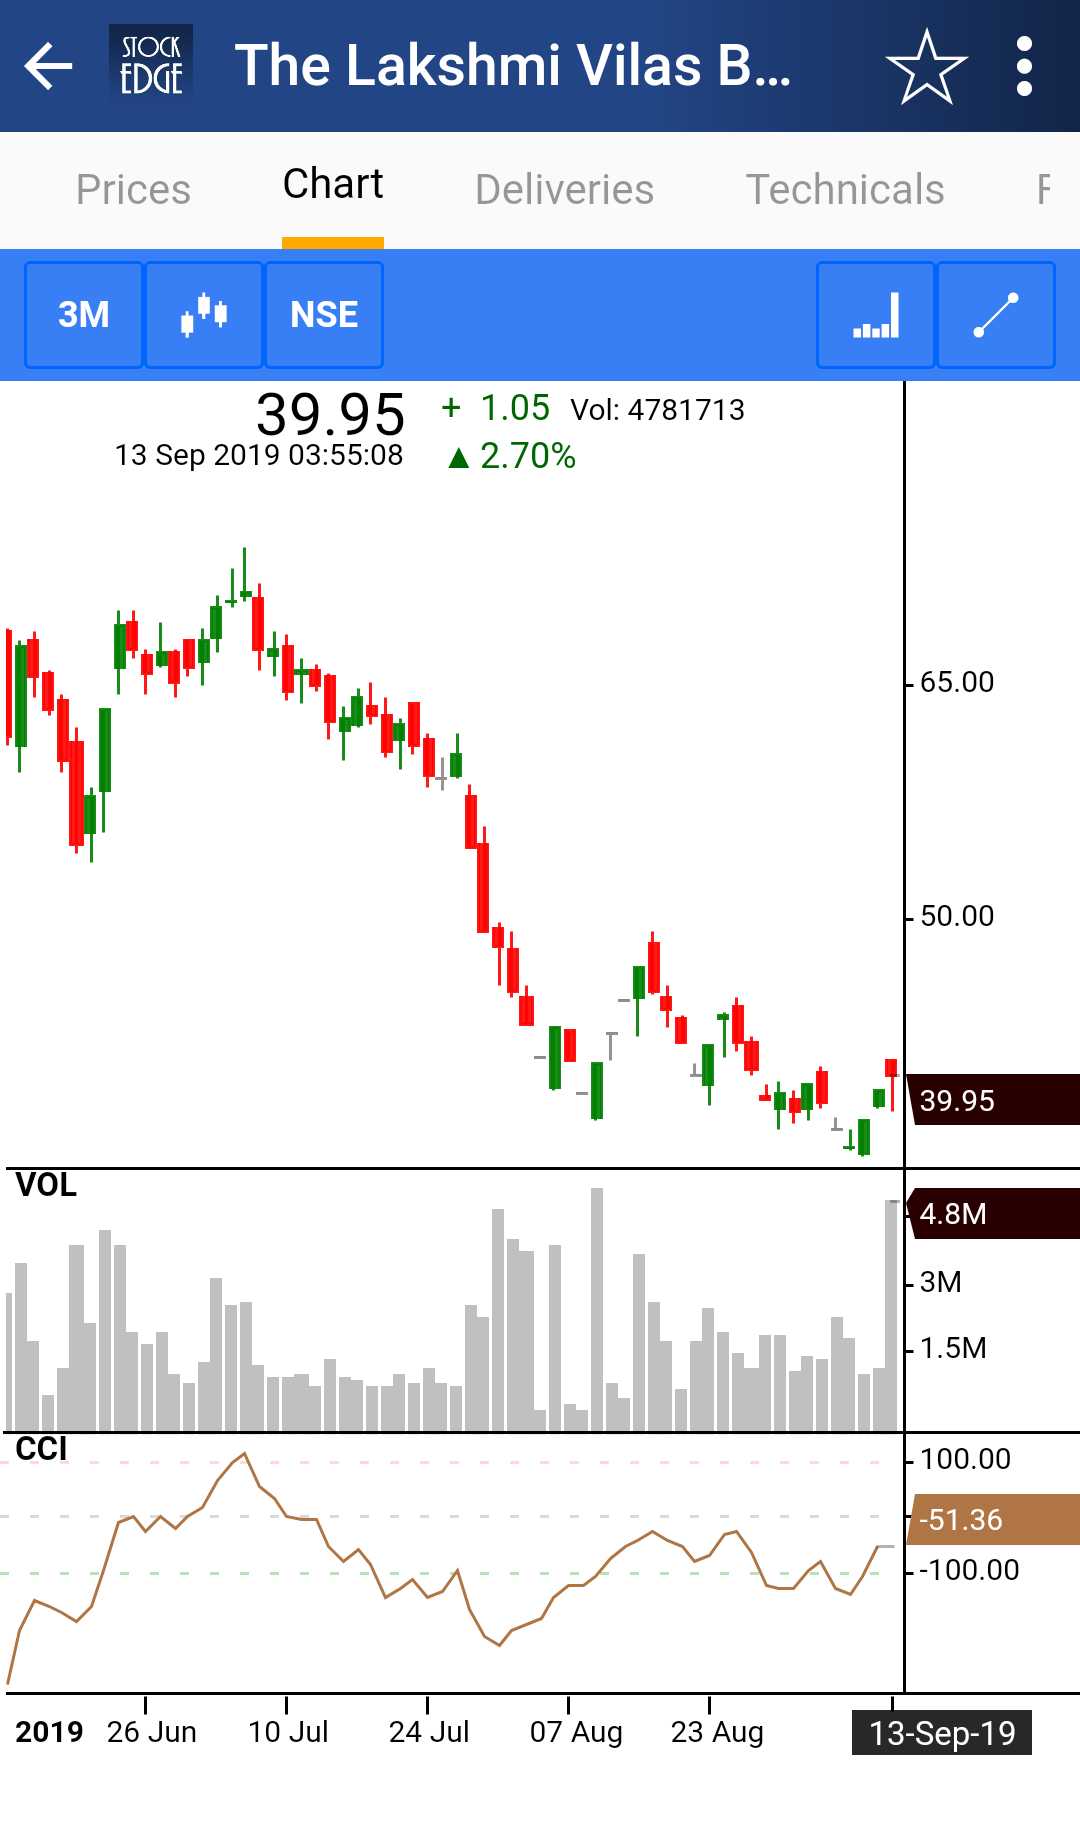
If you want to see the technical chart of The Lakshmi Vilas Bank Ltd. , then you can click on the company and find the technical chart with CCI plotted on the sub-graph:
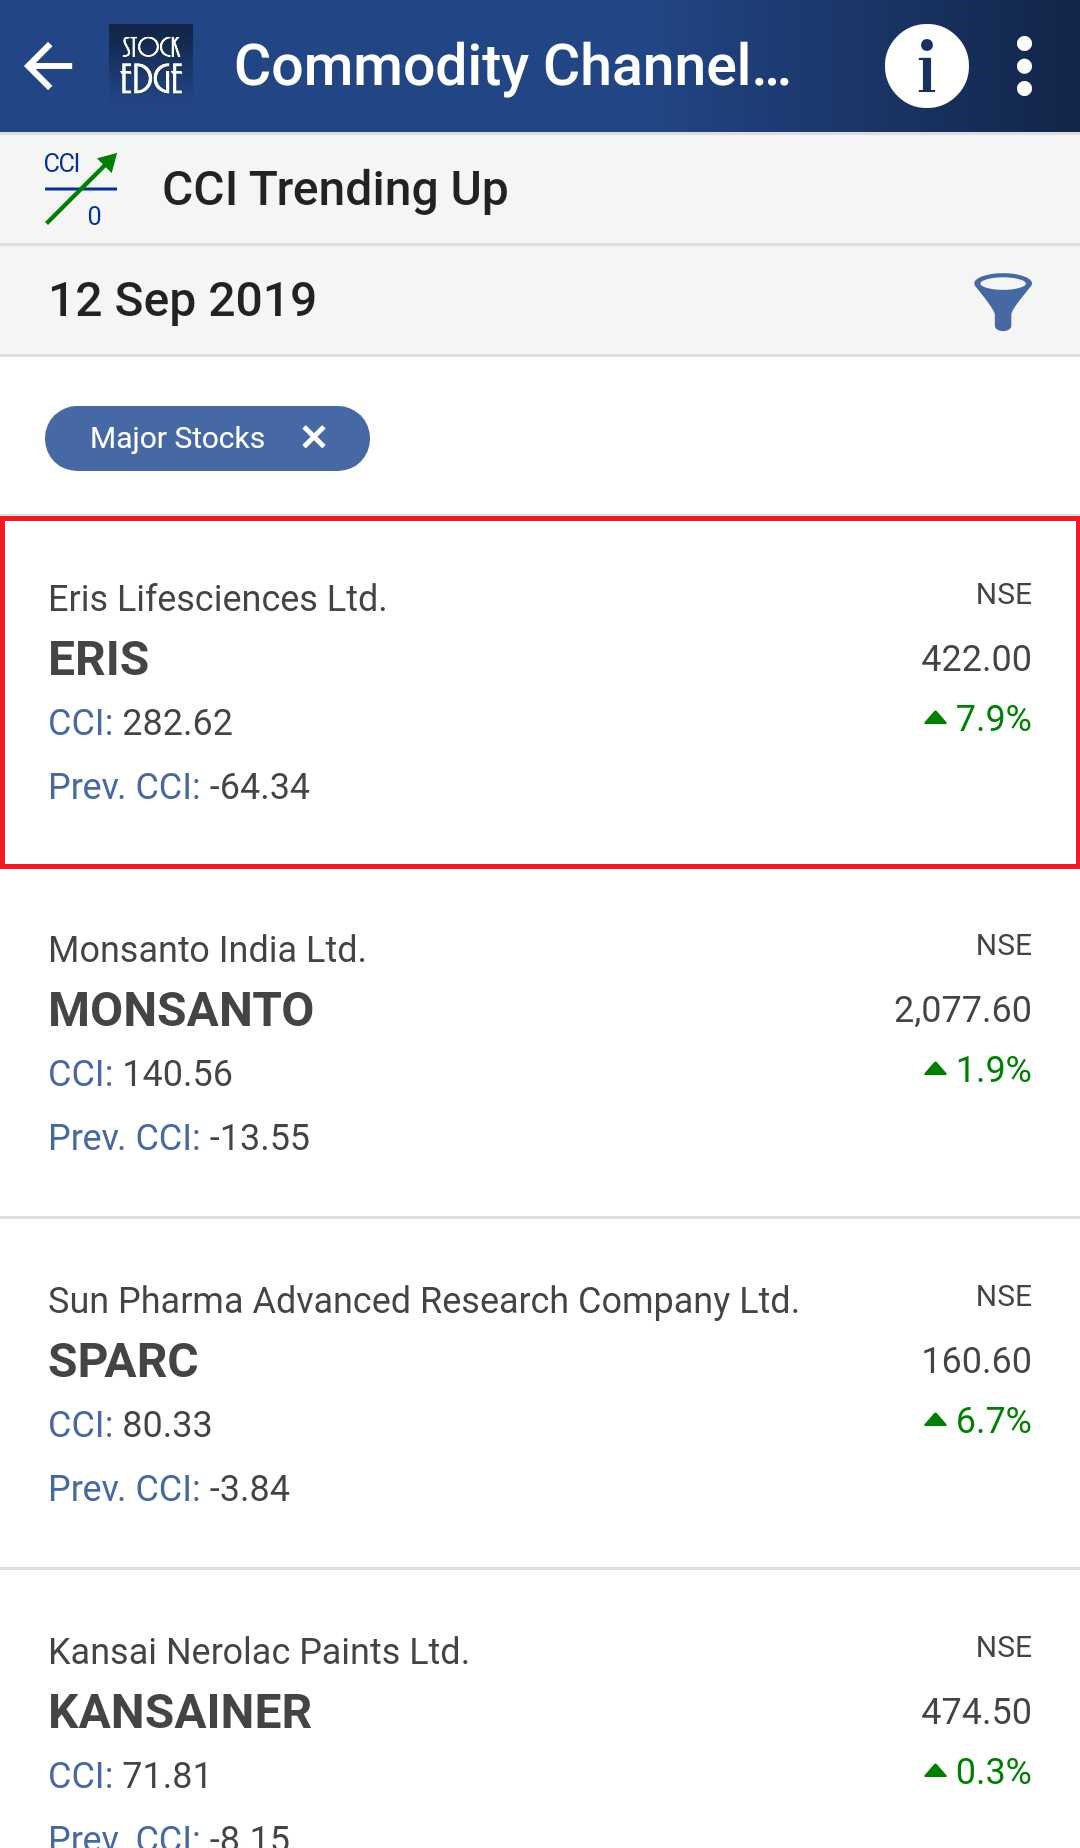
CCI Trending up :
It is an uptrend bullish signal which means that the CCI value has crossed above 0 from below levels indicating that stock price is starting a new uptrend. When the CCI is above zero it indicates the price is above the historic average
Following is a list of stocks which has fulfilled this criterion on 12th September:
CCI Bearish :
It is a bearish scan which indicates that the CCI value has crossed below 100 indicating that the stock is exiting the overbought zone.
Following is a list of stocks which has fulfilled this criterion on 12th September:
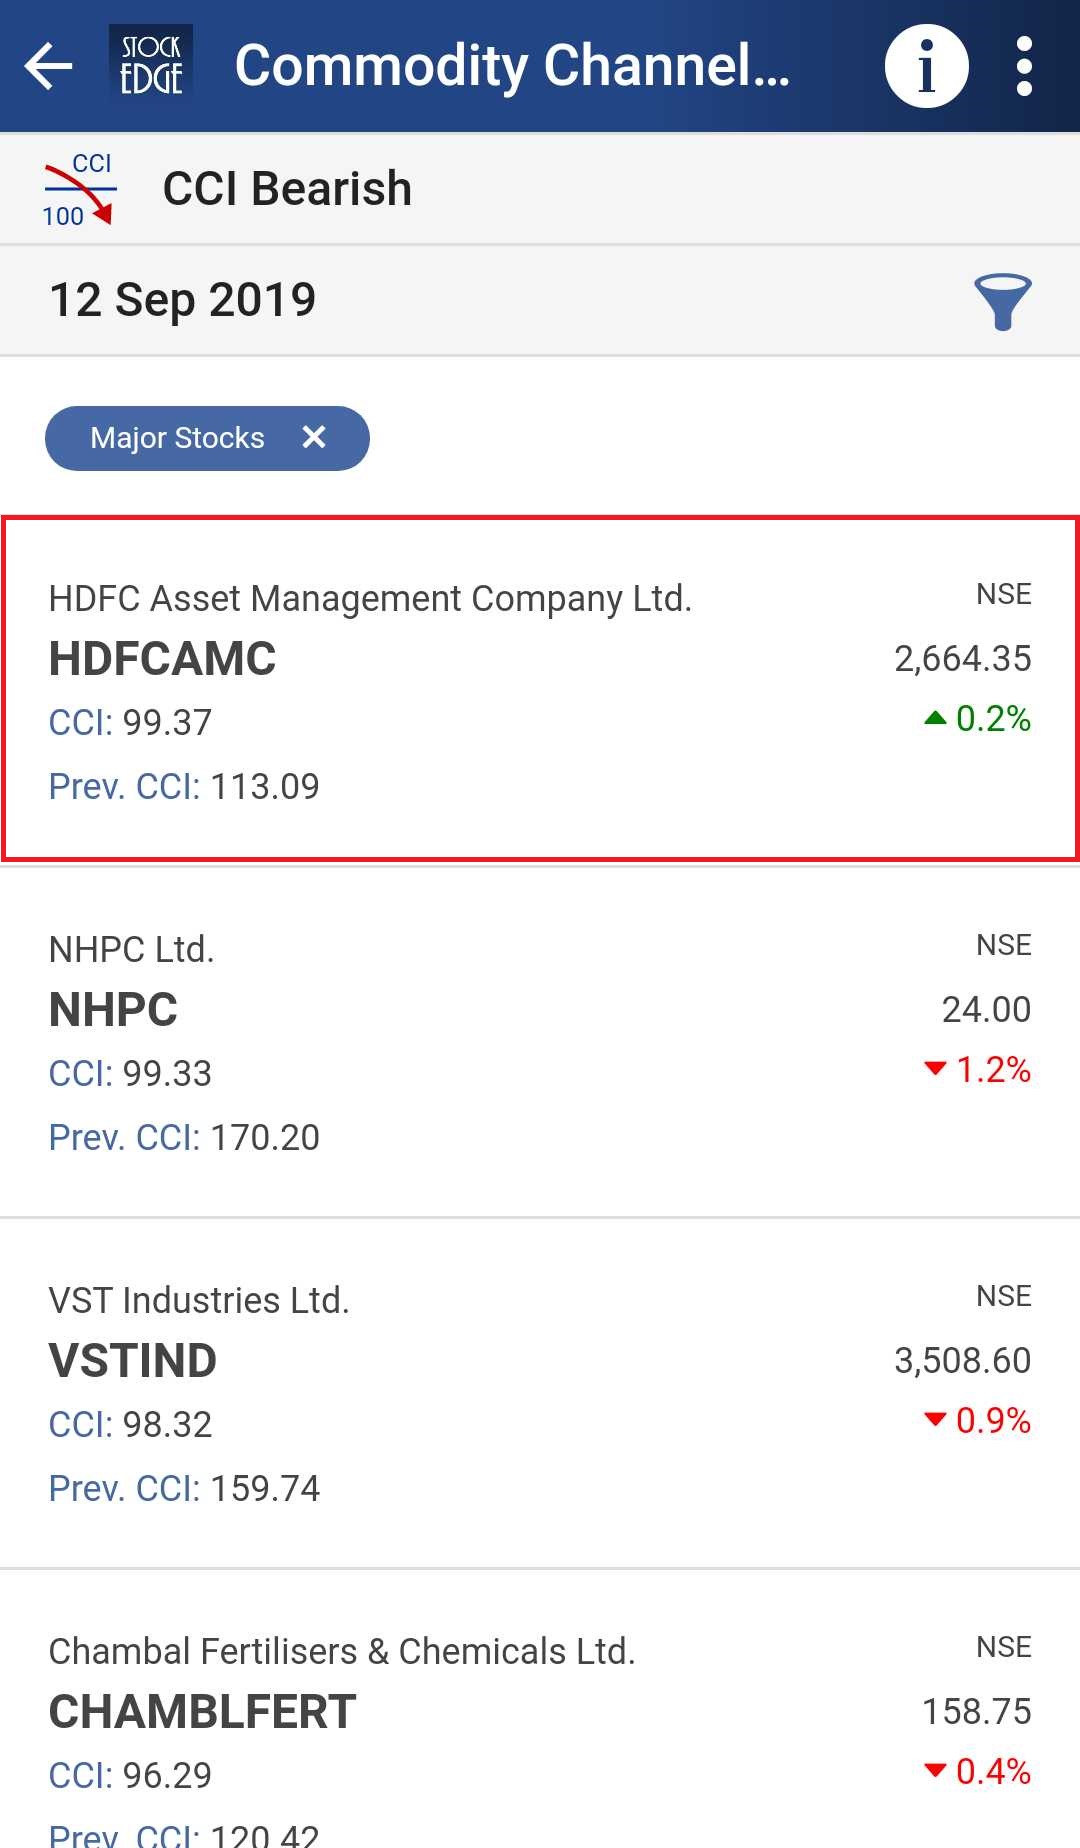
If you want to see the technical chart of HDFC Asset Management Company Ltd., then you can click on the company and find the technical chart with CCI plotted on the sub-graph:
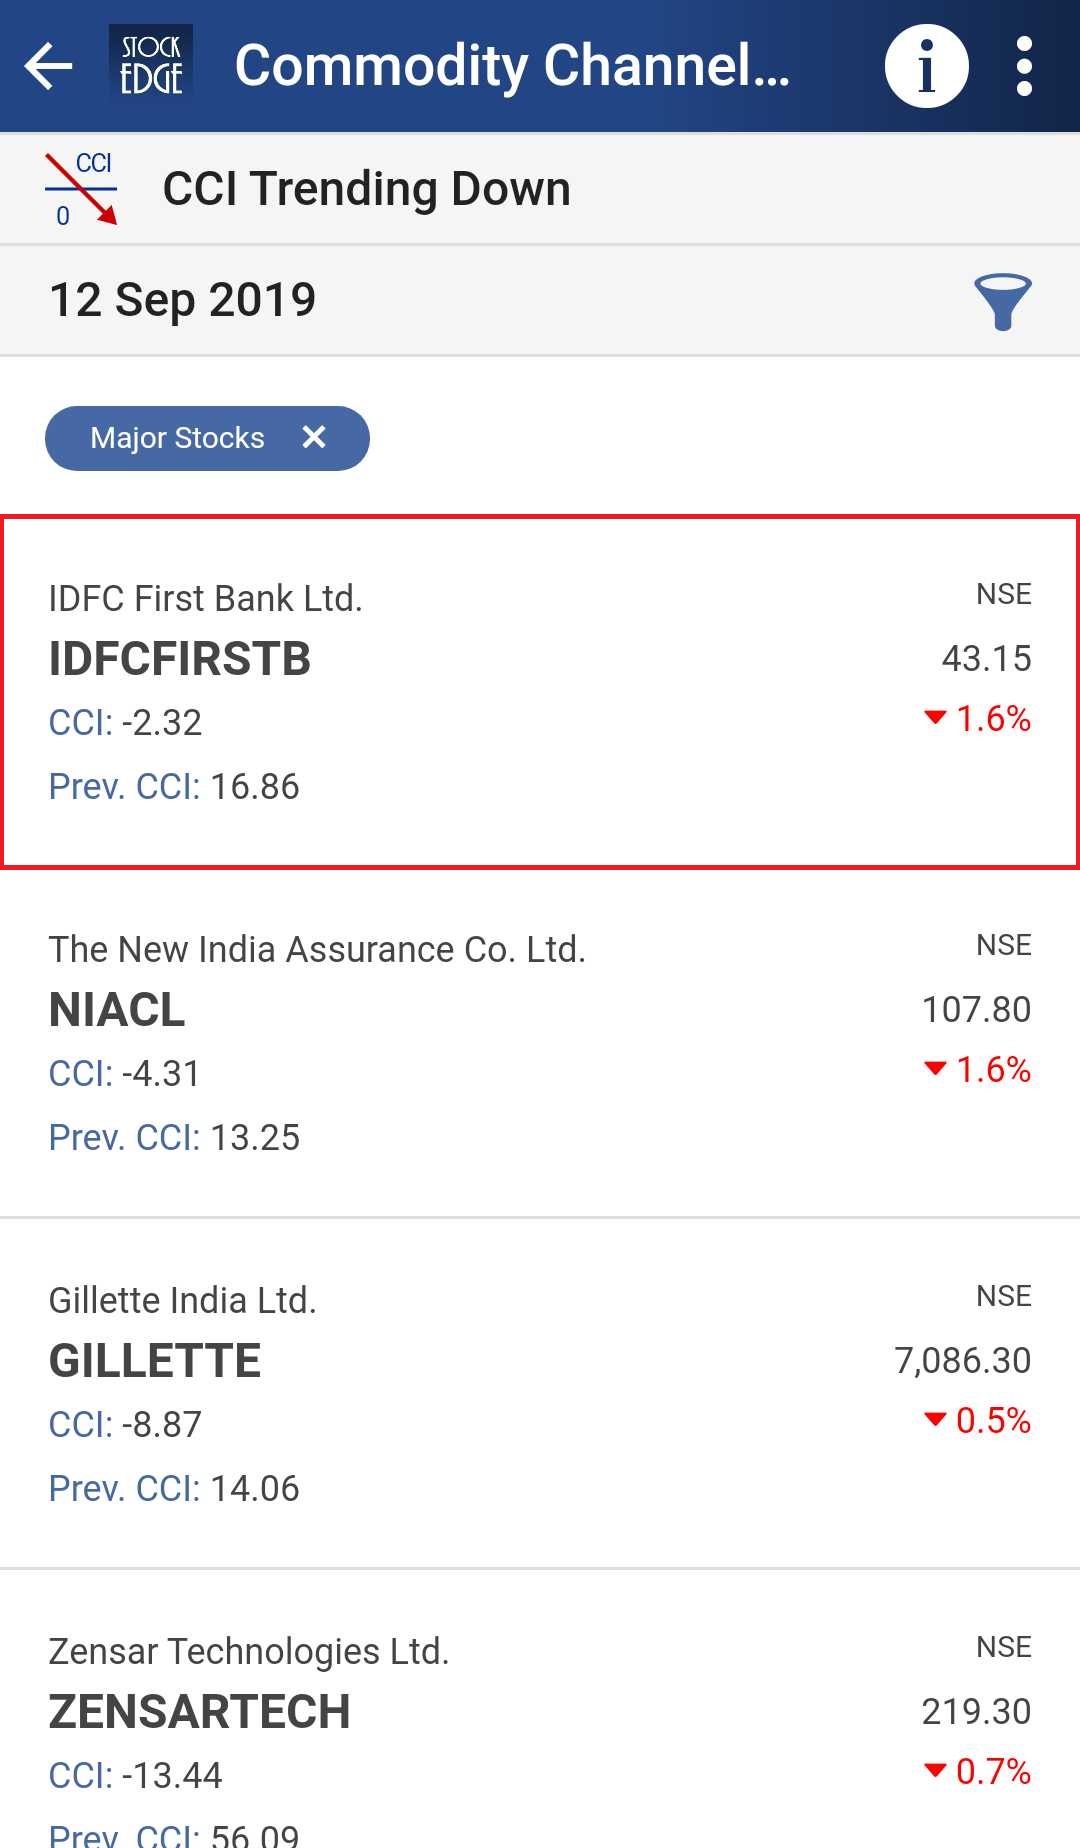
CCI Trending Down :
It is a downtrend bearish signal which means that the CCI value has crossed below 0 from above levels indicating that stock price is starting a new downtrend.
Following is a list of stocks which has fulfilled this criterion on 12th September:
See also: Average Directional Index (ADX)
Above are examples of Commodity Channel Index scans that tell you if the stock is bearish or bullish and also give us a list of the stock which fulfills the criteria of the particular day.
You can filter out the stocks and can trade accordingly using these scans.
Commodity Channel Index scans are one of the free tool offered by StockEdge app which you can download from here.
Interactive charts are only available for paid subscribers. You can check out our subscriber plans from stockedge premium.
To have a comprehensive idea of Commodity Channel Index, log on to elearnmarkets.com.


