Table of Contents
There are many strategies one adopts to buy stocks for fundamental Investing for long term wealth creation. Among them is one known as CANSLIM strategy.
Investors should not rely solely on the PE of a stock, instead, look at high-quality businesses with sustainable competitive advantages. CANSLIM strategy will help you in identifying such businesses.
CANSLIM is a methodology for selecting stocks, developed by Investor William O’Neil. This strategy identifies the companies which are fundamentally strong. Each letter in the acronym stands for a key factor to look for when purchasing a share in the company.
We can use StockEdge combination scans to filter stocks on the basis of CANSLIM criteria.
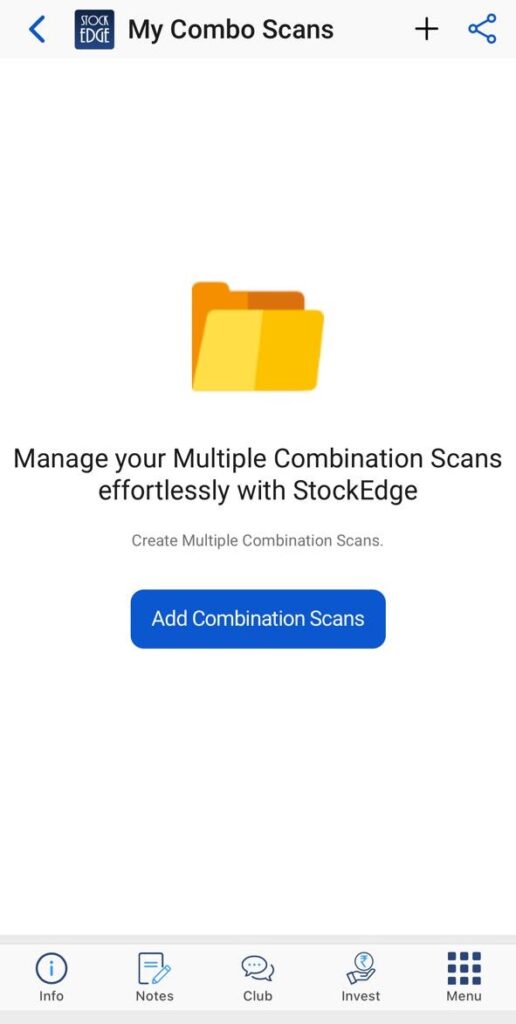
The first step is to go to “My Combination Scan” tab under My StockEdge and name the scan. In my case, I have named it as “CANSLIM Scan”
Next step, click on the scan name, this will lead you to a blank page with a plus sign on the top right corner. By clicking on the plus sign, you get all the scans.
In CANSLIM strategy:
C stands for Current earnings
We will use “Consistently Increasing Quarterly EPS” from our StockEdge fundamental scan. This scan filters companies whose earnings per share (EPS) is positive for past 5 quarters and increasing every quarter as compared to the respective previous quarter. It helps in finding companies which are consistently showing good growth and generating earning for the shareholders.

A stands for Annual Earnings
To check out whether a company has shown good growth in the past, we will use “High sales Growth ratio (Annual Report)”, “Consistently increasing Annual EPS”, and “High Return on Equity”.
These scans filter companies whose sales have increased more than 5% on YoY basis, EPS is positive for past 5 years and return on equity is more than 15% as per the latest available annual data. It helps in finding companies that have sustainable business and capable of generating profit consistently.
N stands for New product/Management
This portion of CAN SLIM requires a little extra research because it cannot be easily quantified in a scan. A company introducing a new product or services in the market or the addition of a new person in Management adds value to the company.
S stands for Supply and Demand
We will look for heavy volume accumulation by institutional investors, especially when the stock is breaking its important resistance levels. For this, we will use “Close Crossing Last Week High”. This is a bullish indicator and indicates the stocks which are moving upward and have crossed its last week’s high.
L stands for Leader or Laggard
Buy leading stocks from the leading industry group because leading stocks tend to be the first stock that bounce back from market correction or price decline.
To filter out the leader stock in the industry, we will use “Stock Outperforming Sectoral Index in both 1 Week and 3 Month”. This bullish indicator filters stocks which are continuously performing better than their sectors
See also: Using My Combination Scan to Identify best in an Industry
I stands for Institutional Sponsorship
Pick stocks, which have high institutional holding with recent above-average performance. The more is the investment of an institution in stocks, more is the faith of the institution in that company.
We will use “Increase in Institutional shareholding”. This scan filters stocks where current Quarter’s institutional shareholding has increased as compared to the previous quarter.
M stands for Market Direction
In the stock market, the market direction can be seen by a group of stocks or benchmarks such as Nifty50, Nifty for banks etc. Studies have shown that 85% of the stock follows the ongoing market trend.
We will use “stock outperforming the Benchmark Index in both 1 Week and 3 Month”. This is a bullish indicator under price scan and filter stocks which are continuously performing better than the Benchmark Index.
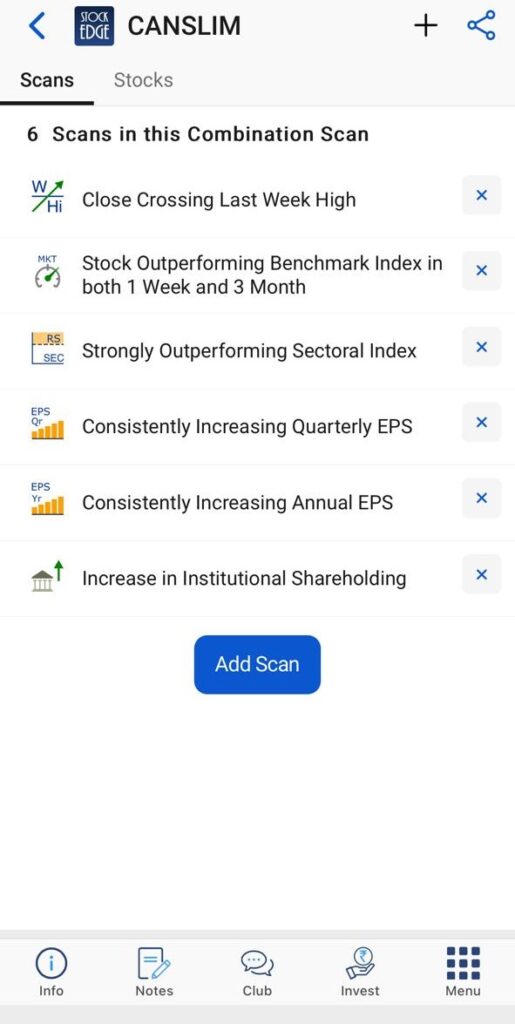
Once you have added the scans, thereafter click on ‘stocks’. This will provide you with the list of all quality stocks using the CANSLIM strategy.
Frequently Asked Questions
Does the Canslim method work?
CANSLIM is a good approach of investing in a bull market. But it struggles in sideways markets & bear markets. That’s why, to make money from this system over long period, its necessary to- make big returns (50%+ per annum) in a bull market stay on the sidelines during tough market conditions.
This system does not really work very well for those traders & investors who look to take out money every month or every year from the stock markets.
What is the CANSLIM approach to investing in the stock market?
It, is a system for selecting growth stocks using a combination of fundamental and technical analysis techniques. It is a bullish strategy for fast markets, with the goal being to get into high-growth stocks before the institutional funds are fully invested.
CANSLIM stocks can’t be bought and held as much of the value is being priced in for future growth, meaning any slowing in the growth trajectory, or the market as a whole, may result in the stock being punished.
What is canslim method?
It is a techno-fundamental strategy that helps pick quality stocks. This strategy focuses on companies that show acceleration in earnings because of innovation and suggests buying them before the stock price witnesses a major spike. For investors who cannot hold stocks for an extended period—more than five years—techno-fundamental strategy promises potentially better returns.
How the CANSLIM method works
Focus on both a firm’s fundamentals and market technical helps pick quality stocks.
C: Current quarterly earnings of a firm
Growth of at least 25% is a good starting point. Also, look at earnings acceleration over the last three quarters.
A: Annual earnings growth
Look for annual earnings and sales growth of at least 25% for the past three years and a return on equity of more than 17%.
N: New product, service or management
the biggest winners of the past had one thing in common: New products, new services, new leadership, new pricing or a new condition in the industry.
S: Supply and demand
Look for heavy-volume accumulation by institutional.
L: Leader or laggard
Buy leading stocks from the leading industry groups.
I: Institutional sponsorship
for a stock to be a top performer, it must have institutional support to fuel its price movement.
M: Market direction
Three out of four stocks follow the market’s trend, so trade in sync with the market.
StockEdge App Scans will help you in saving your time and Energy and give you an Investment idea within minutes. So, what are you waiting for, Subscribe to our Premium version of StockEdge App and become a smart investor.
Join StockEdge Club to get more such Stock Insights.
You can check out the desktop version of StockEdge.






Sir plz Send Quality Stock
Can please share some more details about what you are exactly looking for?