Table of Contents
Introduction:
When it comes to investing in the stock market, knowledge is power. One valuable tool in an investor’s arsenal is Technical Peer comparison, which involves analyzing the performance of a target stock in relation to its industry peers. While fundamental analysis focuses on a company’s financial health, the technical analysis examines key technical levels, indicators, price patterns and market trends.
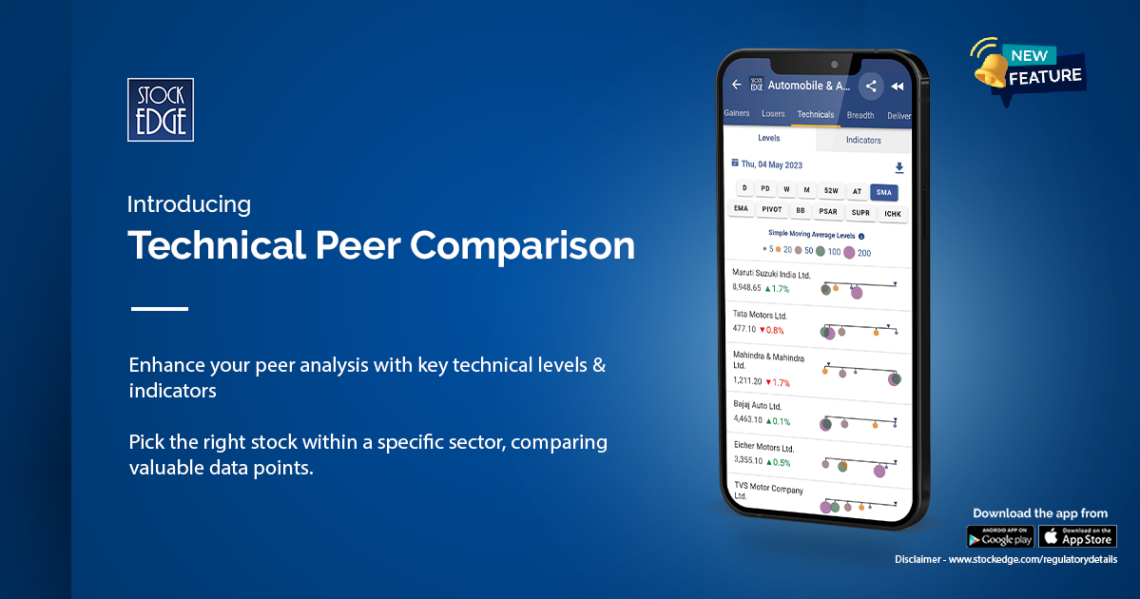
In the dynamic world of stock trading, staying ahead of the competition and making informed investment decisions are crucial. StockEdge, one of the leading stock market analysis platforms, has recently introduced a groundbreaking feature known as “Technical Peer Comparison.” This powerful tool allows investors and traders to evaluate stocks based on technical indicators, enabling them to make more accurate and timely investment choices. In this blog post, we will delve into the details of StockEdge’s Technical Peer Comparison and explore how it can enhance your stock analysis.
Understanding Technical Peer Comparison:
Technical Peer Comparison is a feature that facilitates a comprehensive analysis of stocks based on various technical indicators. It enables investors to compare the performance of a stock with its industry peers, benchmark indices, and customized watchlists. By evaluating key indicators such as moving averages, relative strength index (RSI), moving average convergence divergence (MACD), and others, investors can gain valuable insights into a stock’s relative strength, trend, and momentum.
Identifying Sector/Industry Peers:
To perform a meaningful peer comparison, it is crucial to identify a stock’s Sector/Industry peers. Companies operating in the same sector or subsector often face similar market conditions and macroeconomic influences.
Now let’s deep dive and understand StockEdge’s Technical Peer Comparison feature:
Click on the Sector icon on the home page and select your desired sector/industry wherein you want to analyse the same via key technical indicators and levels.
For example, we select the Auto sector stocks and switch to the Technicals tab.
What we see is that the Technicals tab is further divided into two subtabs named Levels and Indicators.
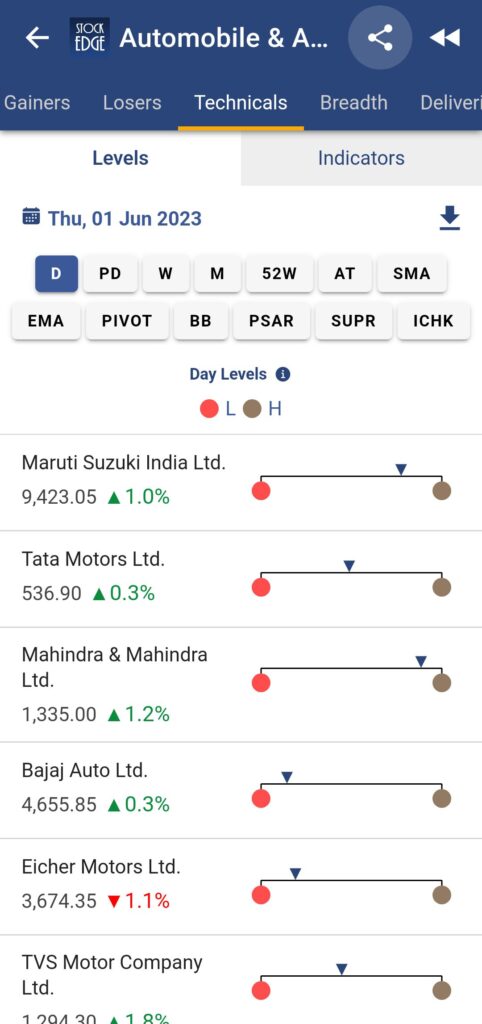
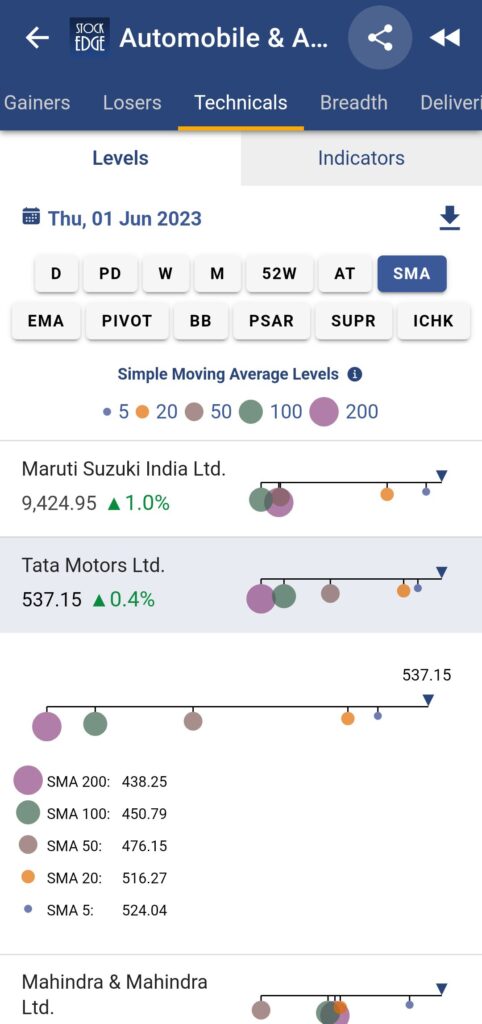
In the Levels Tab, you will find a list of all stocks in this respective sector sorted in a market cap descending order, providing key levels on the selected technical level button, D being the first default level.
There are in total 13 key technical levels provided:
- D – Day levels: Providing High and Low Levels of the latest trading day.
- PD – Previous Day:
- W – Weekly:
- M – Monthly:
- 52W – 52 Week:
- AT – ALL Time:
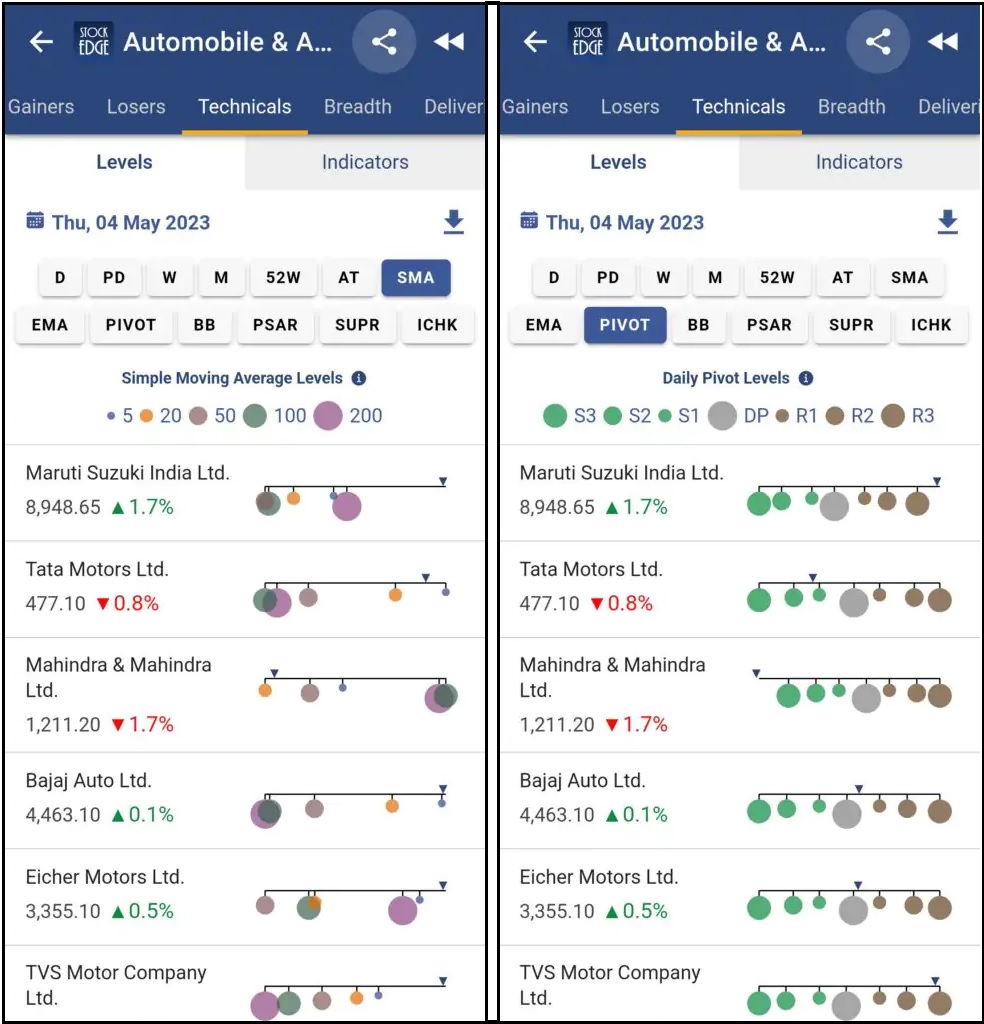
- SMA – Simple Moving Average:
- EMA – Exponential Moving Average:
- PIVOT – Key Pivot Levels
- BB – Bollinger Band:
- PSAR – Parabolic SAR:
- SUPR – SuperTrend:
- ICHK – Ichimoku Levels
As can be seen, all the levels are provided in button bars and one can select the respective level button to analyse the data further. Clicking on any button bar with ‘D’ being default, all the stocks in that respective sector will be appearing in a list sorted on the basis of descending market cap along with an easy-to-interpret visual graphic representation of key levels.
In the Indicators tab, indicators are further grouped into 4 categories each with its sub-parts:
- Momentum:
- Relative Strength Index (RSI)
- Commodity Channel Index (CCI)
- Money Flow Index (MFI)
- Rate of Change (ROC)
- Stochastic %K (S%K)
- William % R (W%R)
- Relative Strength:
- Relative Strength Benchmark Index (RSMKT)
- Static Relative Strength (SRS)
- Adaptive Relative Strength (ARS)
- Relative Strength Sectoral Index (RSSEC)
- Trend:
- Average Directional Index (ADX)
- Moving Average Convergence Divergence (MACD)
- Volatility:
- Average True Range (ATR)
- Bollinger Band Width (BBW)
- Bollinger Band %B (BB %B)
- Beta-Benchmark Index (MBBETA)
- Beta – Sectoral Index (SBBETA)
- Standard Deviation
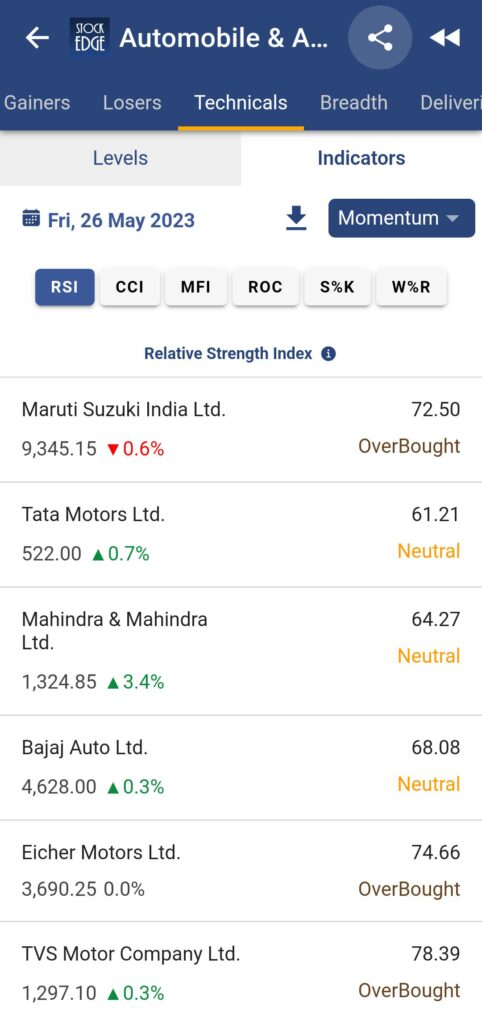
For understanding each of the technical indicators mentioned above, you can click on the ‘(i)’ icon for further understanding of the same.
Conclusion:
StockEdge’s introduction of Technical Peer Comparison is a significant step forward in empowering investors and traders with data-driven insights for effective stock analysis. This innovative feature enables users to evaluate stocks based on key technical indicators, compare their performance with industry peers, and make informed investment decisions. Whether you are a novice investor or an experienced trader, leveraging this tool can provide you with a competitive edge in the stock market. By incorporating Technical Peer Comparison into your stock/ sector analysis process, you can gain valuable insights, optimize your portfolio, and improve your trading outcomes.
Stay tuned for upcoming blogs where we will dive deeper into the new features, provide tutorials, and share valuable insights from industry experts. StockEdge Version 10.0 is set to redefine the way you invest, so buckle up and get ready to unlock a world of possibilities.
If you enjoy using StockEdge, don’t hold back from sharing the platform with your near and dear ones.
Check out StockEdge’s Premium Plans to get the most out of it. Also, watch this space for our midweek and weekend editions of ‘Stock Insights‘.
Happy investing with StockEdge Version 10.0!
-The StockEdge Team
Disclaimer: Kredent Infoedge Private Limited is a SEBI registered Research Analyst and Investment Advisor. Research Analyst SEBI Registration Number – INH300007493. Investment Advisor SEBI Registration Number – INA000017781. Registered Office Address: J-1/14, Block – EP and GP, 9th Floor, Sector V Saltlake City, Kolkata WB 700091 IN. CIN: U72400WB2006PTC111010
Investments in the securities market are subject to market risks. Read all the related documents carefully before investing. Registration granted by SEBI, membership of BASL and certification from NISM in no way guarantee the performance of the intermediary or provide any assurance of returns to investors. “The securities displayed are for illustration only and are not recommendatory” should be mentioned.


