Table of Contents
“Good things come in small packages”
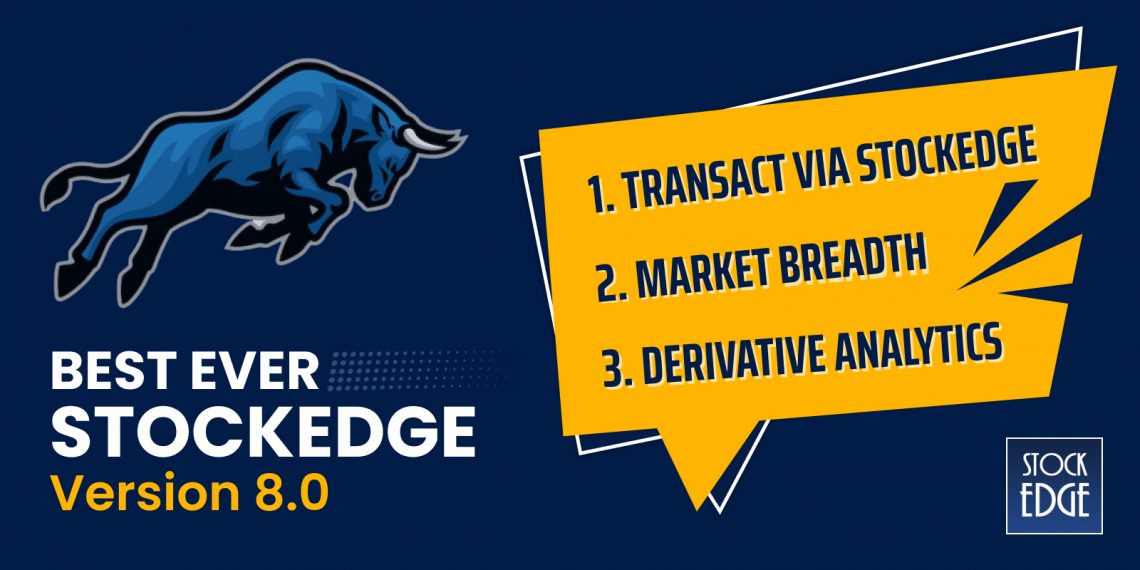
StockEdge team resonates with the above saying and with that thought in mind, we have released StockEdge Version 8.0. Through this release, we have introduced a few game changer features for our users. These features aim to make StockEdge a one-stop solution for all our users.
Following are the new features that are released:
- Transact via StockEdge with your favourite broker
- Market Breadth
- Derivative Analytics
Without further ado, let’s dive deep to know more about these fantastic features!
Transact via StockEdge with your favourite broker:
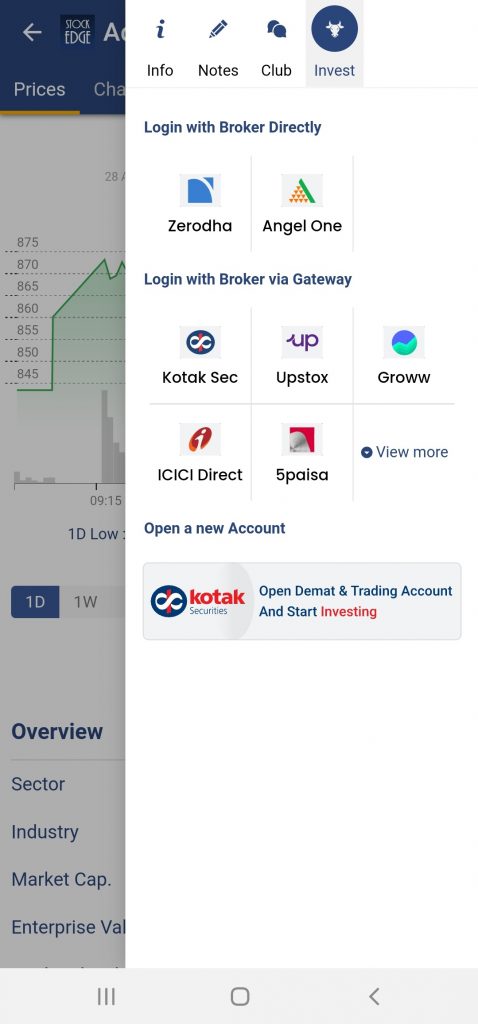
Through this new feature, a user can conduct equity research and invest in the stock simultaneously via StockEdge. StockEdge has integrated with brokers directly and via a gateway as well for users to facilitate Buy/Sell transactions within the platform. Only registered users of StockEdge who have an account with the listed brokers will be able to trade through StockEdge.
The users will be able to place buy/sell orders, and view their order book, trade book, current Demat holdings and margin positions. Users can place buy/sell orders from the stock page directly or invest through the Info Section of the platform. Investing in BSE and NSE stocks is possible through direct brokers, however, when users use a gateway to invest through brokers, investing is only permitted in NSE stocks. The introduction of this feature moves StockEdge a step closer to making it a one-stop solution for all its users.
Market Breadth:
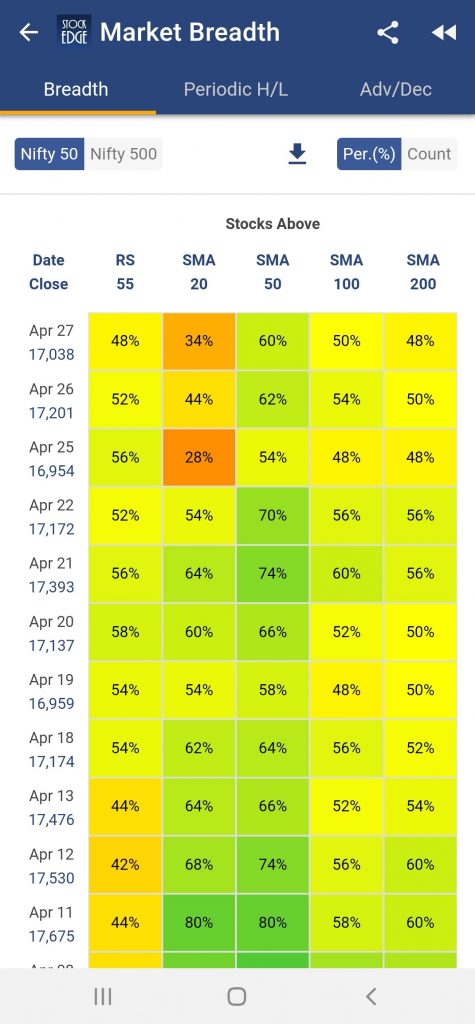
Market Breadth gives a bird’s eye view of the performance of the market over a certain time period. It shows the performance of NIFTY 50 stocks and NIFTY 500 stocks over different time periods. It is segmented into three parts: 1) Breadth 2) Periodic High/Low and 3) Advance/Decline.
Breadth: Breadth shows the per cent or count of securities in NIFTY 50 / NIFTY 500 that have outperformed NIFTY 50 over a period of 55 days through the RS 55 column and the per cent or count of securities in NIFTY 50 / NIFTY 500 whose closing price is trading above SMA 20, SMA 50, SMA 100 and SMA 200 respectively for a period of 50 days. If the count or per cent is high, it is shaded in green, in yellow if it is neutral and in shades of red for a low count. Green shades indicate an uptrend, yellow shades indicate a neutral outlook and red shades indicate a downtrend.
Periodic High/Low: Periodic high/ low refers to the high and low reached in a given time period. Users can view the count of stocks that are trading near their periodic high or low for different time periods. When a security is trading at a value which is within 20% of its High-Low range, it qualifies to be shown in the Period High/Low Analysis. For better understanding, let us refer to an example. Suppose a stock has a 1 month high of Rs. 150 and a 1 month low of Rs. 90.
The range of the periodic high/low is 60 and 20% of the range is 12. So if the stock is trading at Rs. 138 or above or if it is trading at 102 or below, we consider it to be trading near its periodic High/Low. When the count of stocks trading near periodic high is increasing consistently, an uptrend in the market is indicated and when the per cent or count of stocks trading near the periodic low is constantly increasing, a downtrend is indicated
Advance/Decline: Advance refers to the number of stocks that have closed above their previous close and Decline refers to the number of stocks that have closed below their previous low. The bar chart shows the advance/decline for nifty 50 / nifty 500 for different time periods. If advances are greater than declines consistently, an uptrend is indicated and if declines are greater than advances consistently, a downtrend is indicated.
Click here to know more about Market Breadth.
Derivative Analytics:
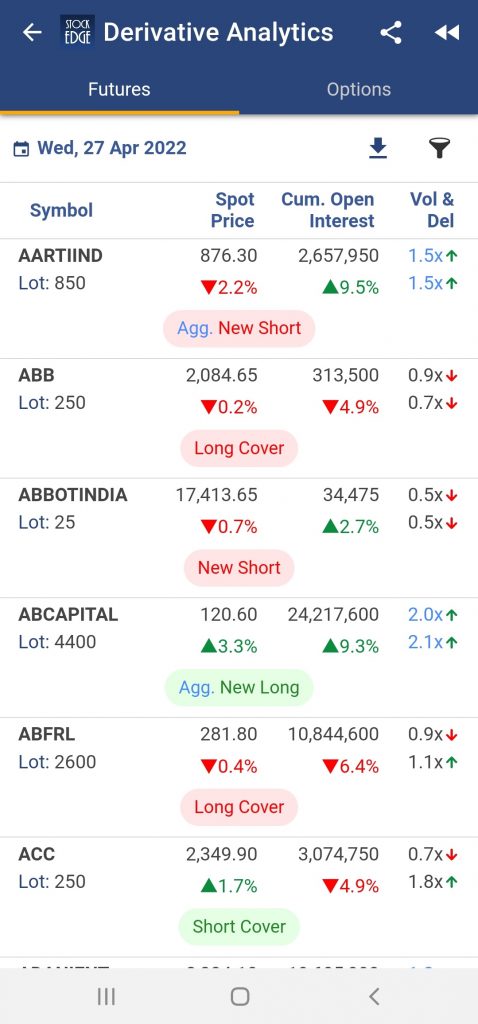
We are introducing ”Derivative Analytics”, a new section under premium analytics for our paid users which will help them to further analyze the derivative and stock markets.
This section is further divided into 2 separate sections for Futures and Options. For further analysis of a stock, we have also introduced an Open Interest analysis section on the stock page, where you can analyze the daily Open Interest trend for the last 60 trading days. Under Futures, data regarding the Spot Price, Cumulative Future Open Interest, Volume and Delivery and the Open Interest Trend will be available. Under Options, the 1-month sparkline chart and data regarding Put Call Ratio, Changes in Put Call Ratio and Changes in Spot Price will be available.
Click here to know more about Derivative Analytics.
This is it for now from Team StockEdge. We hope these features enhance your investment journey and make StockEdge more valuable to you. If you enjoy using StockEdge, don’t hold back from sharing the platform with your near and dear ones.
Check out StockEdge’s Premium Plans to get the most out of it.
Also, keep watching this space for our midweek and weekend editions of ‘Trending Stocks‘ and ‘Stock Insights‘.







Is this version released for iOS? I am not able to see it in app store.
Thanks
Hi, we will be releasing the iOS updated version very soon. Till then you can use it from the android & web versions.
Thanks
This is one of the best tool to anlyse stock market related things in a easy way…..
Vivikji I am useing this since 4years this apps i got a lot of for yours best knowledge i am telling you heartly didnot know any thing about share market thanks alot and lots of love to you and yours super teams.another words yours apps must be in mobile for beginners.thanks again…