StockEdge.com
  • Products
    • StockEdge Premium
    • StockEdge Pro
    • StockEdge Club
  • Stories
StockEdge Blog
  • Trending Stocks
  • Insights
  • Technical Analysis
  • Fundamental Analysis
  • StockEdge Tutorials
  • Mutual Fund
No Result
View All Result
  • Trending Stocks
  • Insights
  • Technical Analysis
  • Fundamental Analysis
  • StockEdge Tutorials
  • Mutual Fund
No Result
View All Result
StockEdge
Home StockEdge Version Updates
A poster for stockedge version 7. 3, featuring a cartoon character sitting on a blue background. The text on the poster says

StockEdge 7.3 Release

StockEdge by StockEdge
January 4, 2024
Reading Time: 5 mins read
2.7k
VIEWS
Share on FacebookShare on XShare On WhatsApp

Table of Contents

  • Premium Features include: 
  • Free Features include:
  • Enterprise Value (EV) to Market Capitalisation Scan (MCAP)
  • My Company Filings Modified
  • PutCall Ratio (PCR)
  • Trailing Twelve Month Profit/Loss (TTM P/L)

StockEdge aims at continuously improving its platform and making the user experience seamless. Therefore, we at StockEdge keep introducing new features and modifying the existing ones at regular intervals. That being said, we are happy to release StockEdge Version 7.3 and believe that the new features will add significant value to users.

Premium Features include: 

  • Enterprise Value (EV) to Market Capitalisation Scan (MCAP)
  • My Company Filings Enhanced

Free Features include:

  • PutCall Ratio in Stock Option Chain page
  • Trailing Twelve Month (TTM) Profit/Loss 

To know more about these new features, continue reading. 

Enterprise Value (EV) to Market Capitalisation Scan (MCAP)

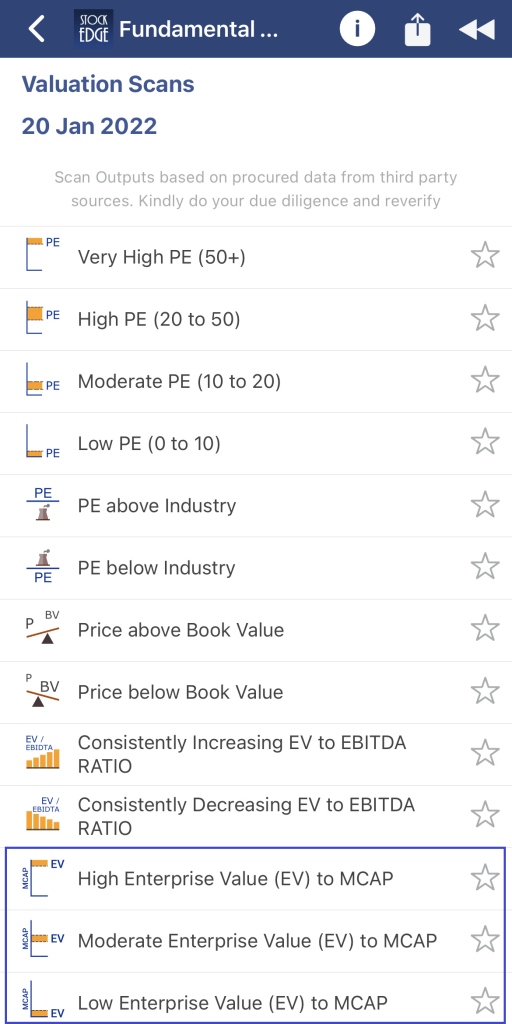
EV refers to the total value of the company. It includes market capitalization total debt and reduces cash and cash equivalents. Therefore, it is the amount needed to buy the company. In addition, three new scans have been introduced which compare EV to MCAP. These scans indicate whether a company is undervalued or overvalued. The scans that have been presented are:

  1. High Enterprise Value (EV) to MCAP
  2. Moderate Enterprise Value (EV) to MCAP
  3. Low Enterprise Value (EV) to MCAP
A list of stock valuation scans as of 20 jan, 2022.

My Company Filings Modified

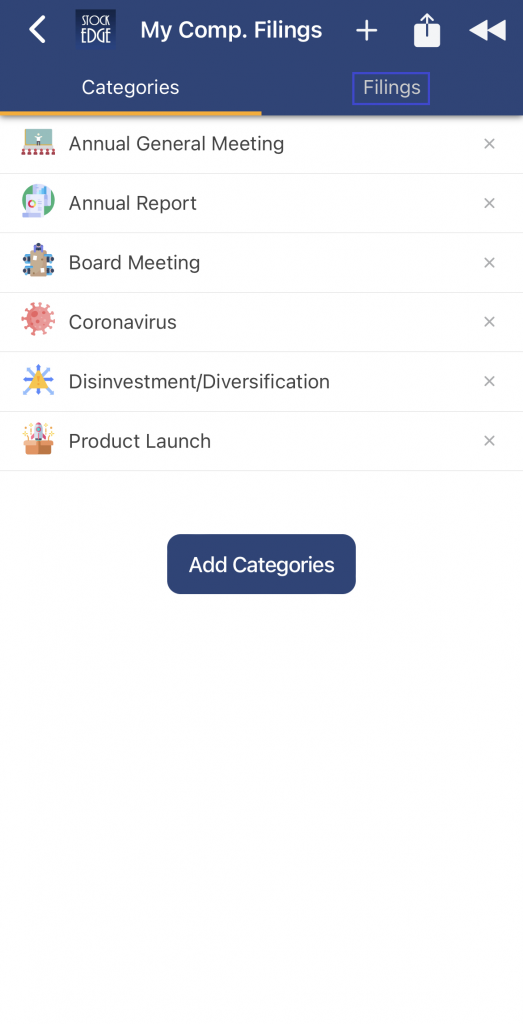
A new tab called Filings has been introduced in the “My Company Filings” section. With the introduction of this, users can now view all the filings of the categories marked by them as the favourite, in one place. User experience will be enhanced with this feature as they get all the filings relevant to them in one click.

My comp. Fillings of stockedge app showing different categories. “annual meeting”, “coronavirus”, “disinvestment/diversification”, and “product launch”. The filings are “annual report”, “board meeting”, and “product launch”.

PutCall Ratio (PCR)

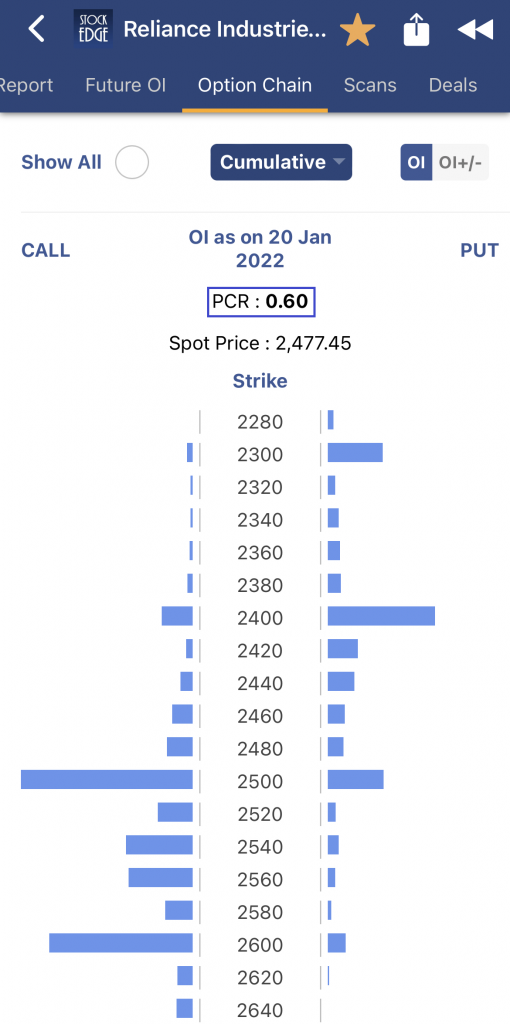
PCR is a derivative indicator used to gauge the market’s overall sentiment. It is calculated by dividing the open interest in a put contract by the open interest in a call contract of a stock or an index on the same day.PCR is often viewed as a contrarian indicator by a few people. Users can now view the Cumulative PutCall Ratio (PCR) in the Option Chain page of FnO Stocks. With the introduction of this feature, users can make more informed decisions before investing.

Option chain analysis of reliance industries as of 20 jan,2022.

Trailing Twelve Month Profit/Loss (TTM P/L)

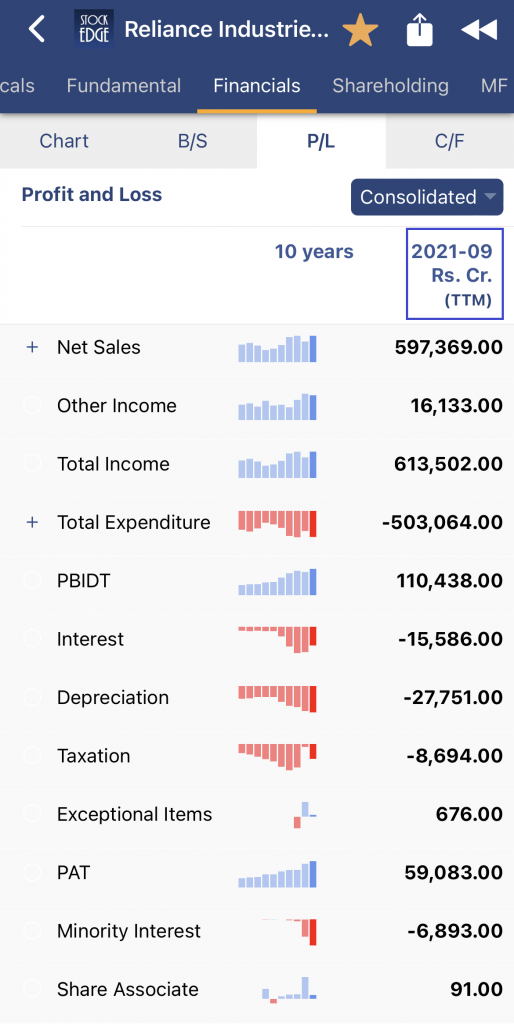
TTM refers to the past 12 consecutive months (4 quarters) of a company’s financial data. These 12 months don’t necessarily have to coincide with the fiscal year ending period. StockEdge now displays quarterly TTM P/L on the “Financials” page under the P/L tab. Quarterly TTM is calculated by summing up the figures for the past consecutive 4 quarters. TTM helps market participants evaluate and value a company more accurately with the most recent data. 

The financial report of reliance industries ltd. . The report is for the year 2021-09 and shows the company’s profit and loss statement. The report is broken down into sections such as “other income”, “total income”, “ebidt”, “interest”, “pbt”, “pat”, and “eps”. The report also shows the company’s consolidated results.

That’s all from Team StockEdge for now. We hope the new features make your investing journey impeccable. Let us know how you like these new features, and look out for another release soon. 

Don’t hold back from sharing it with your near and dear ones if you enjoy using our platform.  

Check out StockEdge’s Premium Plans to get the most out of it.

Also, keep watching this space for our midweek and weekend editions of ‘Trending Stocks‘ and ‘Stock Insights‘.

Tags: COMPANY FILINGSEV TO MCAPFundamental analysisoption chainPCRStockEdgetechnical analysisVERSION 7.3
ShareTweetSend
Open A Zero Brokerage Account In Kotak Open A Zero Brokerage Account In Kotak Open A Zero Brokerage Account In Kotak
Previous Post

What’s Trending: DCM Shriram, HSIL, and 3 other stocks

Next Post

What’s Trending: Hitachi Energy India, Gokaldas Exports, and 3 other stocks

StockEdge

StockEdge

StockEdge is a self-help Equity and Mutual Fund research tool. It empowers retail investors to identify investment opportunity with all the necessary data and analytics.

Next Post
A graphic displaying “trending stocks” with logos of hitachi energy, gokaldas exports limited, sasken, polycab, and shoppers stop on a green background. The image has a light green background with a darker green geometric pattern

What’s Trending: Hitachi Energy India, Gokaldas Exports, and 3 other stocks

Privi specialty chemicals ltd. Stock insights, showcasing the company's logo, upward-trending line graph, and focus on chemicals.

Privi Speciality Chemicals - One of India's Fastest Growing Consumer Chemical Company

Image showing trending stocks such as lic hfl, route mobile, ht media, lauraus labs with their logos.

What’s Trending: Laurus Labs, LIC Housing Finance, and 3 other stocks

Disclaimer

StockEdge (Kredent InfoEdge Pvt. Ltd.) is a SEBI-registered Research Analyst (RA) entity (SEBI Registration No: INH300007493). The information provided in this article is for educational and informational purposes only and should not be considered as an offer to buy or sell any securities or investment products.

The stocks, securities, and investment instruments mentioned herein are not recommendations under SEBI (Research Analysts) Regulations, 2014. Readers are advised to conduct their own due diligence and seek independent financial advice before making any investment decisions.

Investments in securities markets are subject to market risks. Please read all related documents carefully before investing. Investing in Equity Shares,
Derivatives, Mutual Funds, or other instruments carry inherent risks, including potential loss of capital. StockEdge (Kredent InfoEdge Pvt. Ltd.) does not provide any guarantee or assurance of returns on any investments. Past performance is not indicative of future performance.

Contact Us
  • Timing (Mon-Sat): 10 am to 7 pm
  • Sales: +919830994463
  • Support: +919830994402
  • Club Support: +916289906895
  • Affiliate: +917003567131
Recent Posts
Check out the Top 3 Consumption Stocks in India
Top 3 Consumption Stocks in India
Ather Energy IPO: All You Need to Know
Important Links
  • StockEdge.com
  • StockEdge Premium
  • StockEdge Pro
  • StockEdge Club
  • Compare Plans
An Initiative Of
Logo of KREDENT INFOEDGE with SEBI Registration no.

© 2025 Kredent InfoEdge Pvt Ltd.

Facebook-f Twitter Instagram Linkedin-in Youtube Pinterest-p Whatsapp Telegram

Get StockEdge App

No Result
View All Result
  • Home
  • Article Categories
    • Trending Stocks
    • Insights
    • Technical Analysis
    • Fundamental Analysis
    • StockEdge Tutorials
    • Mutual Fund
  • Stories
  • Products
    • StockEdge Premium
    • StockEdge Pro
    • StockEdge Club
  • Visit StockEdge.com

© 2024 Kredent InfoEdge Pvt Ltd.

Get 20% off on StockEdge Premium.