Table of Contents
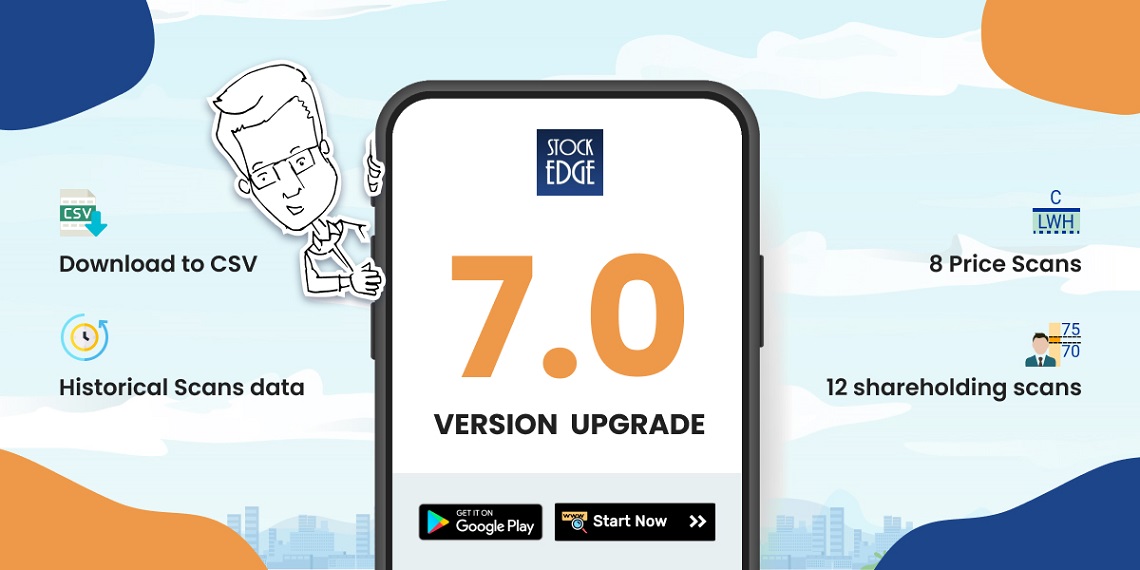
StockEdge is happy to release StockEdge Version 7.0. The version update adds valuable features for both, free and paid users.
StockEdge Premium features include:
- Download files to CSV.
- 12 new Shareholding scans
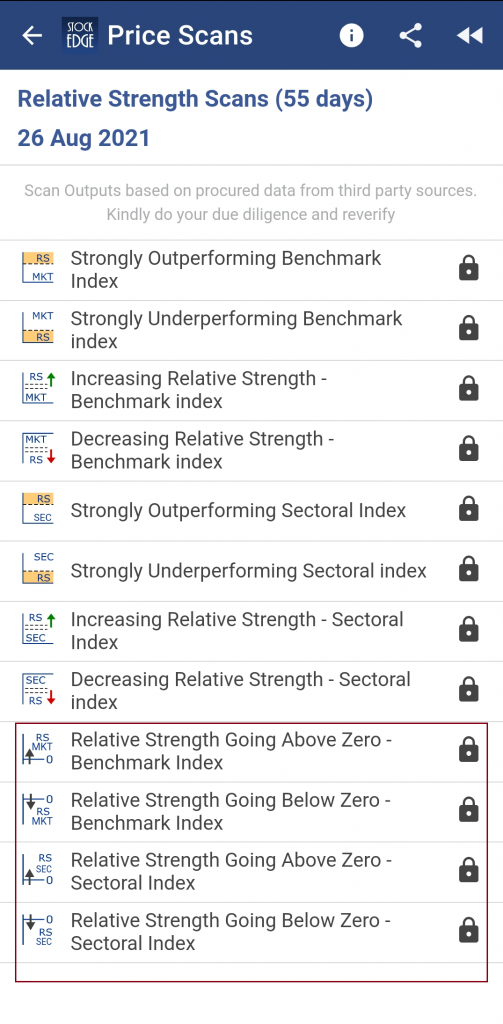
- 4 new Relative Strength scans
StockEdge Free Features include
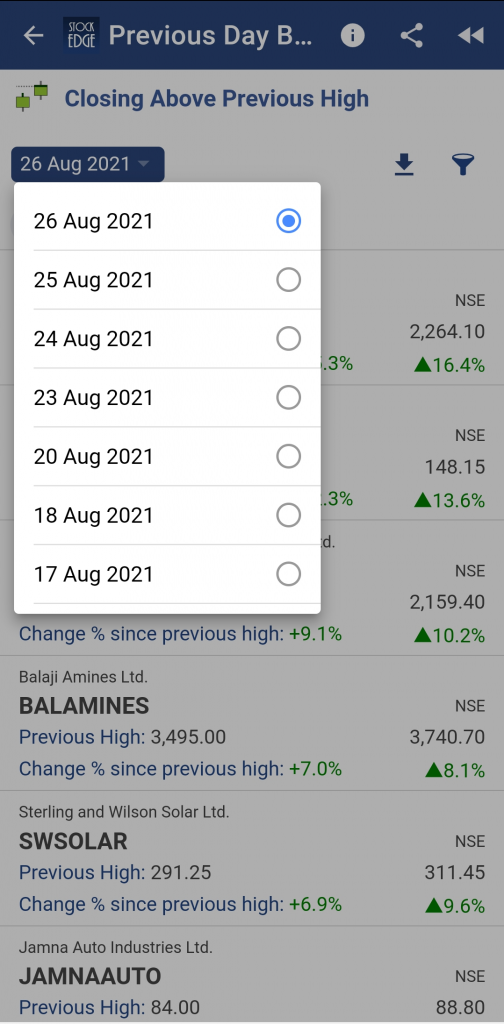
- 7 day historical data is now available for different Scans and Strategies
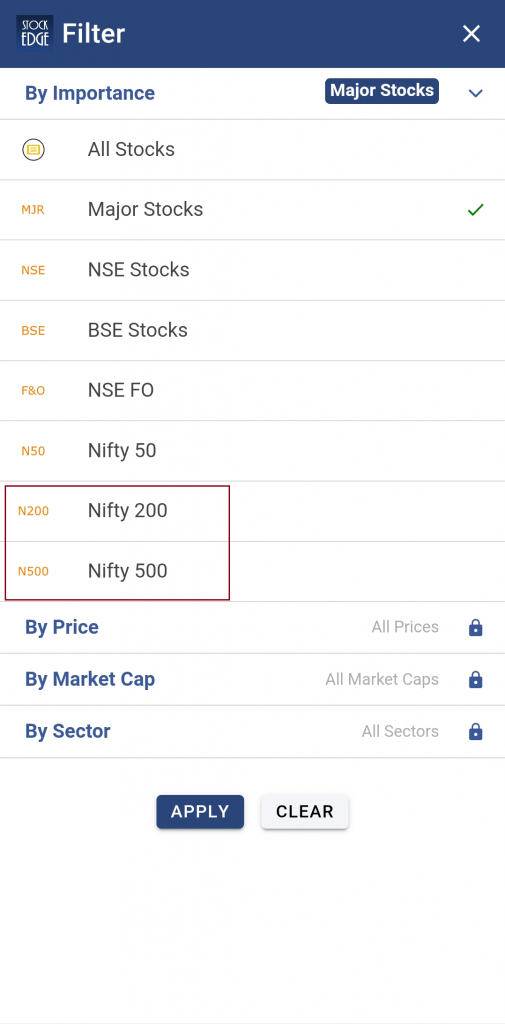
- NSE 200 and NSE 500, 2 new filters under “By Importance” are added to Scans, Strategies and My Combination Scans.
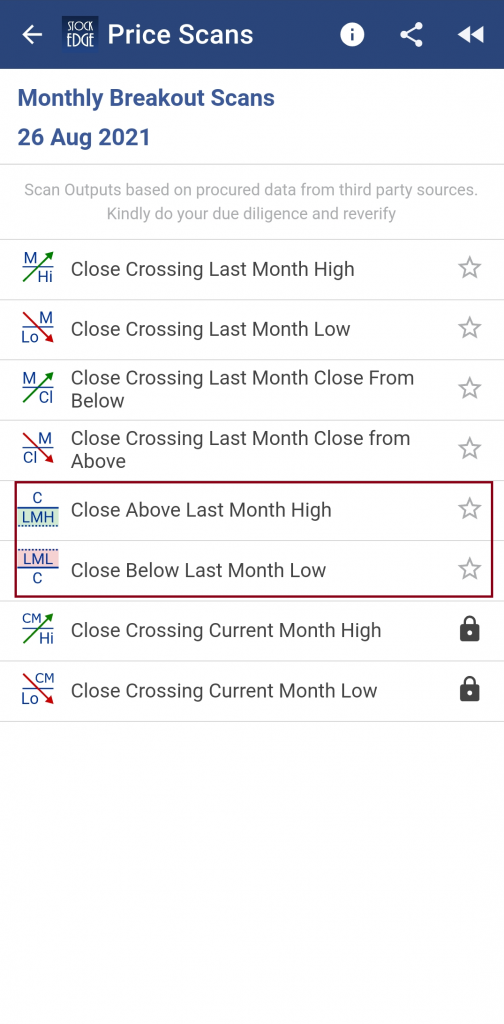
- 2 new Monthly Price scans
- 2 new Weekly Price scans
- Access IPO Notes from the IPO section under the Explore tab
- Shareholding patterns of different DII shareholders is now available
- Exit load of Mutual Funds is now available
To understand the new features better, here is a brief description of them:
DOWNLOAD StockEdge FILES TO CSV:
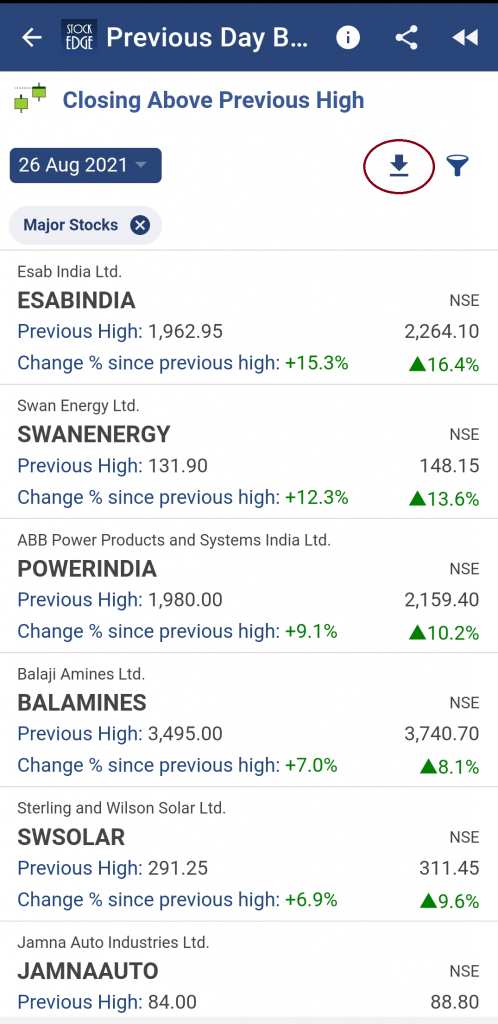
Data displayed on Scans, Strategies and My Combo Scans can be downloaded in CSV format at the end of day daily to enhance equity research.
12 NEW SHAREHOLDING SCANS:
Shareholding patterns of different investors show how the total number of shares outstanding of a company is bifurcated amongst various owners. It is an important indicator which helps in understanding how confident the investors and promoters are in the future performance of the company.
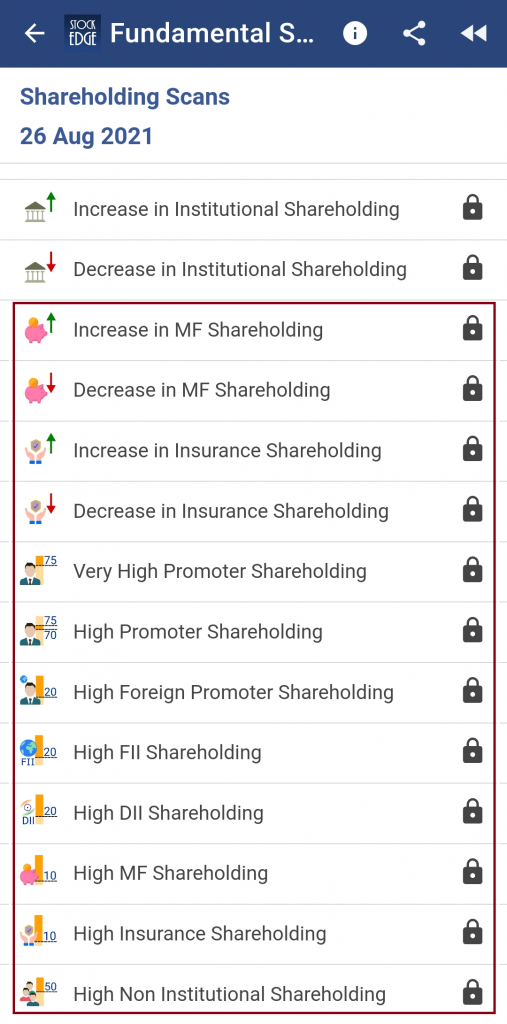
12 new shareholding scans have been introduced to give a better understanding of the shareholding pattern and changes in them for the different type of investors. This data can be used to understand the outlook different investors have on a stock. When an investor(s) increases their holding, it indicates that they are confident about the future prospects of the company and have a positive outlook on the company. Similarly, when an investor(s) decreases their holding, it indicates that they are either pessimistic about the future prospects of the company and have a negative outlook on the company or are booking their profits.
Following are the new scans that have been introduced:
- Increase in MF Shareholding: Mutual Funds have increased their stake in the company indicating that they are optimistic about the future performance of the company.
- Decrease in MF Shareholding: Mutual Funds have decreased their stake in the company indicating that they are pessimistic about the future performance of the company
- Increase in Insurance Shareholding: Insurance companies have increased their stake in the company indicating that they are optimistic about the future performance of the company.
- Decrease in Insurance Shareholding: Insurance companies have decreased their stake in the company indicating that they are pessimistic about the future performance of the company.
- Very High Promoter Shareholding: Promoters’ shareholding in the company is above 75%, which is above the permissible level, indicating a future dilution of the promoter’s stake.
- High Promoter Shareholding: Promoters’ shareholding in the company is greater than 70% and less than equal to 75% indicating that the promoter is confident about the future of the company.
- High Foreign Promoter Shareholding: Foreign promoters’ shareholding in the company is greater than equal to 20% indicating that foreign promoter’s have high confidence in the future performance of the company.
- High FII Shareholding: Foreign Institutional Investors’ (FII) shareholding in the company is greater than equal to 20% indicating that foreign institutional investors (FII) have high confidence in the future performance of the company.
- High DII Shareholding: Domestic Institutional Investors’ (DII) shareholding in the company is greater than equal to 20% indicating that domestic institutional investors (DII) have high confidence in the future performance of the company.
- High MF Shareholding: Mutual funds’ shareholding in the company is greater than equal to 10% indicating that Mutual Funds have high confidence in the future performance of the company.
- High Insurance Shareholding: Insurance companies’ shareholding in the company is greater than equal to 10% indicating that Insurance Companies have high confidence in the future performance of the company.
- High Non Institutional Shareholding: Non Institution Investors (Retail Investors) shareholding in the company is greater than equal to 50%, indicating that Non Institutional Investors (Retail Investors) have high confidence in the future performance of the company.
ALSO READ – FII and DII : Definition, Importance & It’s Working.
4 NEW RELATIVE STRENGTH SCANS:
Relative Strength of a stock measures how a stock performs relative to its benchmark index or related sector index over a period of time. It indicates whether the company has underperformed or over-performed the benchmark. Relative Strength Scan (55 days) is calculated by dividing the percentage price change of a stock over a period of 55 trading day by the percentage change of a market index or sector over the same period.
Following are the new scans that have been introduced:
- Relative Strength going above zero – Benchmark Index: Relative Strength of a stock with respect to its benchmark has gone above zero to enter into the outperforming zone. It has entered the outperforming zone from the underperforming zone, indicating a bullish signal.
- Relative Strength going below zero – Benchmark Index: Relative Strength of a stock with respect to its benchmark has gone below zero to enter into the underperforming zone. It has entered the underperforming zone from the outperforming zone, indicating a bearish signal.
- Relative Strength going above zero – Sector Index: Relative Strength of a stock with respect to its sector has gone above zero to enter into the outperforming zone. It has entered the outperforming zone from the underperforming zone, indicating a bullish signal.
- Relative Strength going below zero – Sector Index: Relative Strength of a stock with respect to its sector has gone below zero to enter into the underperforming zone. It has entered the underperforming zone from the outperforming zone, indicating a bearish signal.
7 DAY HISTORICAL DATA:
This feature lets a user view the 7 day historical data for Scans and Strategies. A user can make use of this data to conduct any comparative study and enhance their research work.
NSE 200 and NSE 500 FILTERS:
NSE 200 and NSE 500 are new filters that have been added under the “By Importance” category of filters. With the implementation of this feature, the user gets additional options of filters to view or study those stocks that match their investment criteria better.
2 NEW MONTHLY AND WEEKLY PRICE SCANS:
Price scans help us monitoring the price movements of the screen stocks.
Following are the new monthly and weekly price scans that have been introduced:
- Close above last month high: This scan shows a list of stocks that have closed above their last month high, indicating a positive signal and that the stock is gaining upward momentum.
- Close below last month low: This scan shows a list of stocks that have closed below their last month low, indicating weakness and that the stock is gaining downward momentum.
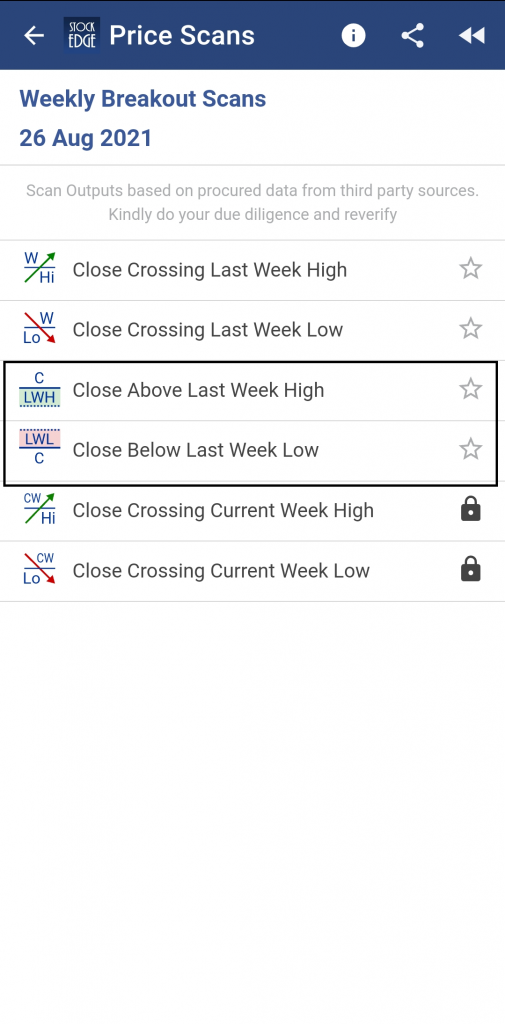
- Close above last week high: This scan shows a list of stocks that have closed above their last week high, indicating a positive signal and that the stock is gaining upward momentum.
- Close below last week low: This scan shows a list of stocks that have closed below their last week low, indicating weakness and that the stock is gaining downward momentum.
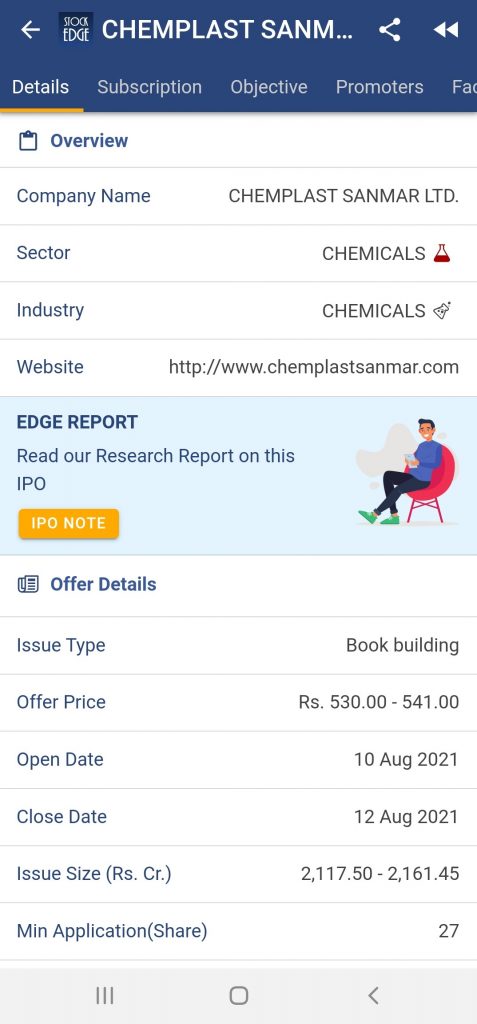
ACCESS IPO NOTES FROM THE IPO SECTION UNDER THE EXPLORE TAB:
With the implementation of this feature, a user can directly access the Edge Report IPO Note from the IPO section under the explore tab. This feature has integrated the website and app and makes it easier for the user to access and navigate the IPO note.
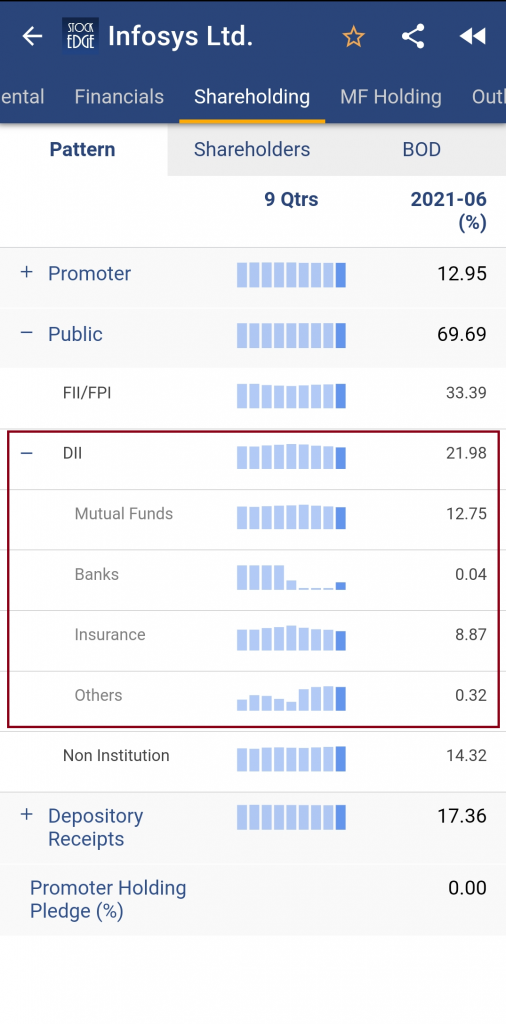
SHAREHOLDING PATTERN OF DII SHAREHOLDERS:
Shareholding pattern is an important element of equity research. With the availability of the DII’s shareholding pattern, a user can get an idea of the sentiment and confidence that DIIs have in the stock.
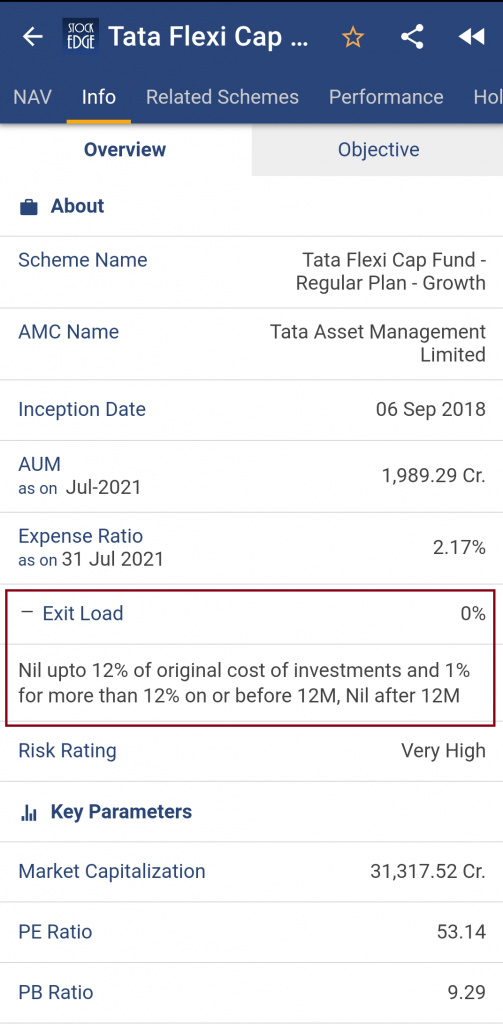
EXIT LOAD IN MUTUAL FUNDS:
The exit load is now displayed in the information section of mutual funds. It enables the investor to know better about the policies of the fund before investing into it.
This is all about StockEdge version update 7.0. With this mega update, StockEdge Team is confident that the new releases will add value to the users and enable them to take more informed decisions when investing into the markets.








Amazing…
MPTY…
Very very obliged for your help to the society and small traders like us.
I pray Maa Durga to give strength to your entire team.
Thank you so much. We are glad you liked the content. Keep following us on Twitter to read more such Blogs!
Brilliant. Herculean efforts.
Thanks for making our life simple.
Brilliant, herculean efforts.
Thanks for making our lie simple.
We are glad you liked the content. Keep following us on Twitter to read more such Blogs!
Download feature is awesome, was always struggling to add individuals stocks to watchlist, now its easy. Thanks to the SE team for continuously improvising this awesome tool
Thank you so much. We are glad you liked the content. Keep following us on Twitter to read more such Blogs!