Table of Contents
Let us dive into FII/DII Data and its impact on stock market. Most of us in our childhood days or early teens have heard this in our house or in social events, “Aaj Sensex 500 badh gya or Nifty 300 upar khula” and our small brains could not comprehend that what’s really the fuss about Sensex, Nifty and all these random numbers.
But as we grew up, we started to learn the basics of the market and also learnt that there are various participants who are majorly involved in changing the market’s direction and their impact is relatively much more than retail investors.
These major players, who can move the market or change its course are called Institutional Investors.
Institutional investors are entities that aggregate money from various investors and other entities and then invest it in different financial asset classes. Foreign Institutional Investors or FIIs, and Domestic Institutional Investors or DIIs are the two types of institutional investors.
Who are Foreign Institutional Investors and what is FII Data?
The full form of FIIs is Foreign Institutional Investors. FIIs are entities that gather money from many sources and then invest it in the financial markets of another country. For example, when American hedge funds participate in the Indian stock market, they are considered FIIs.
FII data refers to information on foreign institutional investors’ investments in a country’s stock market. Foreign mutual funds, pension funds, insurance firms, hedge funds, and other significant financial institutions might be among these foreign institutional investors. The FII data gives insight into the degree of foreign investment in the country’s stock market and aids in determining foreign investors’ general mood regarding the country’s economy. Currency fluctuations can cause FIIs to gain or lose a significant amount of money. Blackrock is one of the biggest FII in the world.
Foreign investment is an essential component of a country’s stock market since it provides the liquidity required to keep the market running smoothly. A rise in FII investment may raise the stock market, while a drop in investment might cause the market to fall. FII/DII data is an extremely important metric for any kind of market participant so we, StockEdge thought of getting this data integrated into our stock market analysis app. For free!
Now let’s get back to what we were discussing.
Restriction for Foreign Institutional Investors (FIIs)
The total investment limit for FIIs is 24% of the paid-up capital of an Indian company and 10% for NRIs/PIOs. In the case of public sector banks, the ceiling is 20% of paid-up capital.
The FII investment ceiling of 24% can be raised to the sectoral cap/statutory ceiling with the board’s agreement and the company’s general body enacting a special resolution. Furthermore, the 10% limit for NRIs/PIOs can be lifted to 24% with the permission of the company’s general body enacting a resolution to that effect.
List of FIIs in India
| Government of Singapore |
| Government Pension Fund Global |
| Euro-pacific Growth Fund |
| Vanguard Fund |
| Nalanda India Fund Limited |
| Small-cap World Fund |
| New World Fund Inc |
| Amansa Holdings Private Ltd |
| Elara India Opportunities Fund |
| Pi Opportunities Fund I |
Who are Domestic Institutional Investors and what is DII Data?
The full form of DIIs are Domestic Institutional Investors. DIIs are entities that obtain money via various means and invest a significant portion of it in the financial markets of their nation. For example, when Indian mutual funds invest in the equity of an Indian firm, they are considered DIIs in the Indian stock market.
DII data refers to information on domestic institutional investors’ investments in a country’s stock market. It includes mutual funds, pension funds, insurance firms, and other significant financial organizations. The DII data gives insight into the degree of domestic investment in the country’s stock market and aids in determining domestic investors’ general mood regarding the country’s economy. India’s biggest DII is LIC.
Domestic investment, like foreign investment, is vital in the stock market. A rise in DII investment can improve the stock market, but a drop in investment might cause the market to fall.
List of DIIs in India
| President of India |
| SBI Group |
| ICICI Group |
| HDFC Group |
| Kotak Mahindra Group |
| Reliance Group |
| Axis Group |
| Birla Group |
| Sundaram Group |
| General Insurance Corporation of India |
What are the different types of Institutional Investors?
- Hedge Fund
Hedge Funds are FIIs and DIIs that combine money from diverse investors and invest on their behalf. Hedge funds are distinguished by the fact that there are no regulatory restrictions on the use of leverage. The Hedge Fund’s most essential attribute is that it frequently takes a long and short position or a hedged position in assets. They also employ a variety of other risk management approaches to mitigate the risk.
- Mutual Funds
Mutual funds are pooled investment entities that purchase securities using money contributed by many participants. Through this fund, investors who lack sufficient understanding can profit from professional cash management. The money is invested in equity and debt asset classes that are exchanged in the market. Mutual funds charge fees to each plan, which are deducted from the client’s account.
- Private equity funds (PE Funds)
Private equity funds are pooled investment vehicles having a Limited Partnership form and a fixed duration of typically ten years. These funds offer equity finance to private companies that cannot attract cash from the general public. As a result, these investments are inherently illiquid. P/E funds frequently engage in venture capital financing, in which they lend funding to up-and-coming organizations in whom they perceive enormous untapped potential. P/E funds often have a high minimum investment level, and this option is exclusively available to HNIs. Because P/E funds are high-risk, investors expect a significant return on their investment.
How do FIIs and DIIs work?
Both FII and DII have high-quality research teams and are registered with the Security Exchange Board of India (SEBI). Compared to DIIs investment, the focus is more on FII investment and activities because of their research quality.
Based on the research FII and DII invest, in particular security like stocks, bonds, etc. but the quantity is really huge. There is no need to mention that the purchasing power of FIIs is much bigger than DIIs which gets reflected on the FII/DII Data of the market. That is why FIIs and DIIs are named as market movers because their buying and selling quantity moves the market direction.
Importance of FII/DII data for Retail Investors
A retail investor can follow the footprint of FII/DII Data like where they are investing, which security they are buying or selling etc. What we can do as retail investors is that by following their steps, we can earn a decent amount of money without any kind of research or spending any time to find a good quality stock. As an individual, we know it is really very difficult to find out all the necessary information about a company while researching a stock. So in the research part, we can rely on them to a certain extent.
When FIIs/DIIs are investing in some particular company, it is a good hint for us that the stock might perform in the future and we can invest in such a company. So money inflow in the FII/DII Data work as a good indicator.
We can do the same when they are taking an exit from a stock. If we are holding that stock and they are taking their money out, we can decipher that the stock has reached its optimum level now we should book our profit.
How to monitor FII/DII Data from the StockEdge App?
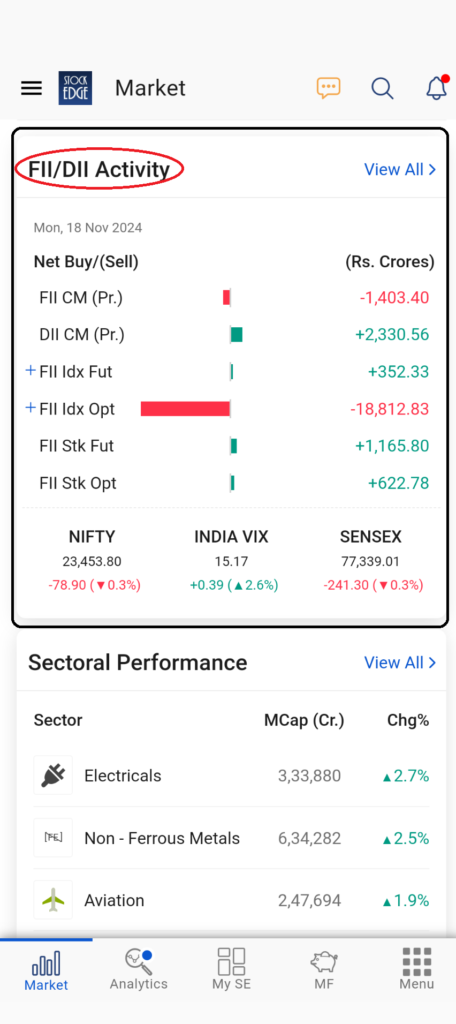
In order to monitor this data, we understood that having an application at hand becomes easy for retail investors like us to analyze FII/DII Data and make informed decisions. So in the section of FII/DII data, there are four different tabs in this section. We will cover them one by one.
Monitor FII/DII Data Daily
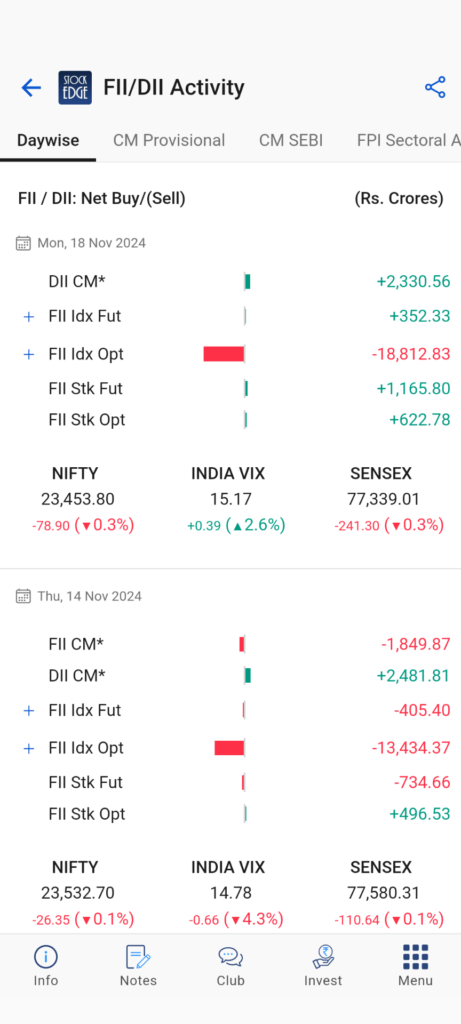
In this tab, you will find net buying and selling done on a particular day, from the FII/DII Data. Data are represented by the positive and negative bars which make the whole picture very easy to understand at one glance. There is also data available for the last ten trading days. Along with that, you will also find the current market price of Nifty and the status of India vix for each day.
Meaning of CM Provisional in FII/DII Data
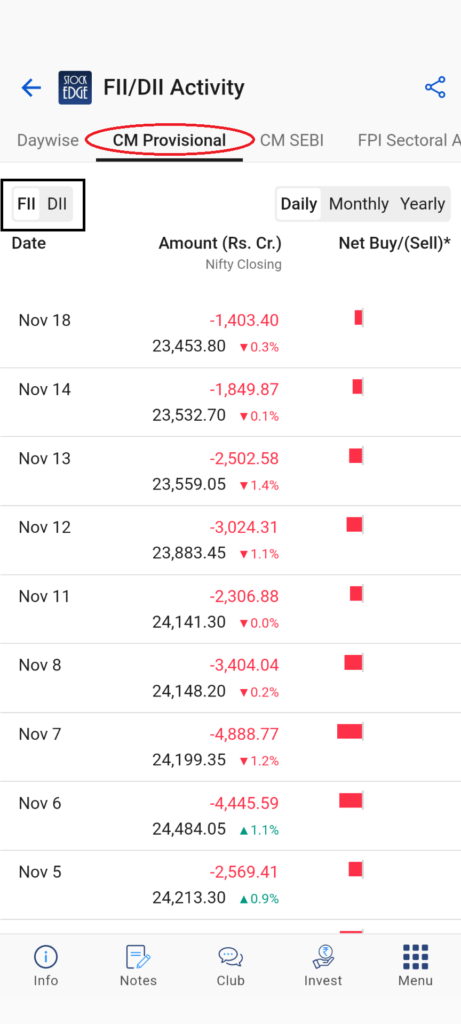
CM provisional tab provides net Buying and Selling data only for the cash market. We can also switch between the tabs by clicking on FII/DII Data to check their activity. To check the Monthly or Yearly activity, we have to click on the Monthly and Yearly tab. The daily tab provides the data for the latest quarter but in the monthly and yearly tab, data is available for the last ten years. Please remember these data are provisional data, not accurate data. These data are provided by brokerage houses.
Meaning of CM SEBI in FII/DII Data
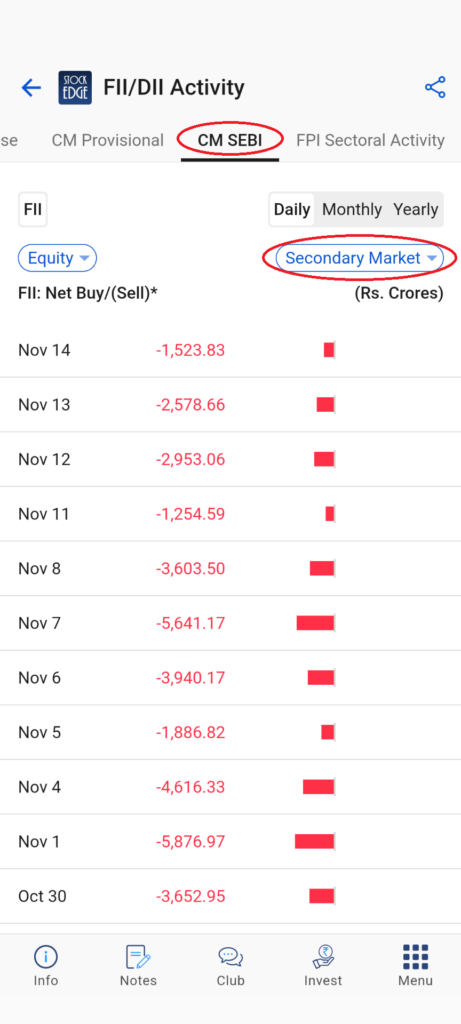
This tab is quite similar to the CM provisional tab but the data here are accurate and only FII data is available. SEBI provides this data and they are backed by FII custodians. In this tab, we can also Switch between Daily, Monthly, and Yearly data just like the CM provisional tab. Here two more things are added here –
We can switch between the different markets like Equity and debt by clicking on the Equity tab. Also, we can switch between Primary and Secondary markets by selecting the Secondary Market option.
Meaning of Derivatives in FII/DII Data
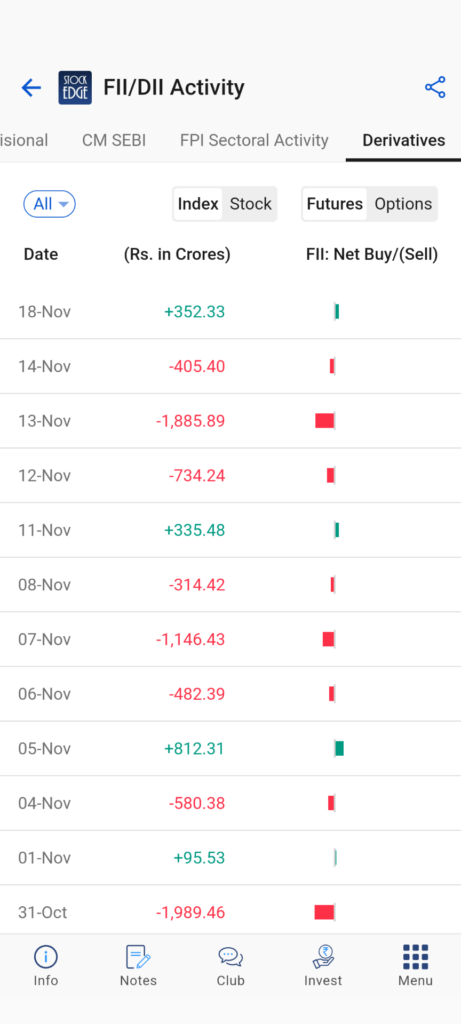
The Derivatives tab only focuses on the Derivatives data of FII. Here we get the data for Index Future, Index option, Stock option, and Stock Future. The latest quarter data is provided here for all the four-segments. Traders who love to trade in Future markets and options would find this tab very handy and useful.
At a glance, you will have an overview of the whole Derivative Market transaction done by FIIs.
Impact of the FII/DII Data on Stock Market
- Market Trends
FII/DII data play a significant role in the equity market. It helps to determine the stock market’s overall trajectory. When FIIs and DIIs invest in substantial numbers, it implies a good market view, and stock values rise. Conversely, when FIIs and DIIs sell a large share, it means a pessimistic market view, and stock values tend to decrease.
- Stock Performance
FII and DII investments can also substantially influence individual stock performance. When many FIIs and DIIs purchase shares of a particular company, the stock price rises, resulting in a favorable arrangement for the stock. In contrast, if many FIIs and DIIs sell shares of a specific company, the stock price will fall, resulting in poor performance for the stock.
- Volatility
The existence of big FII and DII investments can also influence stock market volatility. When large quantities of money are invested, the market is less volatile because the buying and selling of shares are more evenly distributed. Conversely, when vast amounts of money are withdrawn, the market becomes more volatile because the sale of shares outpaces the purchase of shares.
The Market Importance of FIIs and DIIs
- Individual Investors Benefits
FIIs and DIIs have pooled investment vehicles in which a group of investors pools their money to establish a large organization that can invest on their behalf. Because not all investors can take positions in securities that demand significant capital commitments, such benefits are available through institutional investors. They also have their own teams of highly skilled employees that analyze securities and monitor markets. Professional management is present at all levels. Individual investors who lack all of these abilities benefit from highly skilled expert money management.
- Important for Capital Source
FIIs and DIIs are significant sources of capital in the economy. They give vast sums of funding to enterprises that meet their criteria without relying on many small investors. In addition, investment banks frequently solicit institutional investors to purchase shares before an IPO to guarantee that the IPO is highly subscribed. It lessens their reliance on retail investment.
- Preferred Treatment
Because FIIs and DIIs have benefits in the market due to the large scale of their assets, they are given preferential treatment in terms of cheaper transaction fees, faster order execution, and so on. This saves time and money, eventually benefiting the investment pool participants.
Challenges from FIIs and DIIs
- Market Power:
FIIs Data and DIIs Data wield enormous market influence because they may alter the value of securities by entering or quitting positions in particular securities. They can occasionally use their power to sway the market or the price of a specific security in their favor.
- High reliance:
As previously said, FIIs and DIIs offer vast sums of cash to organizations that lessen their dependence on ordinary investors. However, it increases their dependency on Institutional Investors. If they decide to abandon a position, the price of that investment may suffer as the market interprets this as a warning sign.
Watch this video to know more about how to use FII/DII Data segments:
Yes, the FIIs/DIIs have the power to sway the market but being a trader or investor in the stock market it is of great importance to identify the strong sectors in order to identify strong stocks. That’s where tracking the investments by the FPIs can guide you.
Who are FPIs?
FPIs are Foreign Portfolio Investors who are eligible to invest in foreign securities of a country, which includes stocks, bonds, etc. In India, an FPI must be registered under the SEBI (Foreign Portfolio Investors) Regulations, 2014. They are required to disclose the movement of funds in various Sectors of the Indian Stock Market every fortnight.
How does FPI activity affect various sectors of the Indian stock market?
FPIs invest in different sectors of the Indian stock market through several investment routes like Equity, Debt, Hybrid (combination of two) and Debt (VRR) Voluntary Retention Route, which basically means voluntarily committing to the retention of a minimum percentage of their overall investments for a time span of their choice.
However, being a trader or investor in the stock market, the main focus is to track the FPI sectoral activity in the equity segment, which can help you identify the strong sectors of the market.
Sectoral Classification for FPIs
The sectors are classified based on the Common Industry Classification Structure used by both the stock exchanges (NSE and BSE). Further, BSE implemented a 4-level classification structure which includes 12 macro economic sectors, 22 sectors, 59 industries and 197 basic industries.
You can get the list of stocks under sectors and industries from the Industry Watchlist by BSE.
How do you track FPI sectoral activity?
StockEdge app gives you the power to track the activities of FPIs in different sectors of the market. However, it is important to note that sectors listed under the StockEdge could differ from the FPIs sectors because of the fact that they are classified into sectors & industries according to the products and services offered by them and not by Common Industry Classification Structure implemented by stock exchanges.
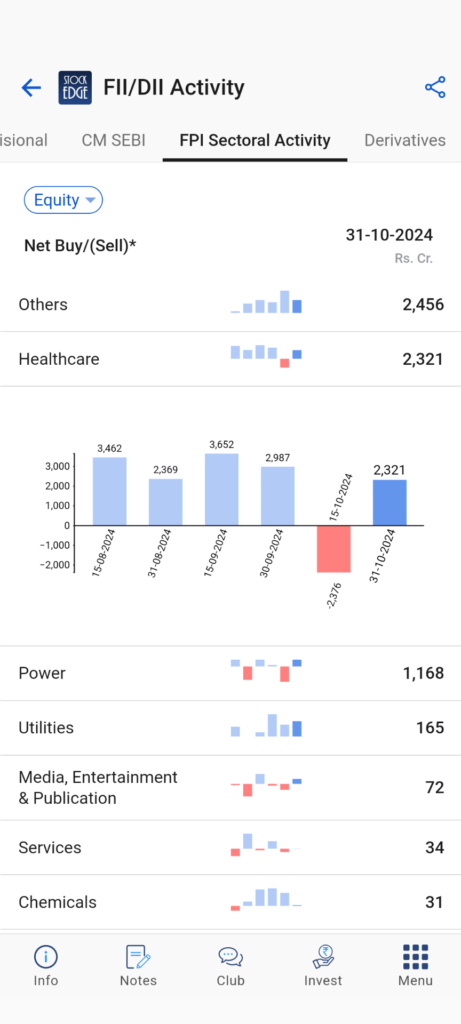
As on 31st Oct 2024, the above screenshot shows the net buy/sell in equity segment made by the FPIs in different sectors of the market. It shows the FPI sectoral activity for the past 3 months. Each bar shows the net position of the FPIs in a particular sector.
For instance, if you look closely at the healthcare sector where FPIs have been holding its net buy position till Sep 2024, but there was a minor dip just preceding the latest fortnight. But again, it has turned net buyer in the sector. Therefore an increase in investment by the FPIs in a particular sector shows its strength in upcoming days. The reason behind showcasing the FPI sectoral activity for 3 months is to provide you with an overall trend in that sector.
Kindly note that the data is updated every fortnight based on the availability of data from the depository.
As a trader or investor in the stock market, you can make informed decisions by tracking the investment trend of FPIs in the sectors.
Frequently Asked Questions
Why FII and DII are opposite?
Both have different styles of investing in India. DIIs tend to hold stocks for the long term whereas FIIs have a medium- to the short-term horizon. According to research conducted on the trading behavior on FII/DII Data in the Indian stock market scenario, it is evident that they adopt opposite trading strategies.
Who are FIIs in India?
EURO PACIFIC GROWTH FUND, Govt. of Singapore, Vanguard is the top FIIs in India.
Who comes under DII?
Indian Mutual Funds like HDFC AMC, Indian Insurance Companies like LIC India, Local Pension Funds, and Banking & Financial Institutions come under DII.
Key take-aways from this research
Making a mistake is quite common while choosing a good quality stock after all we are human beings. Even FIIs or DIIs can also make mistakes, so fully depending on them for stocks would be very risky without any kind of market knowledge.
It is very difficult to time our entries and exits along with their entries and exits. We do not want to invest when the price has reached its optimum level. It is not a bad idea to make a decent amount of money by following the market movers but you should also know when to enter when not to. So market knowledge is always important. You can join our StockEdge club to stay updated about the market and on this platform we share stock ideas, knowledge related to different types of analysis, stocks, bonds, etc. Here your every query related to the market is answered by experts.
StockEdge application can help you from finding out FII/DII activities to what stock you should invest in based on your pre-defined conditions from the FII/DII Data Apart from that, there are also some other exciting features including educational videos and study material and many more interesting features.
Click here to know more about the Premium offering of StockEdge.
You can check out the desktop version of StockEdge using this link.
Also Read more blogs from StockEdge blog pages.







Thanks for this.
I have a question. Can we track live FII/DII data from CM Provisional tab? Or it is upated only by EOD?
Thanks for this.
I have a question. Can we track live FII/DII data from CM Provisional tab when market is open? Or it is upated only by EO