- What is a sector?
- Classification of Sectors
- What is a Top-Down Approach?
- What is a Peer to Peer Analysis?
- What is Sector Rotation?
- Sector Rotation Strategy with StockEdge App
- Peer Analysis of Realty Sector with StockEdge
- How to Identify the Strong Stocks from the Realty Sector?
- Where to Find Sector Rotation in the App?
- The Bottom Line
Markets are currently at an all-time high! How is the performance of your portfolio? We are sure it’s on the right track if you’re regularly using StockEdge for all your data analytics and market insights. But if your portfolio is struggling to generate alpha, even when markets are hitting new highs, then the process of your stock selection needs to be worked upon.
An important insight about the stock market is that “Not every sector or stock is bullish when markets are positive, and not every sector or stock is bearish when markets are negative.”
A few selective sectors or stocks are always relatively more robust than the others because sectors move in phases or cycles.
“If you are in the right sector at the right time, you can make a lot of money real fast.”
– Peter Lynch
What is a sector?
The Indian stock market is incredibly vast, boasting a staggering number of approximately 6,819 listed companies across NSE (National Stock Exchange) and BSE (Bombay Stock Exchange) as of FY 2022.
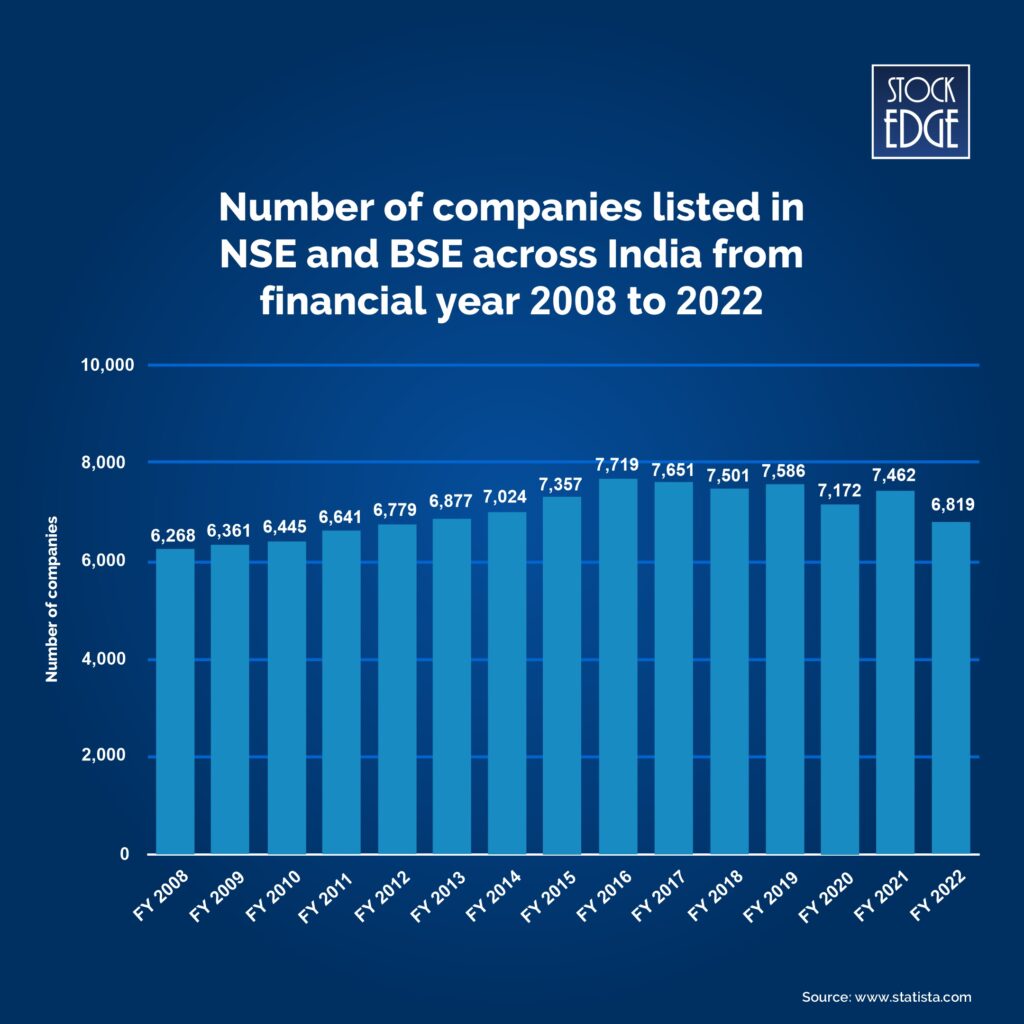
In the context of investing, a sector refers to a specific category or group under which companies with similar business activities or characteristics are grouped together. These sectors act as classifications that allow investors to evaluate and analyze companies based on their industry or nature of operations. However, in context of sectors of Indian economy, there are three primary classifications of sectors:
Classification of Sectors
- Primary Sector:
The primary sector comprises activities related to the extraction or production of natural resources. It includes agriculture, forestry, fishing, mining, and related activities.
- Secondary Sector:
The secondary sector involves transforming raw materials from the primary sector into finished goods. It includes manufacturing, construction, and industrial activities. This sector adds value to the products by processing or assembling them. Examples of the secondary sector in India include automobile manufacturing, textile production, etc.
- Tertiary Sector:
The tertiary sector is also known as the service sector and encompasses activities that provide services to individuals and businesses. It includes sectors such as banking, education, healthcare, transportation, tourism, and telecommunications.
But, sectors of the stock market are majorly divided into Defensive and Cyclical sectors.
All these classifications allow investors to gain insight into different aspects of the economy and make informed decisions regarding sector-specific investments.
But where to find such valuable insights about sector classification?
StockEdge is a valuable tool that offers a wide range of market data, analytics, and research features to assist investors in making informed decisions. With StockEdge, one could easily access the list of different types of sectors and gain insights into their performance, trends, and potential opportunities.
How many sectors in stock market?
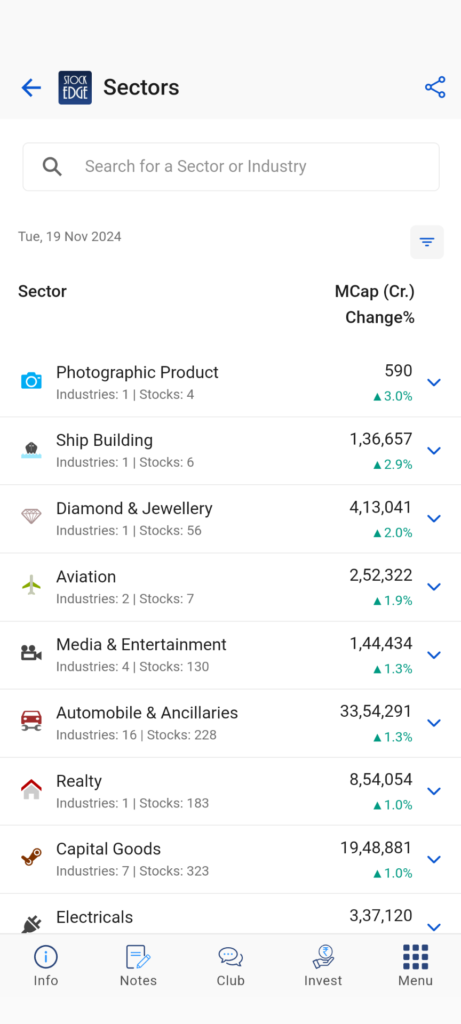
So, in order to identify sectors which are fundamentally strong and have the potential to grow, you need to conduct a top-down analysis.
What is a Top-Down Approach?
A top-down approach is an investment strategy consisting of three steps. They are:
- Analyzing the economy
- Analyzing the sectors in the economy
- Analyzing company financials
It helps understand key macroeconomic indicators such as GDP growth, inflation rates, interest rates, unemployment rate and government policies. These factors can offer valuable insights into the overall health and direction of the economy.
But as you get a grasp of the broader economic landscape, you must assess specific sectors that are expected to benefit from the prevailing economic conditions. For instance, during periods of economic expansion, sectors like technology, consumer durables, and Banking tend to perform well. Conversely, during economic downturns, defensive sectors such as the healthcare and FMCG sector perform.
For example, recently, the Indian government has been focusing on infrastructure development of the country, which gives an indication of conducting a deep-dive analysis of the infrastructure sectors and the stock listed under it.
Further, once the potential sectors are identified, delve deeper into the specific factors influencing those sectors, such as:
- Market Size
- Competition
- Regulatory environment
- Demand-supply dynamics
- Technological advancements
- any sector-specific challenges.
Post identifying the strong sectors from a top-down approach, the last step requires finding out companies which are financially strong and have the potential to outgrow others in its peer group. This can be easily done through a peer to peer analysis.
What is a Peer to Peer Analysis?
Peer analysis involves comparing the financial and operational performance of companies operating within the same sector. By examining how companies within a sector stack up against each other, we can gain valuable insights.
So, how to compare the financial performance of companies in a particular industry or sector? With StockEdge it can be done very easily. Here is a step by step guide:
Step 1: Click on the Sector icon.
Step 2: Get the list of all sectors, like shown earlier.
Step 3: Select the desired sector for a peer analysis.
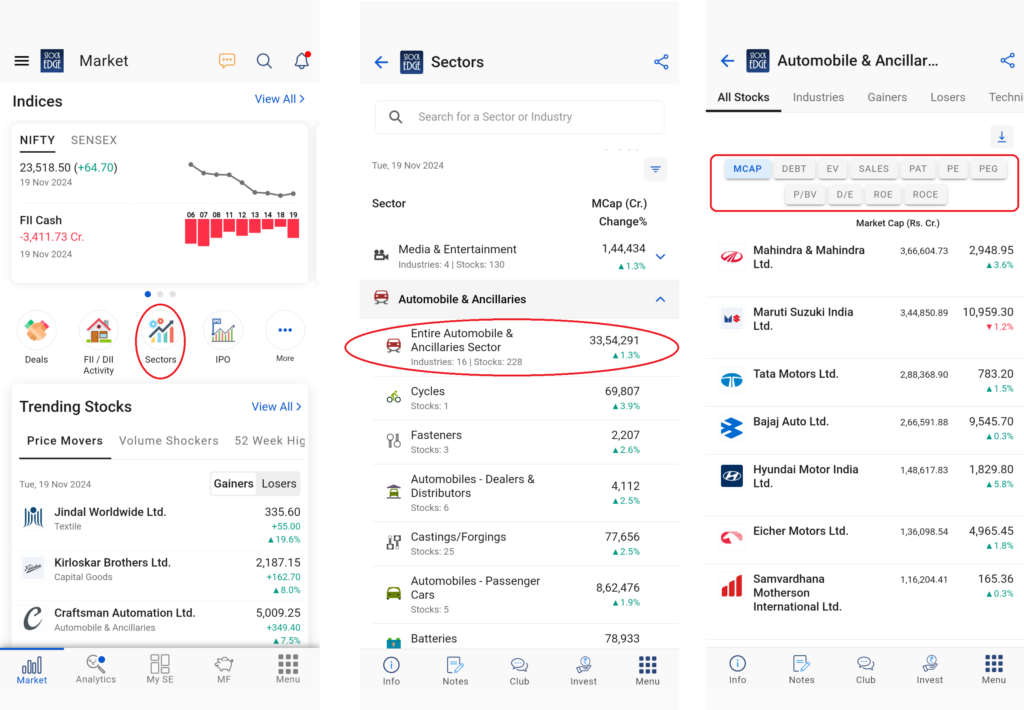
You will see the list of all stocks in that sector and a number of financial details like:
- Debt
- Sales
- Profit After Tax (PAT)
- Market Capitalization of the companies. (MCAP)
- Enterprise Value (EV)
You can also compare the stocks based on key financial ratios like:
- Price to equity ratio (PE)
- Price to book ratio (P/BV)
- Price to equity growth ratio (PEG)
- Debt to equity ratio (D/E)
- Return on equity (ROE)
- Return on capital employed (ROCE)
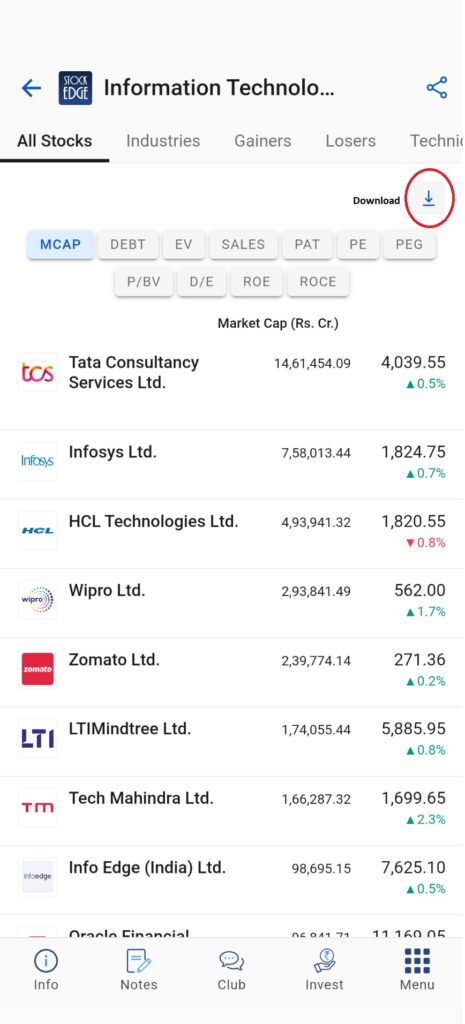
Not only could one conduct in-depth analysis using StockEdge, but could also download the data in Excel format for seamless and extensive analysis. This feature opened up a whole new realm of possibilities, allowing them to dive deeper into their research and make informed decisions.
For example, here is a list of IT sector stocks, where you can conduct a peer analysis based on company fundamentals.
Till now we have learned to identify strong sectors from an economical point of view. Although economic factors play an important role in identifying sectors with a positive outlook, solely relying on economic data and fundamental analysis will not be much of a benefit if you are not emphasizing on the technical aspect as well.
It is important to incorporate technical aspects to identify sectors with strong momentum.
Technical indicators, such as exponential moving averages, trend lines, and relative strength index, etc., play a crucial role in assessing sector performance. By analyzing price movements and comparing the strengths of different sectors, investors can identify sectors that are expected to outperform others soon.
Let’s now understand Sector Rotation from a technical point of view.
What is Sector Rotation?
Sector rotation is a top-down investing strategy involving moving money from one industry sector to another in anticipation of different business cycle stages to beat the market.
It is just like the tactical asset allocation strategy, but instead of asset class and liquidity shifting, the money moves as per the expected performance of sectors. The prediction of Sector rotation is plausible because the market moves in reasonably predictable cycles, and a specific set of industries dominate a given market cycle.
Sector Rotation Strategy with StockEdge App
Now, you can identify not only strong sectors but also strong industries which come under an overall sector. In StockEdge, the entire feature has been broken into three segments, making it easier for you to identify strong sectors in the stock market.
- Breadth
- Delivery
- VWAP
So, when you click on the icon, you will be taken to the “Breadth” tab of that feature. But what exactly is breadth? In simple terms, the breadth of a sector refers to a set of technical indicators that evaluate the price advance and decline of stocks under a sector, giving you an overview of the sector’ strength and weakness in the market.

This section shows sector wise stock list plotted from strongest to weakest based on technical criteria such as:
- RS 55 > 0 (positive) – Identifies Relative Strength
- RSI > 50 – Captures Momentum
- Simple Moving Average of periods 20, 50, and 100 days. – Defines the trend. When more stock trades are above the 20 SMA, suggest short-term bullish momentum; when more stock trades are above the 50 SMA, suggest bullish momentum in the medium term, and when more stock trades are above the 100 SMA indicates bullishness in the long term.
Please note that different shades of green represent varying levels of strength within sectors. The deeper shades of green at the top indicate maximum strength, suggesting strong bullish momentum that may continue. It’s a good idea to consider strong stocks in these sectors for potential investment. As you scroll down, shades become lighter, indicating sectors that have just begun to show bullish strength. Entering stocks in these sectors could be advantageous in the future. Yellow signifies the neutral zone for a sector with no significant movements. As shades turn to orange and deep red, it indicates weakening strength in the sector. It’s advisable to avoid bullish trades in these sectors. The changing colors within sectors reflect the strength observed on a particular day.
Now you can see that “Banking” is at the top spot with the greenest shades under different headers of RS 55, RSI 50, SMA 20, SMA 50, and SMA 100.
Under each header for the respective sector, you will see a % which indicates that % of stocks in that sector satisfy the criteria to be under that header.
E.g.:- 81% of stocks out of the 37 stocks in banking fulfill the criteria to be in RS 55, 89% of stocks in RSI 50, 92% in SMA 20, 86% in SMA 50, and 92% of stocks from banking in SMA 100.
The banking sector is the strongest among all sectors, with approx 90 % of stocks with great momentum and trend. It’s slightly overheated, and some profit booking may be expected at these levels. Further check of the technical chart setup validates the view.
NOTE:- A word of advice from our Co-founder Mr. Vivek Bajaj “Extreme green and extreme red indicate high greed and fear zone. So, if someone entered Banking when it was in the lighter shade of green and now when you see that stocks from the Banking are in extreme green shade or zone, it’s time to book profits.
Now, let’s take a look at where the Banking Sector was 7 days back by clicking on the drop-down section of the Date.

We clicked on 31st Oct 2022.
Now, we see that Banking was in the 2nd spot. You can see the data for each header and how stocks have gained momentum and have gradually moved to the top spot-on 9th Nov 2022.
You will also notice that stocks from the Gas Transmission sector were heavily bought as of then, and that’s when profit booking should have been done.
On 9th Nov 2022, we see Gas Transmission at the 6th spot and momentum shifting to banking and other sectors like Photographic products and Ship Building.
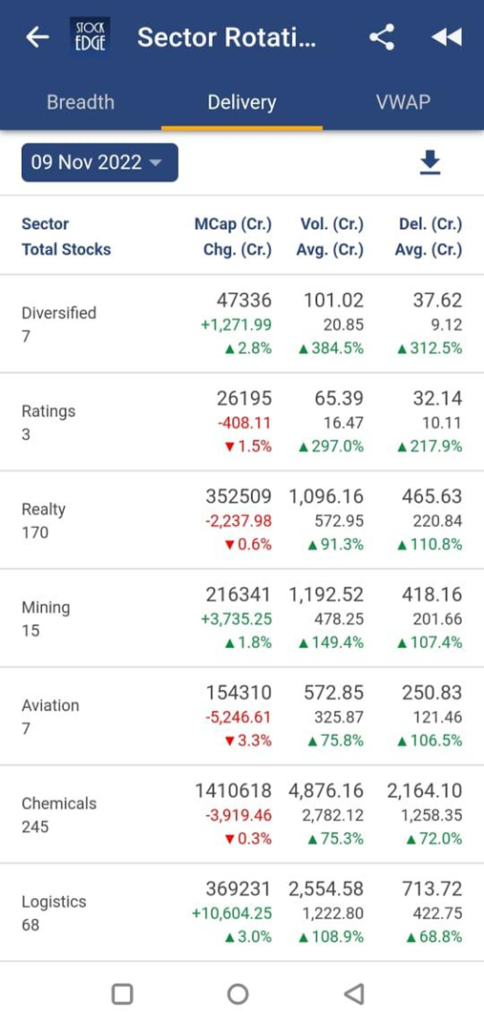
Coming to the next tab, which is the “Deliveries “tab. Under this you will find three different columns which are:
- Change in Market Cap
- Volume vis a vis Avg Volume of 5 days
- Delivery vis a vis Avg Delivery of 5 days
Now, based on these above parameters you can identify which sectors or industries are gaining interest among market participants that can be interpreted when there is higher volume in a particular sector or industry. But the interpretation of delivery data for a particular sector is of higher importance because when sectors which have higher delivery along with rise increase market cap generally reflects buyer’s demands in that sector. It usually suggests confidence in that sector’s potential for near-term growth or stability.
This tab gives us a picture of how the delivery data looks daily.
Looking at the picture below, you will see that stocks in the “Diversified” Sector are at the top spot. And that’s because there is a spike in delivery by 312.5% and a spike in volume by 384.5%.
The 3rd and last tab is the “VWAP” tab.
To give perspective, VWAP is the average price a security has traded throughout the day, based on both volume and price. It is important because it gives traders an insight into a security’s trend and value. So, when stock price trades above its VWAP it is generally considered bullish and vice versa. Hence when more stocks in a sector are trading above their VWAP reflects the overall strength in that sector or industry is strong.

So, from this data, you get to know that out of 37 stocks, 26 stocks’ closing price is above VWAP.
You need to combine these insights and use them for your trading/investment strategy.
How to identify the right Sector?
Generally, the best sectors where the participants can trade or benefit is from the 2nd row to the 5th row. This is not a fixed rule by any means, but the key is to identify sectors which still have the potential to go up.
Here is a perfect example of the realty sectors, where 97% of stocks in that sector are trading above RS (55) > 0, – Showing its relative out performance over other sectors.
94% of the stocks trading above RSI > 50, – displaying that 94% of stocks are trading with bullish momentum.
93% stocks are trading above its 20 days simple moving average and 96% of stocks are trading above both the 50 days and 100 days simple moving average, defining that the short term , and medium term trend for 96% stocks of the Real Estate sector is up.
You can also tap on count to show the number of stocks that are fulfilling the above technical criterias.
Now let’s identify stocks exhibiting strong momentum in the real estate sector. To do that, we have introduced Sector Rotation Level II in StockEdge. This feature basically lets you conduct a peer to peer analysis of the stocks of a particular sector based on technical parameters.
Peer Analysis of Realty Sector with StockEdge
Selecting the realty sector and navigating to the technical tab (as depicted in the image below), a comprehensive list of stocks in the real estate sector is displayed, accompanied by an array of technical parameters for in-depth analysis. Within this section, there are two distinct tabs available. One tab showcases technical levels for each stock, covering
- Daily high- low,
- 52-week high- low ,
- Simple Moving Average (SMA)
- Exponential Moving Average (EMA),
- Pivot
- Supertrend, and more, as highlighted in the provided screenshot.
Going forward with realty sectors, here is a list of real estate stocks where you can conduct a peer analysis based on the technical aspect.
The other tab shows a comparison of various technical indicators. You can choose from four different categories of technical indicators (as shown below) based on:
- Momentum
- Relative strength
- Trend
- Volatility
Under each category, you get a bunch of technical indicators, as highlighted in the case of relative strength indicators.
Now, you might ask which technical indicators should be prioritized in order to identify strong stocks, given the diversified options offered by StockEdge.
The best way is to select a few essential technical indicators that you personally rely on. In this case we are taking moving averages and the relative strength of a stock in comparison to both the market and the sector. It is important to note that different individuals may have varying strategies based on their risk-reward preferences.
How to Identify the Strong Stocks from the Realty Sector?
To identify strong stocks within the realty sector, the first step is to align with the trend. Moving average is an excellent tool to identify the trend of the stock.
First identify stocks that are trading above the major moving averages, as this indicates a strong uptrend. Check the highlighted stocks:
Here, Macrotech Developers and Prestige Estate are the two stocks that are trading above all its major simple moving averages (SMAs), indicating a strong upward trend of the stocks.
Next, to confirm whether these two stocks are outperforming the broader market or not. Use Relative Strength. Check the highlighted stocks:
Although both Macrotech Developers and Prestige Estates are outperforming as the RS (MKT) is positive, however, all the other stocks are also outperforming the market, as the overall realty sector is in a bull run.
Now to check which stocks are also outperforming the sectoral index as well. Changed to RS SEC, which shows the relative performance of the stock vis a vis; the sectoral index.
Doing so, the scenario changes!
The stocks which are highlighted in red are outperforming the market but underperforming the sectoral index.
The stocks highlighted in green, Macrotech Developers and Prestige Estate, are outperforming both the market and sectoral index, which indicates they are currently the strong player among their peers. Hence investing in these two may have higher probability of generating alpha in their portfolio.
To know more about Technical Peer Analysis, a comprehensive guide is available here.
Where to Find Sector Rotation in the App?
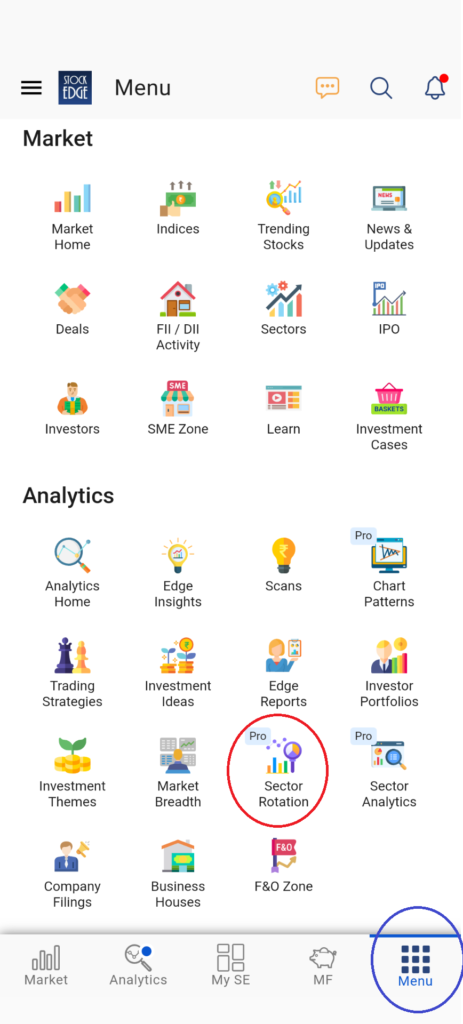
When you open the StockEdge App, go to the Premium Analytics Section. Under this, you will see Sector Rotation. Click on the icon, and you will be able to use it as shown in this blog.
You can watch our video on Sector Rotation and Technical Peer Analysis by Mr. Vivek Bajaj
The Bottom Line
Sector rotation serves as a popular strategy for active investing and trading, involving the strategic movement between sectors based on economic conditions and analysis of both company fundamentals and technical indicators. By adopting a balanced approach that considers both fundamentals and technical parameters, investors can gain a broader perspective on sector rotation.
This approach enables the identification of strong contenders within sectors, providing an opportunity to outperform the market and build a robust portfolio.
We hope you found this comprehensive guide on utilizing sector rotation and the peer-to-peer analysis feature in StockEdge valuable.
Wishing you successful and prosperous investing with StockEdge!







hi, this is very unique and excellent concept to find sectoral move and vwap and other details. congratulations.
very nice and knowledgeable about this stockedge app we get most valuable information about all types of problems solved by stockedge application
Thanks for valuable information.
keep it up.
Hello sir/mam
Thank you so much for giving us this diamond strategy. We have been waiting for a long time. We can see the StockEdge team working very hard to provide us precise and valuable data … wishing you all the best.
Superb feature
thank You sirji
Nice efforts to summarize various aspects of a particular stock, to help the investors, to note down the plus and minuses of that particular sector and do the due diligence, as well , before putting in, their hard earned money.
Best app sir
Thankyou for this amazing feature
This is the best feature and well elaborated in this blog and well-understood thanks to stockedge team
Really helpful to know trend
very nice knowledge l learn one more step towards well investment.