StockEdge.com
  • Go Premium
    • StockEdge Quarterly Plan
    • StockEdge Annual Plan
    • StockEdge Analyst
    • StockEdge Club
    • Compare Plans
StockEdge Blog
  • Trending Stocks
  • Insights
    • All
    • Business Houses
    • Markets themes
    • Stock Insights
    How Page Industries is creating a “branded” opportunity in a fragmented market

    How Page Industries is creating a “branded” opportunity in a fragmented market

    5 Stocks which are Consistently Paying Dividend

    5 Stocks which are Consistently Paying Dividend

    Elgi Equipments – Enjoying Strong Tailwinds

    Elgi Equipments – Enjoying Strong Tailwinds

    J.B. Chemicals & Pharmaceuticals – One of India’s fastest-growing pharmaceutical companies

    J.B. Chemicals & Pharmaceuticals – One of India’s fastest-growing pharmaceutical companies

    Blue Dart Express – A market leader in Air Express Industry

    Blue Dart Express – A market leader in Air Express Industry

    Hindustan Foods – A market leader in FMCG contract manufacturing

    Hindustan Foods – A market leader in FMCG contract manufacturing

    Sharda Cropchem – Ending the year with a strong performance in Q4FY22

    Sharda Cropchem – Ending the year with a strong performance in Q4FY22

    ABB India – An outstanding overall performance

    ABB India – An outstanding overall performance

    Apcotex Industries Ltd. – Strongly Outperforming

    Apcotex Industries Ltd. – Strongly Outperforming

  • Technical Analysis
    Derivative Analytics

    Derivative Analytics – An Insightful Research Tool

    Put-Call Ratio – A Powerful Derivatives Indicator

    Put-Call Ratio – A Powerful Derivatives Indicator

    Beta & Beta Scans – A Powerful Technical Indicator

    Beta & Beta Scans – A Powerful Technical Indicator

    Technical Analysis using Edge Charts

    Technical Analysis using Edge Charts

    Adaptive Relative Strength & Static Relative Strength Scans

    Adaptive Relative Strength & Static Relative Strength Scans

    SuperTrend Indicator : Sell or Buy Signals

    SuperTrend Indicator : Sell or Buy Signals

    2 year and 5 year Price Breakout Scans

    2 year and 5 year Price Breakout Scans

    What is Narrow Range Scans (NR)

    What is Narrow Range Scans (NR)

    Relative Strength (RS)

    Relative Strength (RS)

  • Fundamental Analysis
    • All
    • Cash Flow Ratios
    • Efficiency ratios
    • Growth Ratios
    • Liquidity Ratios
    • Return Ratios
    • Solvency ratios
    • Valuation Ratios
    Understanding the Importance of creating Fundamental Scans

    Understanding the Importance of creating Fundamental Scans

    Using My Combination Scan to Identify best in an Industry

    Using My Combination Scan to Identify best in an Industry

    Cost Income ratio

    Cost to Income Ratio(%)

    Cost of Liability

    Cost of Liabilities (%)

    Operating Cost to Assets Ratio (%)

    Operating Cost to Assets Ratio (%)

    Promoter pledge

    Promoter Pledge: Know Everything about it

  • StockEdge Tutorials
    StockEdge Version 8.1 – It keeps getting Better & Better

    StockEdge Version 8.1 – It keeps getting Better & Better

    StockEdge Version Update 8.0 – Like never before

    StockEdge Version Update 8.0 – Like never before

    Derivative Analytics

    Derivative Analytics – An Insightful Research Tool

    Market Breadth – A Bird’s Eye View of the Market at 1 place

    Market Breadth – A Bird’s Eye View of the Market at 1 place

    StockEdge Version 7.6 released – Enhancing your investment journey further!

    StockEdge Version 7.6 released – Enhancing your investment journey further!

    Using Investor Portfolios Section to track Big Bulls like Rakesh Jhunjhunwala

    Using Investor Portfolios Section to track Big Bulls like Rakesh Jhunjhunwala

    Beta & Beta Scans – A Powerful Technical Indicator

    Beta & Beta Scans – A Powerful Technical Indicator

    StockEdge Version Update 7.4 – Enhancing your Investment Journey

    StockEdge Version Update 7.4 – Enhancing your Investment Journey

    StockEdge 7.3 Release

    StockEdge 7.3 Release

  • Mutual Fund
    Top 5 Mutual Funds for 2022 where you can start your SIP

    Top 5 Mutual Funds for 2022 where you can start your SIP

    What are Value Funds and its Advantages?

    What are Value Funds and its Advantages?

    A Beginners Guide to Thematic Funds

    A Beginners Guide to Thematic Funds

    Understanding Sector Funds and their Benefits to our Portfolio

    Understanding Sector Funds and their Benefits to our Portfolio

    Are Dividend Yield Funds a good option to invest in?

    Are Dividend Yield Funds a good option to invest in?

    What are Contra Funds and their advantages?

    What are Contra Funds and their advantages?

    Trending Tags

    No Result
    View All Result
    • Trending Stocks
    • Insights
      • All
      • Business Houses
      • Markets themes
      • Stock Insights
      How Page Industries is creating a “branded” opportunity in a fragmented market

      How Page Industries is creating a “branded” opportunity in a fragmented market

      5 Stocks which are Consistently Paying Dividend

      5 Stocks which are Consistently Paying Dividend

      Elgi Equipments – Enjoying Strong Tailwinds

      Elgi Equipments – Enjoying Strong Tailwinds

      J.B. Chemicals & Pharmaceuticals – One of India’s fastest-growing pharmaceutical companies

      J.B. Chemicals & Pharmaceuticals – One of India’s fastest-growing pharmaceutical companies

      Blue Dart Express – A market leader in Air Express Industry

      Blue Dart Express – A market leader in Air Express Industry

      Hindustan Foods – A market leader in FMCG contract manufacturing

      Hindustan Foods – A market leader in FMCG contract manufacturing

      Sharda Cropchem – Ending the year with a strong performance in Q4FY22

      Sharda Cropchem – Ending the year with a strong performance in Q4FY22

      ABB India – An outstanding overall performance

      ABB India – An outstanding overall performance

      Apcotex Industries Ltd. – Strongly Outperforming

      Apcotex Industries Ltd. – Strongly Outperforming

    • Technical Analysis
      Derivative Analytics

      Derivative Analytics – An Insightful Research Tool

      Put-Call Ratio – A Powerful Derivatives Indicator

      Put-Call Ratio – A Powerful Derivatives Indicator

      Beta & Beta Scans – A Powerful Technical Indicator

      Beta & Beta Scans – A Powerful Technical Indicator

      Technical Analysis using Edge Charts

      Technical Analysis using Edge Charts

      Adaptive Relative Strength & Static Relative Strength Scans

      Adaptive Relative Strength & Static Relative Strength Scans

      SuperTrend Indicator : Sell or Buy Signals

      SuperTrend Indicator : Sell or Buy Signals

      2 year and 5 year Price Breakout Scans

      2 year and 5 year Price Breakout Scans

      What is Narrow Range Scans (NR)

      What is Narrow Range Scans (NR)

      Relative Strength (RS)

      Relative Strength (RS)

    • Fundamental Analysis
      • All
      • Cash Flow Ratios
      • Efficiency ratios
      • Growth Ratios
      • Liquidity Ratios
      • Return Ratios
      • Solvency ratios
      • Valuation Ratios
      Understanding the Importance of creating Fundamental Scans

      Understanding the Importance of creating Fundamental Scans

      Using My Combination Scan to Identify best in an Industry

      Using My Combination Scan to Identify best in an Industry

      Cost Income ratio

      Cost to Income Ratio(%)

      Cost of Liability

      Cost of Liabilities (%)

      Operating Cost to Assets Ratio (%)

      Operating Cost to Assets Ratio (%)

      Promoter pledge

      Promoter Pledge: Know Everything about it

    • StockEdge Tutorials
      StockEdge Version 8.1 – It keeps getting Better & Better

      StockEdge Version 8.1 – It keeps getting Better & Better

      StockEdge Version Update 8.0 – Like never before

      StockEdge Version Update 8.0 – Like never before

      Derivative Analytics

      Derivative Analytics – An Insightful Research Tool

      Market Breadth – A Bird’s Eye View of the Market at 1 place

      Market Breadth – A Bird’s Eye View of the Market at 1 place

      StockEdge Version 7.6 released – Enhancing your investment journey further!

      StockEdge Version 7.6 released – Enhancing your investment journey further!

      Using Investor Portfolios Section to track Big Bulls like Rakesh Jhunjhunwala

      Using Investor Portfolios Section to track Big Bulls like Rakesh Jhunjhunwala

      Beta & Beta Scans – A Powerful Technical Indicator

      Beta & Beta Scans – A Powerful Technical Indicator

      StockEdge Version Update 7.4 – Enhancing your Investment Journey

      StockEdge Version Update 7.4 – Enhancing your Investment Journey

      StockEdge 7.3 Release

      StockEdge 7.3 Release

    • Mutual Fund
      Top 5 Mutual Funds for 2022 where you can start your SIP

      Top 5 Mutual Funds for 2022 where you can start your SIP

      What are Value Funds and its Advantages?

      What are Value Funds and its Advantages?

      A Beginners Guide to Thematic Funds

      A Beginners Guide to Thematic Funds

      Understanding Sector Funds and their Benefits to our Portfolio

      Understanding Sector Funds and their Benefits to our Portfolio

      Are Dividend Yield Funds a good option to invest in?

      Are Dividend Yield Funds a good option to invest in?

      What are Contra Funds and their advantages?

      What are Contra Funds and their advantages?

      Trending Tags

      No Result
      View All Result
      StockEdge Blog
      Home Tutorials Fundamental Tutorials Efficiency ratios
      Operating Cost to Assets Ratio (%)

      Operating Cost to Assets Ratio (%)

      StockEdge by StockEdge
      July 15, 2019
      Reading Time: 3 mins read
      8.8k
      VIEWS
      Share on FacebookShare on TwitterShare On WhatsApp

      Table of Contents

      • What is Cost to Assets Ratio(%)
      • Importance
      • Impact
      • Ebitda Margin Formula
      • Explanation
      • Stockedge App
      • Bottomline

      Ever wondered what happens to the operating cost of a bank when banks start giving out more loans i.e. when they keep on building their asset books. How much of the operating cost is appropriate for the bank? Is the bank spending too much to build assets? Well for this you need to understand banks operating cost to asset ratio!!! Read On!!

      What is Cost to Assets Ratio(%)

      Cost to Assets Ratio (%) is an efficiency ratio that measures the operating expenses, i.e., non-interest expenses, of a bank in relation to its size or the asset base.

      The ratio is not impacted by changes in the interest rate and so provides a better picture of the bank’s efficiency, in terms of how it is managing its expenses as compared to its assets.

      Thus, the ratio helps in measuring the efficiency of a bank or financial institution at times when there is a significant change in interest rates or spreads.

      You can also watch the below video on Everything you want to know about Operating Cost to Assets Ratio:

      Importance

      The ratio has a cost as its numerator and to achieve operational efficiency, it is important for an entity to contain its costs. Thus, lower the ratio better it is for the banks as it indicates better efficiency.

      Download StockEdge App Download StockEdge App Download StockEdge App

      Moreover, a lower ratio also means that the asset base of the bank is sufficient to cover its operational costs. A higher level of asset is desirable, but not higher operational costs.

      Thus, a bank which is achieving lower operating costs to assets ratio on a consistent basis is better in terms of operating efficiency.

      Impact

      Cost to Assets ratio indicates more of a bank’s business mix rather than a basis for detailed cost analysis.

      This can be well understood from the fact that a bank with a higher corporate lending will have a lower cost to asset ratio as compared to a bank having higher retail lending. This is due to the fact that though retail lending adds to the bank’s asset size it is comparatively less in size than the additions made by the corporate lending.

      It is to be noted, that banks in different countries have different cost structures. Thus, the ratio may fail to make cross border comparison of banks.

      Ebitda Margin Formula

      Operating cost / Asset ratio = (Operating Expenses/Average Assets)* 100

      Explanation

      Here, we take the example of HDFC Bank Limited. The bank’s operating expenses for the current year is Rs 27,69,476 lakh which is available from its Profit & Loss Statement

      Next, is the bank’s total asset, which is Rs 12,92,80,571 lakh as reported in its Balance Sheet.

      Thus, Operating Cost to Asset Ratio (%) = (27,69,476/129280571)*100 = 2.14%

      So, HDFC Bank’s operating cost is 2.14% of its total asset.
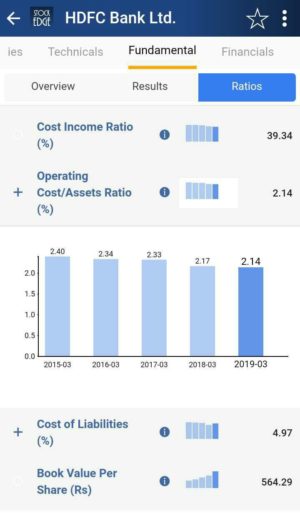
       Cost to Assets Ratio of HDFC Bank

      See also: Cost to Income ratio(%)

      HDFC Bank’s operating cost to asset ratio is consistently declining, indicating its operational efficiency in managing costs against increased assets.

      Stockedge App

      Nowadays we don’t have to calculate operating cost to Asset ratio (%) on our own. StockEdge gives us the operating cost to asset ratio of the last five years of any company listed in the stock exchange. We can look and compare operating cost to asset ratio (%) of any company and filter out stocks accordingly.

      Suppose we want to look at operating cost to asset ratio (%) of HDFC Bank Ltd. for last 5 years then in the Fundamental tab of HDFC Bank Ltd., click on the fundamentals tab, we will get Ratios tab. Then in the Ratios tab click on the Efficiency Ratios, we will get operating cost to asset ratio(%) of HDFC Bank Ltd.

      Bottomline

      Operating cost to asset ratio is an important efficiency ratio for the fact that we are able to track the changes in operating cost with respect to changes in asset and also an indicator of the bank’s business mix. It can be compared in time basis and with other companies to understand the efficiency of the banks.

      With a click of a button, you can see the comparison of a company’s operating cost to asset ratio for five years. Haven’t subscribed to Stockedge yet? So what are you waiting for, subscribe immediately to use this free feature.

      We also have paid featured scans based on Valuations, with the help of these ready-made scans you can with a click of a button filter out good companies. These scans are part of the premium offerings of StockEdge app.

      Click here to know more StockEdge Plan.

      Tags: Efficiency Ratiosfinancial analysisFinancial ratiosfinancial strengthfundamental conceptsfundamental parameterfundamental ratioFundamental Stocksstock financialsStockEdgeStockedge appStockedge feature
      ShareTweetSend
      Subscribe On Telegram Subscribe On Telegram Subscribe On Telegram
      Previous Post

      Promoter Pledge: Know Everything about it

      Next Post

      Cost of Liabilities (%)

      StockEdge

      StockEdge

      StockEdge is a self-help Equity and Mutual Fund research tool. It empowers retail investors to identify investment opportunity with all the necessary data and analytics.

      Related Posts

      StockEdge Version 8.1 – It keeps getting Better & Better
      StockEdge Tutorials

      StockEdge Version 8.1 – It keeps getting Better & Better

      June 13, 2022
      1.8k
      StockEdge Version Update 8.0 – Like never before
      StockEdge Tutorials

      StockEdge Version Update 8.0 – Like never before

      April 28, 2022
      7.4k
      Derivative Analytics
      StockEdge Tutorials

      Derivative Analytics – An Insightful Research Tool

      April 28, 2022
      2.9k
      Next Post
      Cost of Liability

      Cost of Liabilities (%)

      Cost Income ratio

      Cost to Income Ratio(%)

      What’s new in version 4.4

      What's new in version 4.4

      Leave a Reply Cancel reply

      Your email address will not be published. Required fields are marked *

      Contact Us

      • Timing (Mon-Sat): 10 am to 7 pm
      • Sales: +919830994463
      • Support: +919830994402
      • Club Support: +916289906895
      • Affiliate: +917003567131

      Recent Posts

      How Page Industries is creating a “branded” opportunity in a fragmented market

      June 26, 2022

      5 Stocks which are Consistently Paying Dividend

      June 19, 2022

      Important Links

      • StockEdge.com
      • StockEdge Premium
      • - Quarterly Membership
      • - Annual Membership
      • StockEdge Analyst
      • StockEdge Club
      • Compare Plans

      An Initiative Of

      © 2021 Kredent InfoEdge Pvt Ltd.

      Facebook-f Twitter Instagram Linkedin-in Youtube Pinterest-p

      Get StockEdge App

      No Result
      View All Result
      • Home
      • Article Categories
        • Fundamental Analysis
        • Technical Analysis
        • Market Themes
        • StockEdge Tutorials
        • StockEdge Version Updates
      • StockEdge Premium
        • Quarterly Membership
        • Annual Membership
        • StockEdge Analyst
        • StockEdge Club
        • Compare Plans
      • Visit StockEdge.com

      © 2021 Kredent InfoEdge Pvt Ltd.