Table of Contents
Net profit growth – The net profit of the company is the profit that the company generates after accounting for all its expenses.
Some parameters to look at when it comes to studying the fundamentals of a company is financial ratios. A financial ratio is a tool which measure the financial valuation of a company’s financial statements. It helps in deciding the investing rationale of a company. There are a lot of ratios embedded in financial models thus we will discuss about Impact of Net Profit Growth ratios.
Impact of Net Profit Growth
It is a true reflection of the way the company has used its resources. Thus consistent growth in Net profit implies the financial strength of the Company. A growth in net profit enhances the dividend-paying capacity of a company and the company can use the profits to diversify its operations and expand the business.
Exceptions
However historical data may not always be a foolproof way towards future perception as the industrial and economic conditions may wary every year especially for the cyclical stocks.
Net Profit Growth Formula
Net profit growth (%) = (current period NP-Prior Period NP)/Prior Period NP
For Example:
If a company made a net profit of 10 crores in year 1 and 13 crores in year 2, the net profit growth % is (13-10)/10= 30%
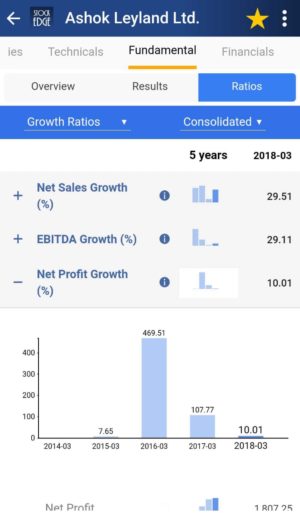
Nowadays we don’t have to calculate Net Profit growth (%) on our own. StockEdge gives us Net Profit growth (%) of the last five years of any company listed in the stock exchange. We can look and compare Net Profit growth (%) of any company and filter out stocks accordingly.
See also: Net Sales Growth (%)
Suppose we want to look at the Net Profit growth (%) of Ashok Leyland of the last 5 years. In the Fundamental tab of Ashok Leyland, click on the fundamentals tab, we will get Ratios tab. Then in the Ratios tab click on Growth Ratios, N/P growth (%) will come of Ashok Leyland in a flicker of a second making our work simpler.

Bottomline
N/P growth percentage is an important tool to measure the growth and future prospects of a company. This data is easily available under ratios section of each share freely. We also have scans based on Net profit, with the help of these ready-made scans you can with the click of a button filter out good companies. These scans are part of the premium offerings of StockEdge app.
Join StockEdge Club to get more such Stock Insights. Click to know more!
You can check out the desktop version of StockEdge.


Thanks for a great explanation!