Table of Contents
Welcome to our blog about electric vehicle(EV) stocks. In recent years, the electric vehicle sector has been one of the hottest subjects, with the industry seeing exponential development and innovation.
As Electric Vehicles gain popularity, investors seek ways to profit from this emerging market by investing in EV stocks. This blog will look at the EV sector through the lens of the stock market, discussing key players, market trends, and investment strategies in EV stocks. In addition, we will offer insights and analysis on the performance of the Electric Vehicle(EV) stocks mentioned below, including established automakers, emerging startups, and related businesses like battery manufacturers and charging infrastructure suppliers.
India has also accelerated its shift to electric automobiles to create a more sustainable ecology, like the renewable energy stocks sector. In addition, the government has established aims to combat climate change, including achieving net zero emissions by 2070 and reducing 1 billion tons of expected emissions by 2030. The transport industry accounts for around 13% of total CO emissions in India, with road transport accounting for 90% of total energy consumption, followed by rail and domestic aviation.
Rising worldwide gasoline prices have aided EV adoption. While EVs have a higher initial cost, they provide various advantages over ICE cars, including lower operating and maintenance expenses and improved motor efficiency compared to an ICE (Internal Combustion Engines). In addition, technological developments in the electric vehicle (EV) sector have decreased production costs, enticing more manufacturers to enter the industry and enhancing Electric Vehicle(EV) adoption internationally.
List of best EV Stocks in India
Below mentioned are some of the best electric vehicle(EV) stocks in India
| Sl. No. | EV Stocks |
| 1 | Olectra Greentech Ltd |
| 2 | Mahindra & Mahindra Ltd |
| 3 | Sona BLW Precision Forgings Ltd |
| 4 | Exide Industries Ltd |
| 5 | Kabra Extrusion Technik Ltd |
Criteria for selecting Electric Vehicle(EV) stocks
Here is an overview to consider EV stocks to buy –
Financial performance
- Costs for Research and Development (R&D): Electric vehicle technology is fast improving, and businesses that engage extensively in R&D can acquire a competitive edge in the market. Investors should seek EV stocks that are substantially investing in research and development since this might suggest a commitment to innovation and long-term growth.
- Cash Reserves: Cash reserves are vital for every business, including EV enterprises. Investors should search for electric vehicle(EV) Stocks with substantial cash reserves, which may help them weather any unforeseen financial issues and invest in future development prospects.
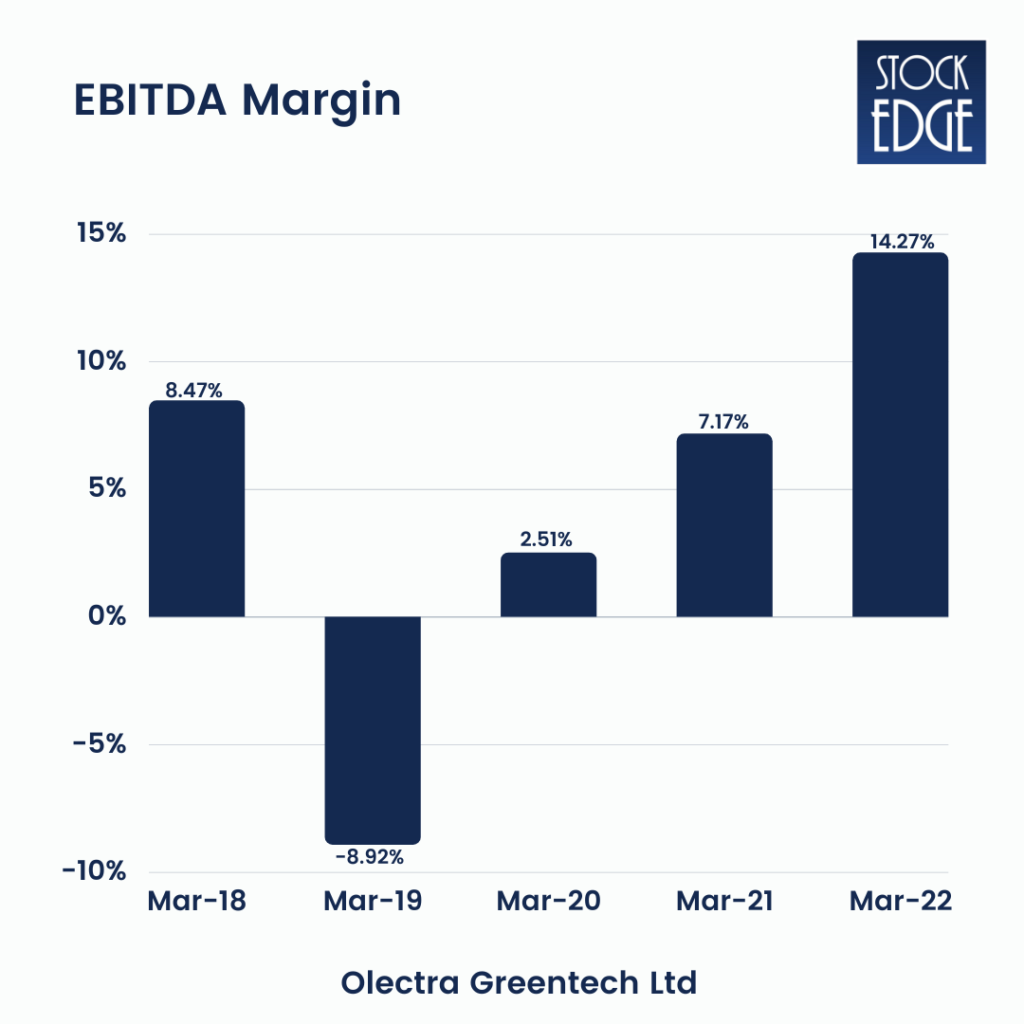
- Profit Margins: Profit margins are a significant financial indicator that assesses a company’s capacity to create profits. Investors should seek EV stocks with good profit margins since they may help the company maintain itself and fund future expansion.
- Debt Levels: Investors should be aware of the company’s debt levels. High levels of debt can expose the company to economic downturns and interest rate hikes, limiting the ability to invest in future growth in EV stocks.
- Revenue Growth: Investors should seek EV stocks that have shown steady sales growth in recent years. The revenue growth rate can indicate the company’s ability to increase EV product sales, which is critical for long-term profitability.
Growth Potential
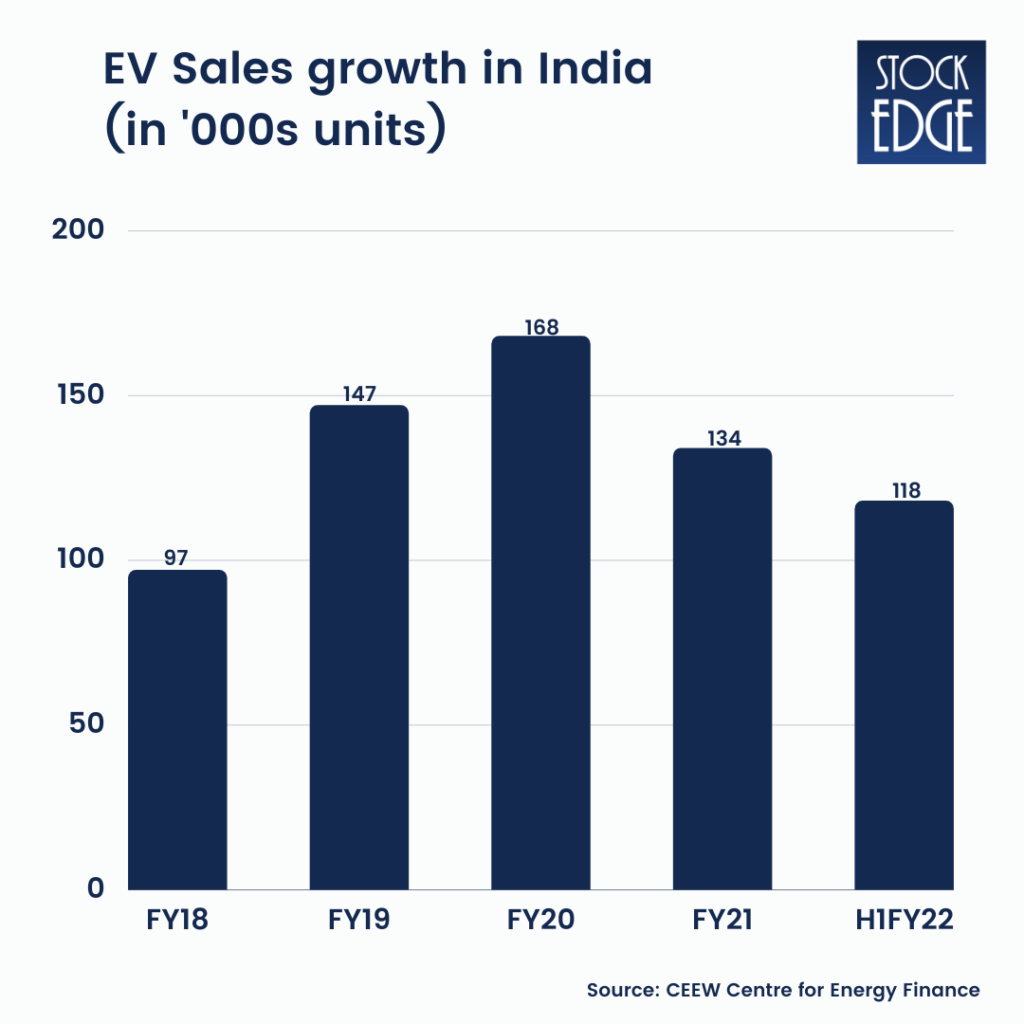
- The growth potential for Electric vehicle(EV) stocks in India is significant, thanks to favorable government policies, rising consumer demand for environmentally friendly transportation, and increased investment in the sector.
- The Indian government had set a target of 30% electric vehicle penetration by 2030, representing a massive opportunity for Indian EV stocks. In addition, the government has taken several initiatives to encourage Electric vehicle(EV) adoption, including providing incentives and subsidies for EV purchases, lowering EV taxes, and establishing charging infrastructure nationwide.
- Furthermore, expanding public knowledge of the benefits of EVs and growing worries about air pollution have resulted in a boom in demand for Electric Vehicle(EV) in India. Indian consumers are increasingly choosing EVs, which are environmentally friendly and offer significant long-term cost savings.
- Falling battery prices, favorable government regulations, and increased investment in the EV sector will all contribute to the expansion.
Overview: List of best EV Stocks in India
Olectra Greentech Ltd
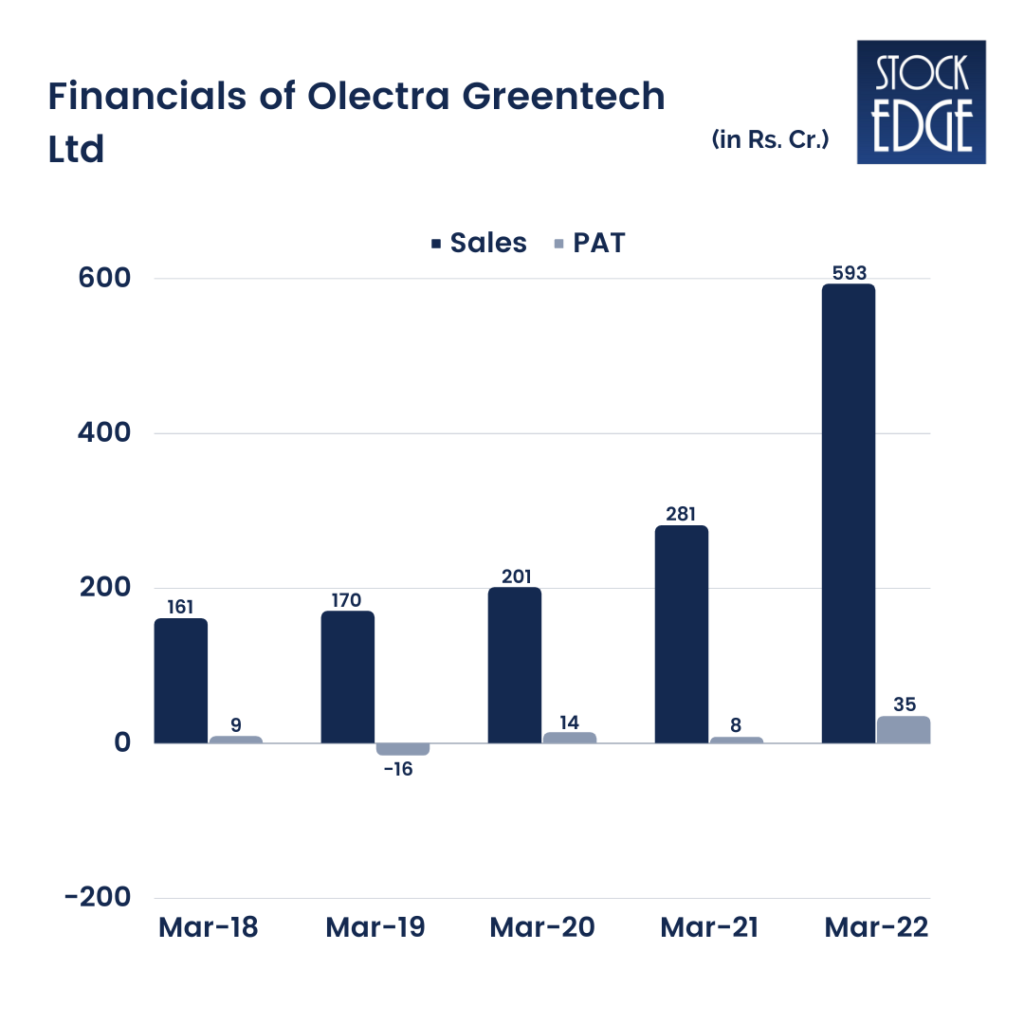
Olectra Greentech Ltd is one of the EV stocks in India which is trading in the market. It is India’s largest Pure Electric Bus manufacturer, with production facilities in Hyderabad. Olectra is India’s first electric bus manufacturer, having built and deployed all varieties of electric buses in the country. After its success in the commercial run of electric buses, the business is expanding its product range in the e-mobility category to include 3-wheeler electric vehicles and electric trucks.
Financials
- To begin, standalone revenue from operations increased by roughly 20% in quarter 3 to INR 248.6 crores, up from INR 207.1 crores in the previous year’s equivalent period.
- The standalone PAT increased by 4% to INR 13 crores from INR 12.5 crores in the same quarter the previous year. These figures are principally driven by the success of the electric category, where volumes have increased by 38% from 103 electric buses delivered last year to 142 buses provided this year.
- On a standalone basis, the company recorded a 141% increase in sales, a 92% rise in EBITDA, and 135% growth in PAT for the nine months ending December 2022 compared to the similar nine months the previous year.
- The nine-month P&L highlights: The standalone revenue from operations concluded at INR 766 crores vs. INR 317.3 crores, a 141% rise over the previous year, principally led by the electric bus sector, which increased by 174%, and followed by the insulator segment, which increased by 16%.
- Over the past nine months, Insulators’ operating margins have improved significantly due to design optimization and increased export sales, which have led to greater profits.
- In terms of EBITDA, they experienced considerable growth over the previous nine months, delivering EBITDA of over INR 100 crores vs. INR 52 crores last year, a 92% increase, and a substantial 13% margin.
- The net profit for the period was INR 42.9 crores vs. INR 18.2 crores, representing a considerable increase of INR 28.1 crores in percentage terms, 135%, primarily due to the electrical bus sector. The tax rate for the first nine months was 24%, down from 36% the previous year.
- The net profit for the period was INR 42.9 crores vs. INR 18.2 crores, representing a considerable increase of INR 28.1 crores in terms of percentage, 135%, driven mainly by the electrical bus sector. In terms of taxes, the tax rate for the nine months was 24%, down from 36% the previous year. On a consolidated basis, The revenue from operations increased by about 23% to INR 256.4 crores, up from INR 282 crores in the last year’s corresponding quarter.
- The consolidated PAT for the quarter increased by 21% to INR 15.3 crores, compared to INR 12.6 crores in the same previous year. On a consolidated basis, in the nine months ended December 2022, they delivered 122% revenue growth and 124% PAT growth compared to the corresponding nine-month period last year.
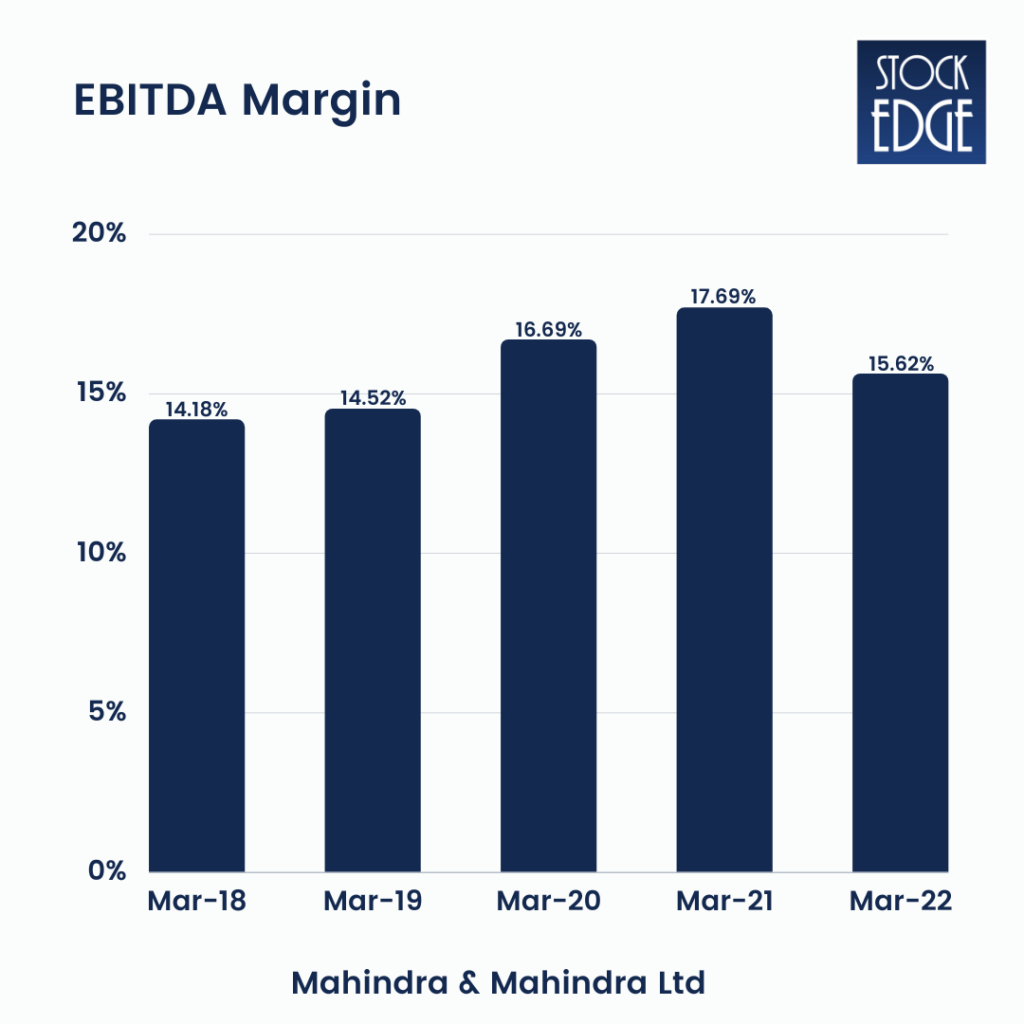
Mahindra & Mahindra Ltd
M&M, Very well known EV stock, founded in 1945, is one of the world’s largest tractor manufacturers and a significant maker of goods LCVs in India. Its primary activities include the production of Passenger Vehicles (PVs), Utility Vehicles (UVs), passenger cars, Commercial Vehicles, Light Commercial Vehicles (LCV), pick-up trucks, Medium & Heavy Commercial Vehicles (MHCV), Farm Equipment (tractors and other agricultural equipment), and so on. M&M holds a commanding advantage in its key business categories. It is India’s largest tractor business, having a 40% market share in the tractor industry in FY22. Manufacturing facilities are in Mumbai, Nashik, Lgatpuri, Nagpur, and Chakan in Maharashtra; Zaheerabad in Telangana; Rudrapur and Haridwar in Uttarakhand; and Jaipur in Rajasthan.
The Mahindra group engages in various industries through its subsidiaries and group businesses, including information technology, financial services, and vacation ownership. It also has a presence in agriculture, aircraft, components, consulting services, defense, energy, industrial equipment, logistics, real estate, retail, steel, commercial vehicles, and two-wheelers.
Financials
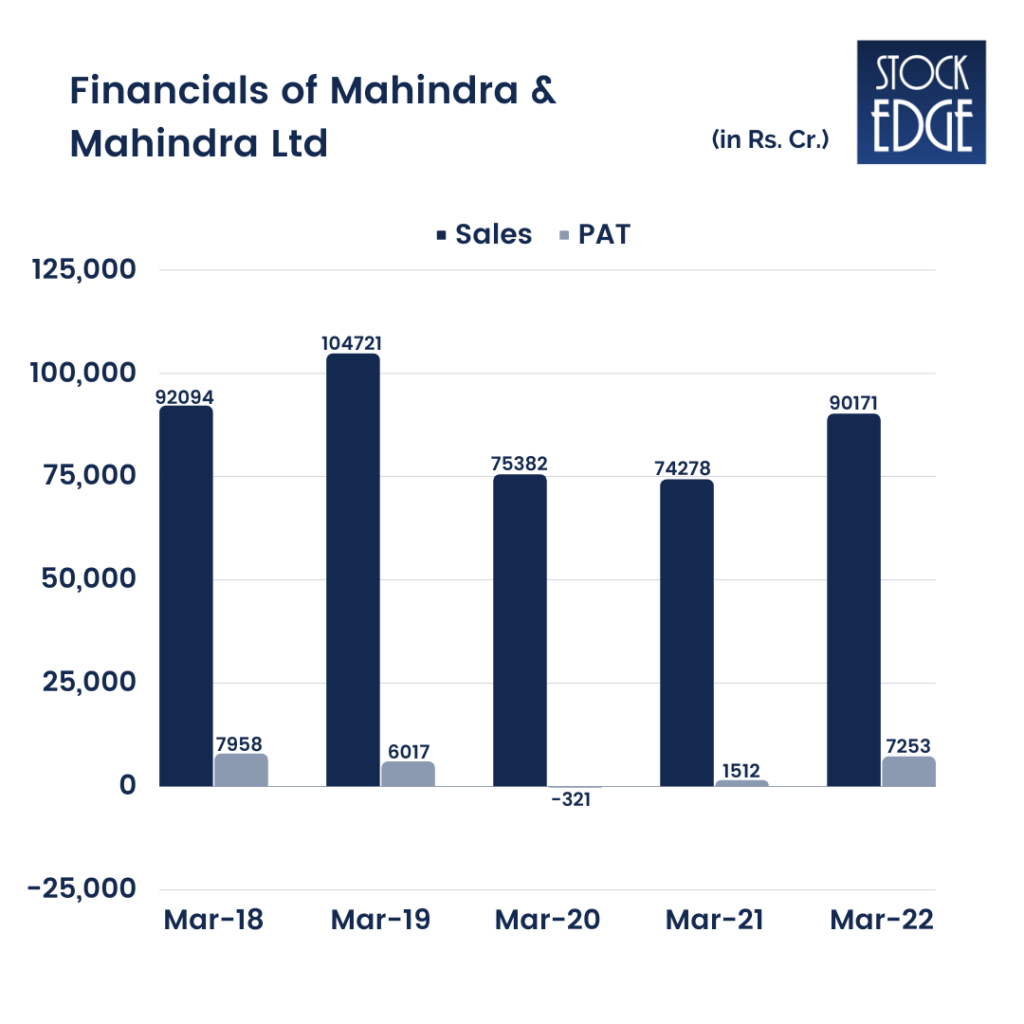
- M&M’s automotive revenue was constant QoQ at 14,797 crores, despite a 2% QoQ reduction in volumes at 1.76 lakh units and a 2.5% increase in ASP to 8.4 lakh/unit. Tractor revenues increased 13.4% year on year to 6,277.7 crores, with volume increasing 13.1% year on year to 1.06 lakh units and ASPs remaining unchanged at 5.9 lahks per unit.
- The standalone EBITDA was Rs. 2,814 crores, with EBITDA margins of 13%. (up 102 QoQ). Gross margin increased by 56 basis points year on year. For Q3FY23, the automobile segment increased EBIT margins by 65 basis points year on year to 6.7%, while the tractor segment increased EBIT margins by 15 basis points year on year to 16.6%.
- PAT for the quarter was 1,528 crore, a 27% decrease year on year. The PAT deficit was caused by an unusual item (~629 crores) pertaining to an impairment provision for a specific long-term investment and the impairment of certain assets in the trucks and buses sector.
- Throughout the quarter, the firm achieved its highest-ever quarterly revenue and PBIT, with agricultural equipment PBIT improving sequentially on market share gains and solid volumes.
- The company’s domestic tractor market share remained stable at 41%, up 1.6% year on year. This was primarily due to the successful launch of Yuvo Tech+, the inclusion of new dealers (~120 new dealers), and excellent brand awareness in the 30-50 HP class.
- Outperformance was led principally by the agriculture industry, which saw healthy demand amid good farm sentiments. Furthermore, management anticipates the industry to increase by 10% or more, compared to the previous projection of low single digits. In addition, the administration stated that four years of strong monsoons, more government investment in H2FY23, and other factors would contribute to healthy demand, with FY24E forecast to be provided after IMD monsoon data.
- M&M remains the market leader in the SUV segment, with a revenue market share of 20.6% in Q3FY23, up from 19% in Q2FY23. It also maintains a 63.5% market share in the electric 3-W area.
- The company reported a 2.66 lakh unit pending order book, with a sustained focus on reducing it and reporting a lower order book in the next quarter as production ramps up. According to management, the present order book has been canceled in the 5-7% range due to delivery delays.
Sona BLW Precision Forgings Ltd
Sona BLW Precision Forgings is an automobile technology company established in India. Across all vehicle categories, the business designs, manufacture, and supplies engineered automotive systems and components such as differential assemblies, gears, conventional and micro-hybrid motors, BSG systems, and EV Traction motors. In addition, the company makes mechanical and electrical hardware systems, components, and base and application software.
The company’s product range may be divided into two categories: 1) Driveline components – differential assembly and gears; and 2) Motors. Driveline components segment: The company makes differential assemblies and precision-forged differential bevel gears for electrified and non-electrified PVs, CVs, OHVs, and 3Ws. Motors segment: The company provides conventional and micro-hybrid starting motors for PVs and LCVs, EV traction motors, and motor control units for hybrid and e-PVs, hybrid and e-LCVs, e-2Ws, and e3Ws. As the demand for electric vehicles continues to rise, companies like Sona BLW Precision Forgings are poised to benefit from the growth as Electric vehicle(EV) stocks.
Some of the company’s clients are Ashok Leyland Daimler, M&M, Escorts Mahinda Electric, Renault Nissan, Maruti Suzuki, Volvo, Volvo Eicher, and others.
Financials
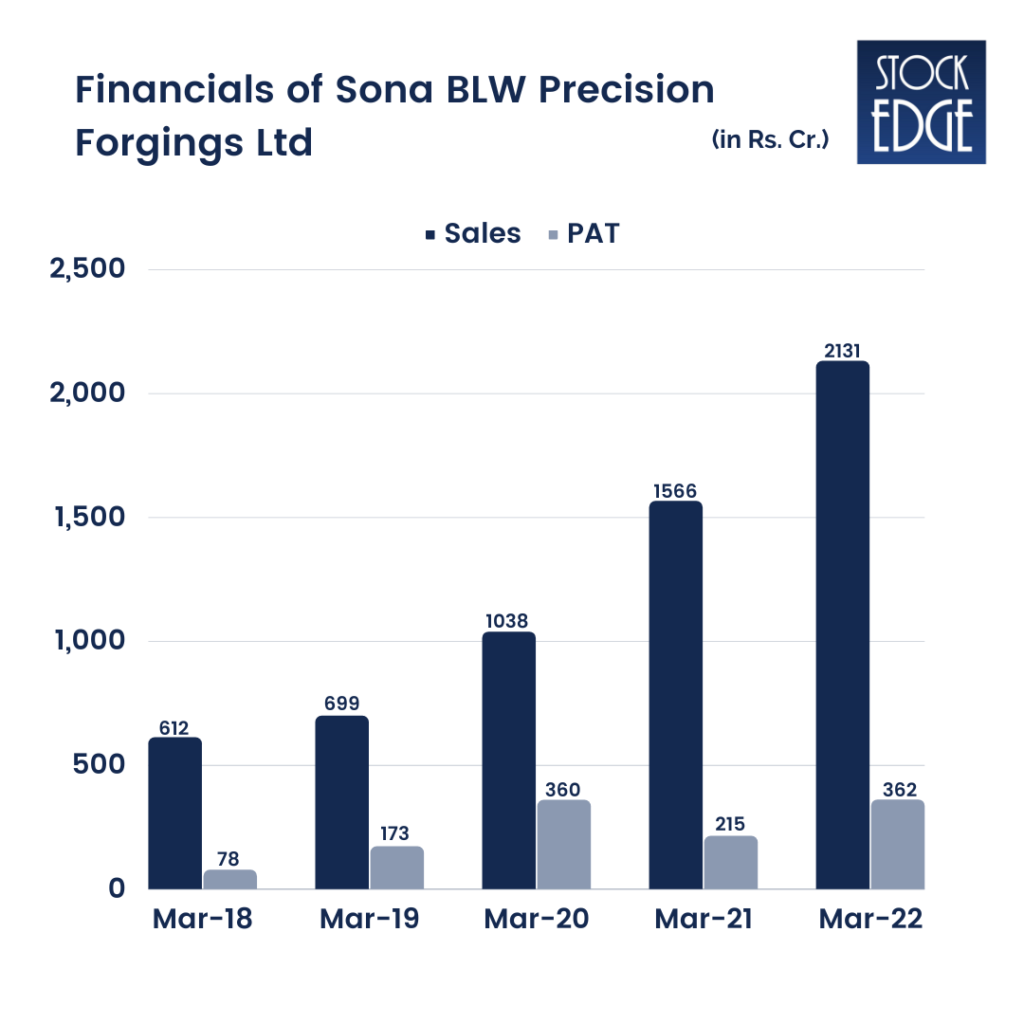
- In 3QFY23, the company’s sales increased by 39% to 6.9 billion, EBITDA by 43% to 1.9 billion, and PAT by 24% to 1.1 billion. Revenue increased by 22% in 9mFY23, EBITDA increased by 17%, and Adj Pat increased by 11% year on year.
- Revenue for the 3Q of fiscal year 23 was consistent, mainly due to new initiatives expansion. In 3QFY23, BEV revenue increased 39% year on year to INR1.7 billion (26% of total revenue).
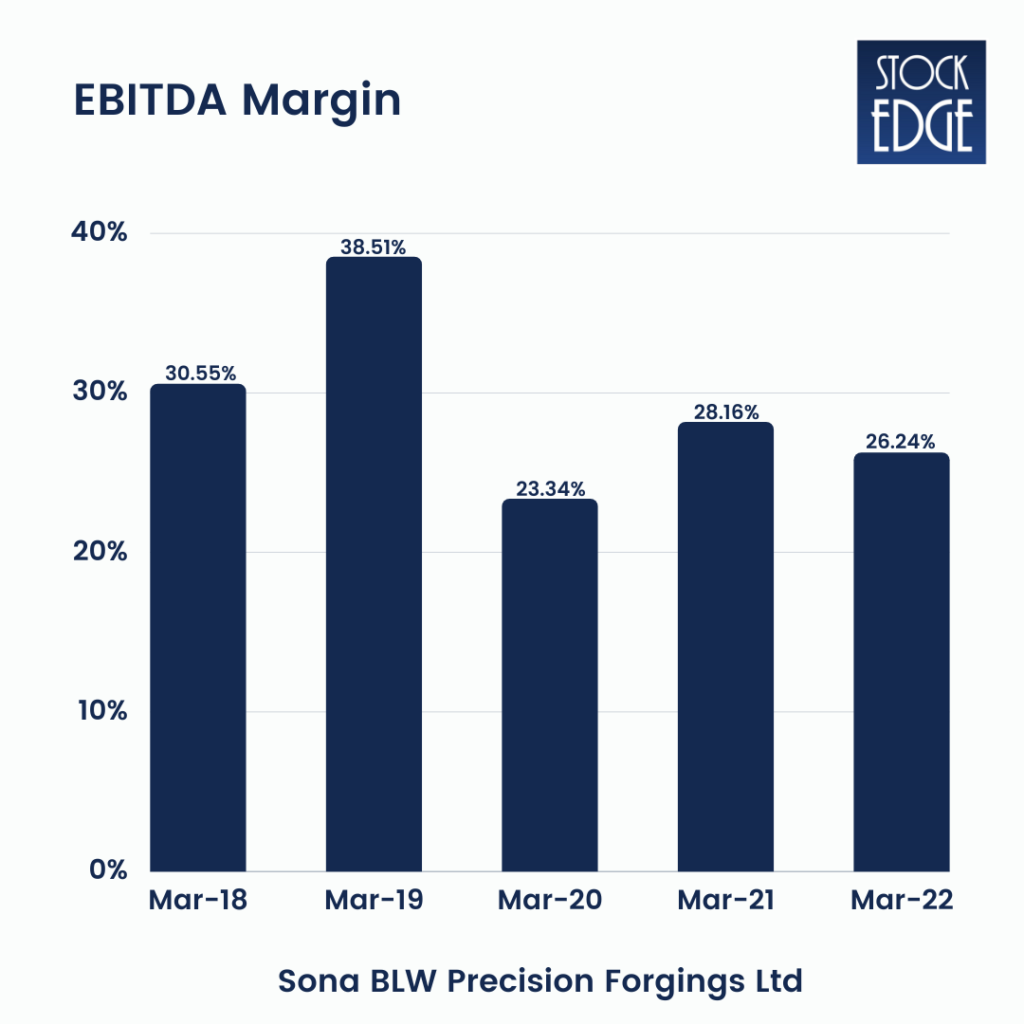
- Gross margin increased 280bp QoQ (-170bp YoY) to 55.8% (est 53.9%), aided by mix and RM cost reductions. As a result, the EBITDA margin increased by 200bp QoQ (+80bp YoY) to 27.2% (previously 26.3%). As a result, EBITDA increased 43% yearly at INR1.9 billion (est INR1.7b).
- Adj. PAT increased 24% yearly to INR1.1b (est INR0.96b). The Directors had declared an interim dividend of INR1.28 per equity share.
- SONACOMS has awarded an INR33.5 b contract to deliver EDL to a multinational OEM for their forthcoming e-SUV. The company is the exclusive provider, and supply will begin in 2HFY24, with a peak revenue in CY26. EDL is a sophisticated product, compared to other assemblies, used in large SUVs and pick-up vehicles. Electronically locking differential is at the top of the value spectrum. EDL has 15-17 components compared to 6-7 in other assemblies.
- GKN and Dana are vital stakeholders in the ICE EDL. A US-EU OEM also ordered the business to supply diff assemblies for its future BEV vehicle. This order increased the order book by INR3.6 billion, and the SOP is from 2HFY24. Apart from these two driveline order wins, the business has received fresh orders for motor segments, which it will provide to two distinct domestic OEMs: 1) a new 2W EV player and 2) one of the top 15 domestic 2W EV players.
- As of 3QFY23, the order book was at INR238 billion (up from INR205 billion in 2QFY23), with EVs accounting for 73% of total orders. In 3QFY23, the business received INR42 billion in orders, with USD 9 billion going into serial production.
- The management aims to maintain an EBITDA/PAT margin of 27%/15% for at least the next 4-5 quarters.
- While SONACOMS is qualified for PLI incentives, it will only begin accounting for them after receiving them (in FY24). The business anticipates early incentives of 11% (peak rate of 15%) of incremental sales on its EV component portfolio (26% of revenues in 3Q and 73% of order book).
- SONACOMS provides a clear worldwide bet on the electrification and premiumization megatrends. With a significant rise in content in EV goods, its product line of differential gears, motors, and sensors is on the right side of the Auto industry transformation. It’s also ready for EV-specific components, including traction motors, controllers, and 48V BSG. It also benefits from the structural premiumization tendency that has been witnessed across segments, including PVs (SUVs, 4WDs, BEVs), CVs (MAVs), and tractors (higher HP, 4WDs). In 9MFY23, the BEV segment generated 25% of sales (up from 25%/14% in FY22/FY21) and 73% of the order book.
Exide Industries Ltd
Exide Industries Ltd, founded in 1947, is India’s top battery maker. The Rajan Raheja Group bought Associated Battery Manufacturers (Eastern) Ltd. in 1993 after it began operations as a subsidiary of Chloride Overseas UK. The company was renamed Exide Industries Ltd in 1995.
EIL acquired the battery business of Standard Batteries Limited (SBL), India’s second biggest battery producer at the time, as well as four of its plants and the Standard Furukawa brand, in 1998. EIL has the most excellent storage-battery production capability in India, with geographically diverse manufacturing locations.
With the growing demand for electric vehicles in Indian market, EV stocks are becoming increasingly popular among the investors. Exide Industries Ltd is very well-positioned to benefit from this trend.
Financials
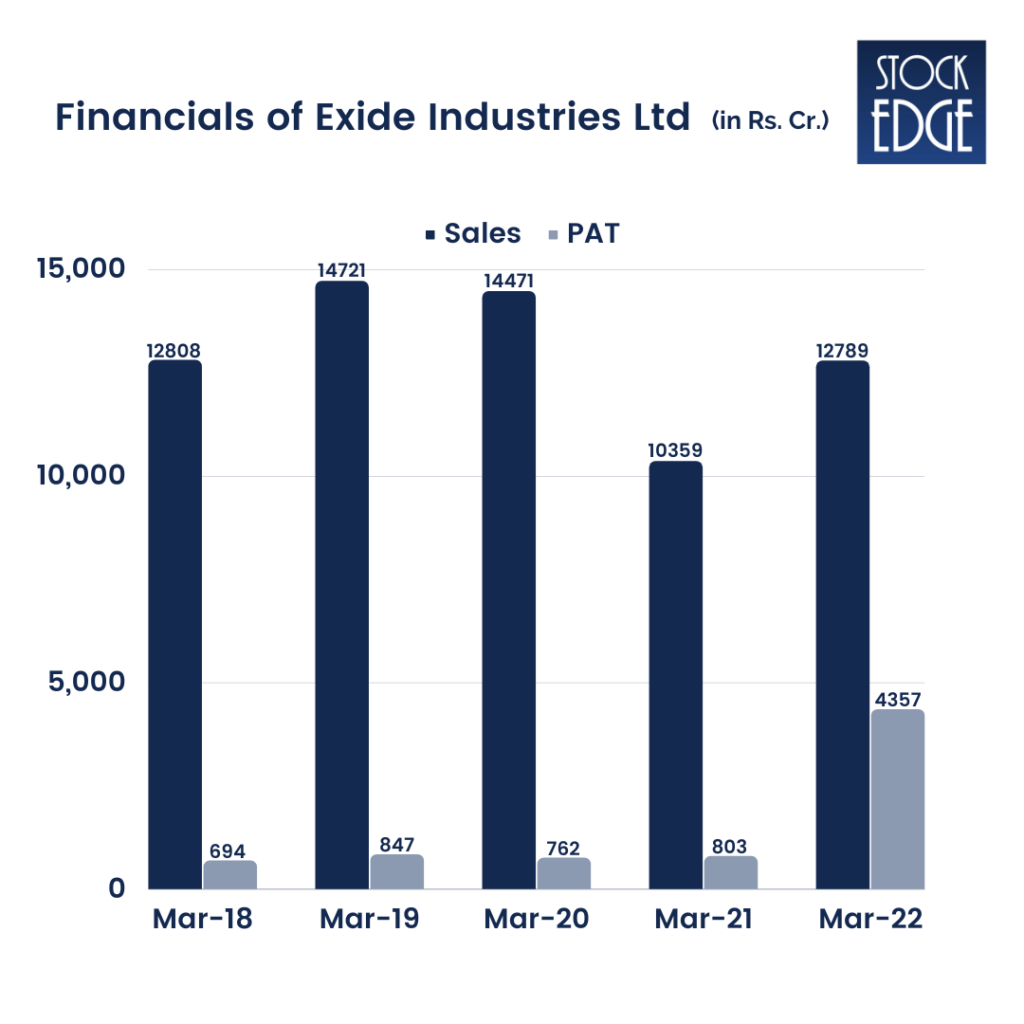
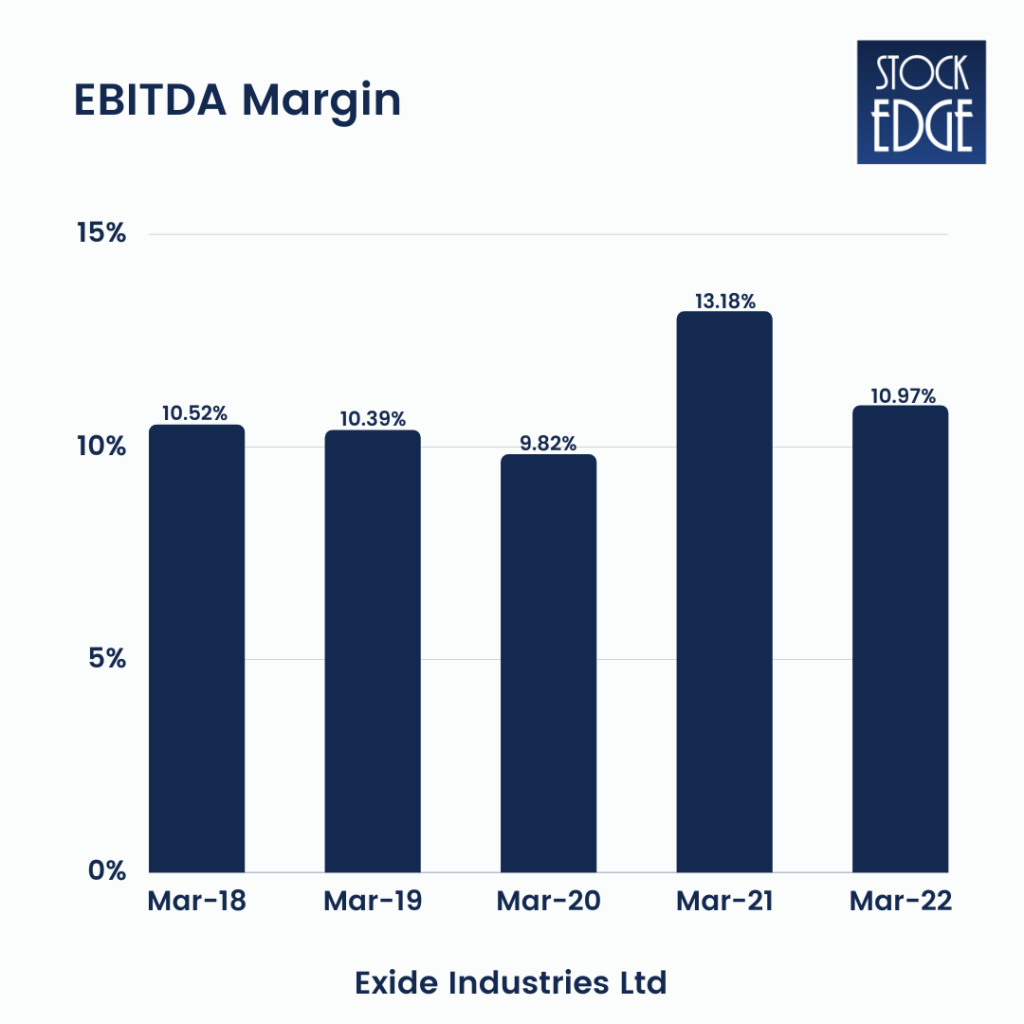
- EIL’s sales increased by 7% year on year in Q3FY23, principally due to significant growth in the Aftermarket, UPS, and Solar segments. It also saw strong growth in the OEM and industrial markets.
- PAT increased by 9% year on year due to price increases in the aftermarket, lead price benefits, and tight cost control measures. But the overall demand environment is improving due to solid rural sentiments.
- The company is planning for Greenfield’s investment in lithium-ion battery cells. The facility is being designed in two stages: Phase I and Phase II. Thus it will have a 6-gigawatt-hour capacity in Phase I and another 6-gigawatt-hour capacity in Phase II.
- The total capital expenditure for this plant is INR 6,000 crores, of which about 4,000 crores will be invested in Phase I and the remainder in Phase II. The project will be utilized to build a multi-gigawatt Li-ion battery cell manufacturing facility for India’s new-age electric mobility and stationary application businesses.
- The business stated that the first phase of Li-ion cell production would be completed by 2HFY25.
- The e-2/3W demand situation will perform well in local and international markets. The government’s FAME-2 incentives and the state’s recent statement on EV rules have resulted in e-2w prices comparable to those of its IC cars.
- The transition to lithium-ion will impact the company’s 25% lead acid business, and the company’s decision to grow an alternative mix bodes well for long-term revenue visibility. Furthermore, the government’s viability financing and a custom duty exemption extension for manufacturing lithium-ion cells for EV batteries are anticipated to boost the company’s progress in the correct path.
- Currently, the battery cost is 75% for imported cells and 25% for battery management systems. Therefore, EIL will immediately benefit from the recent capital expansion and will be first to market in cell manufacture.
Kabra Extrusion Technik Ltd
Kabra Extrusion Technik (KET) is India’s leading extrusion plant manufacturer and exporter. KET is a subsidiary of the famous Kolsite Group, which has over six decades of expertise, 14,463 installations, and a presence in 92 countries across the Americas, the Middle East, Asia, and Africa. KET is the market leader in the extrusion industry. KET is continually striving to provide better solutions to plastics processors worldwide. Kabra Extrusion Technik has established industry benchmarks in the plastics extrusion business with sophisticated R&D techniques and various technologies to meet market demands.
Battrixx is the future technologies division of KET. It is committed to creating and manufacturing green energy systems and solutions to fuel India’s transition to green energy storage and electric transportation. Battrixx has formed a technology partnership with a well-known European player, gaining access to a patented design and production method. At Chakan, Pune, the brand stands tall with cutting-edge design, research, and production capabilities. Let’s look at the financials to understand the whether to consider Kabra Extrusion Technik (KET) in your EV stocks list.
Financials
- On a consolidated basis, Net Sales were Rs 206.85 crore in December 2022, up 96.33% from Rs 105.36 crore in December 2021. Quarterly Net Profit in December 2022 was Rs. 11.47 crore, up 30.84% from Rs. 8.76 crores in December 2021. In December 2022, EBITDA was expected to be Rs. 23.13 crore, up 40.1% from Rs. 16.51 crore in December 2021. The EPS has grown from Rs. 2.75 in December 2021 to Rs. 3.57 in December 2022.
- On a Standalone basis, Net Sales in December 2022 are Rs 206.85 crore, up 96.33% from Rs 105.36 crore in December 2021. Quarterly Net Profit in December 2022 was Rs. 11.92 crore, up 34.94% from Rs. 8.83 crores in December 2021. In December 2022, EBITDA was Rs. 23.23 crore, up 40.7% from Rs. 16.51 crore in December 2021.
- Extrusion Machinery revenue increased by 29.2% year on year to 878 million in Q3FY23. Battrixx sales increased by 218.7% year on year to 1200 million in Q3FY23, with a solid order pipeline for the coming quarters.
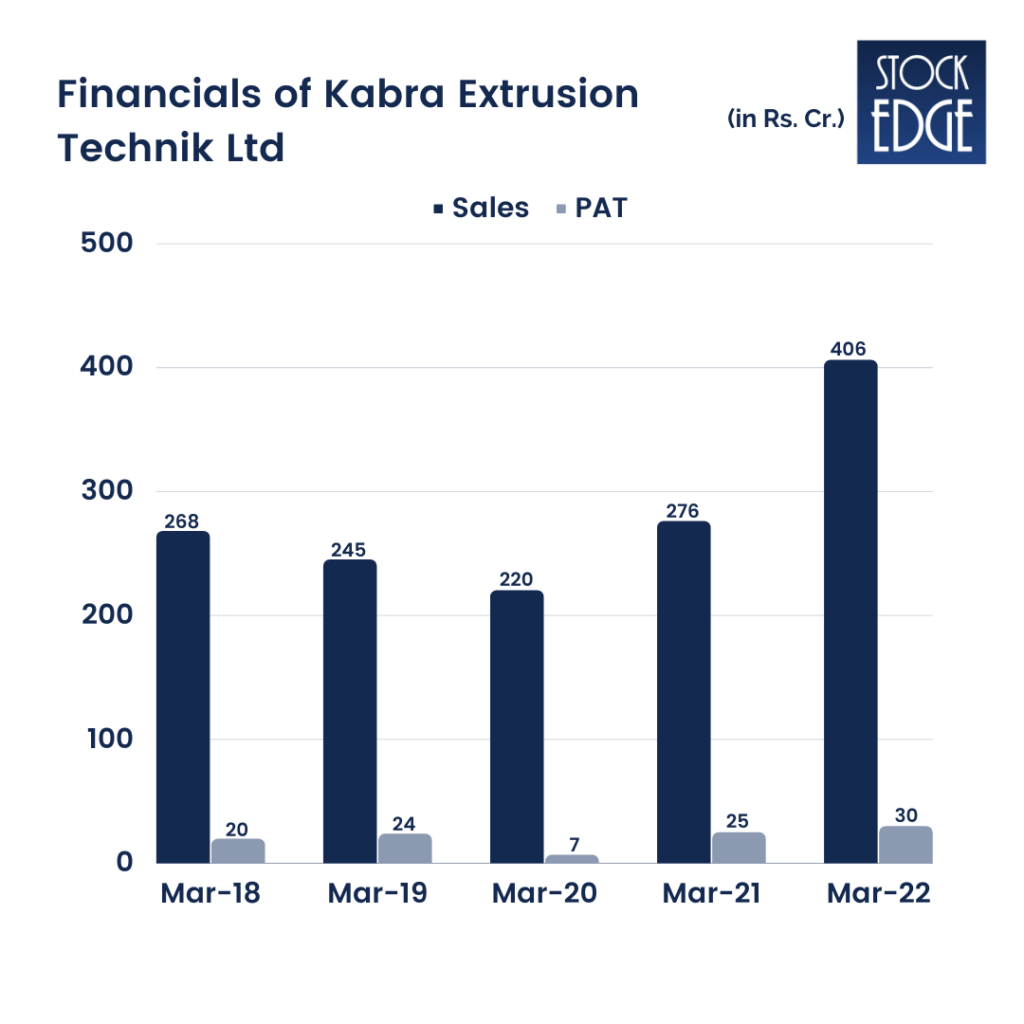
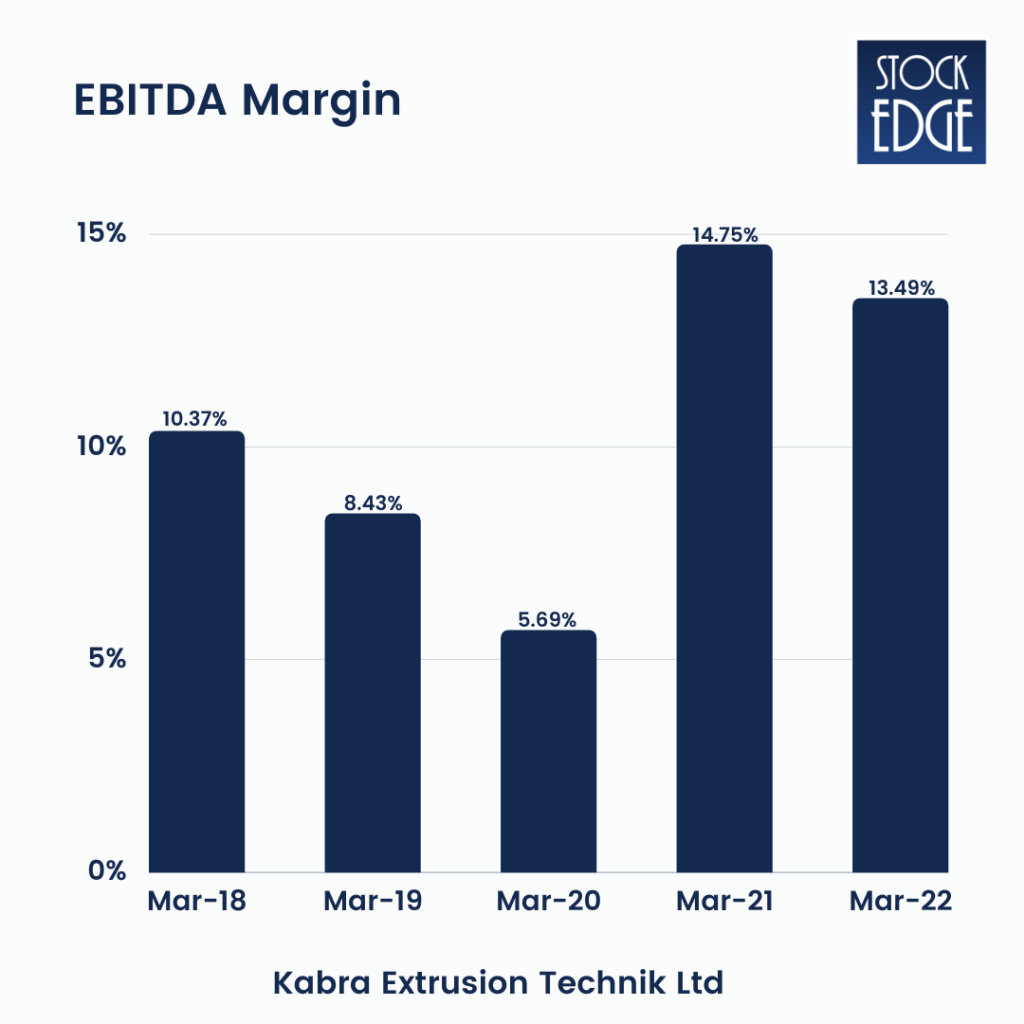
- For the fiscal years 2018-22, operating revenues increased at a CAGR of 10.9%. For the fiscal years 2018-22, EBITDA increased by 18.2%. During FY18-22, PAT increased at a CAGR of 10.9%.
Importance of Electric Vehicle(EV) Stocks
Electrifying the transportation industry will help to reduce carbon emissions and import dependency on hydrocarbon fuels. India imports over 85% of its domestic oil usage, and attaining 30% EV adoption by 2030 can lower import expenses by 15%, totaling INR 1.1 Trillion in savings. While India’s EV business is still in its early phases, it has been increasing thanks to government involvement, start-ups, and automotive Manufacturers.
Nonetheless, it is controlled mostly by 3W and 2W, with 4W accounting for a relatively minor portion of the market. The 3W segment has achieved reasonable EV penetration, but the 2W, 3W, and 4W segments have seen very little. By 2030, India intends to electrify 70% of commercial vehicles, 30% of private vehicles, 40% of buses, and 80% of 2W and 3W vehicles.
Due to the low EV penetration in LCVs (Light Commercial Vehicle), subsidies are expected to increase over the next two years, driving adoption. E-commerce and food delivery organizations, for example, have announced intentions to electrify their fleets. Businesses such as Flipkart and Zomato have stated their intention to electrify 100% of their fleets by 2030. Over the years, this is expected to drive a significant increase in EV penetration across the 2W, 3W, and LCV segments. Commercial cars are predicted to be more popular than personal vehicles due to lower TCO (Total Cost of Ownership) from increased daily usage and the provision of dedicated captive charging facilities, which will alleviate range anxiety.
During the next several years, economies of scale and enhanced localization will lower manufacturing costs and improve EV affordability. However, fuel prices will likely climb higher in the future, which may disincentivize the purchase of ICEs. Therefore people are moving towards the consumption of clean and sustainable energy which is increasing the demand for the purchase and use of EV Vehicles. Due to this significant transformation shift, this sector has become extremely important for investors. It is now easier to research and identify high-potential EV stocks with the help of a reliable stock market analysis tool.
Risks to consider when investing in EV stocks
- Inadequate charging infrastructure: India’s current charging infrastructure is limited, which may lead customers to experience range anxiety.
- Unfavorable TCO: One of the major risks to consider before investing in EV stocks is that EVs offer lower operating expenditures than ICEs, but their high upfront cost boosts the total cost of ownership (TCO), making them unattractive in some vehicle categories.
- High upfront costs: Even when TCO is favorable, large upfront prices remain a barrier since they disincentivize customers owing to a lack of understanding of opex benefits and more significant down payments.
- Restricted access to financing choices: Because the EV industry is still in its early stages, financial institutions need more confidence in the sector, restricting financing possibilities for the parties involved.
- Problems with supply chain scalability: The current scale of EV production needs to be improved, and the present supply chain relies on imports, resulting in high manufacturing costs. There is also a worldwide supply deficit of critical EV components, like battery cells and semiconductors, which is impacting the production capacity of Indian EV Manufacturers and is unlikely to be resolved soon, making it a risk to consider before investing in Electric vehicle(EV) stocks.
- Effect of long charging times: The entire time necessary to charge an EV is substantially longer than the gasoline replenishing time of an ICE car, which may result in difficulties such as lost time and profits.
Conclusion
Electric vehicles (EVs) can change India’s transportation industry. Thanks to the government’s push towards electric transportation and the rising availability of charging infrastructure, EVs are becoming a feasible choice for commuters across the country. The advantages of EVs, such as cheaper fuel costs, lower emissions, and improved air quality, make them an appealing option for private and business users. But, there are still issues to be solved, such as high starting costs and range anxiety, which may hinder EV adoption. The government and corporate sector must continue collaborating to overcome these obstacles and speed India’s transition to a cleaner, more sustainable transportation system. Nevertheless, the future of EVs in India looks optimistic, with a significant increase in usage expected in the following years.




very nice
very nice information