Table of Contents
We know the importance of charting while making a trading decision or short-term investment in the stock market. Without charts it is really difficult to analyze the stock price trends, right?
With the introduction of version 3.0 of the StockEdge application, we introduced you to our StockEdge’s charting solution and with each upgraded version of the application we keep on upgrading the charting solution.
Let’s discuss its feature one by one.
Fig-1(a)
Representing the chart of Tata Motors. Price is represented here as candlestick and in the lower section we have the volume indicator.
In the top section of the chart, there is a blue panel that contains some different features. Let’s explore them.
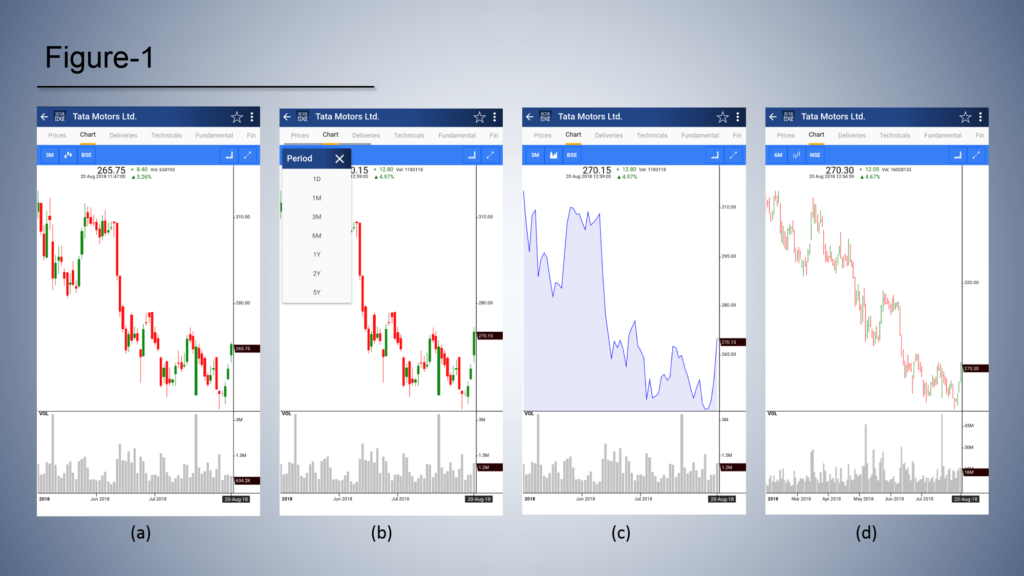
Fig-1 (b),
This is the Time frame tab and it contains seven different time frames. Starting from 1 day’s price action, you can select price action for up to 5 years.
Fig-1 (c),
This section contains 4 different styles of price charts.
- Candlestick
- Bar chart
- Line chart
- Area chart
Please remember, for a 1-day time frame only area and line is available.
Fig-1 (d),
This tab consists of two different exchange, they are NSE and BSE. By switching between the exchanges, a user can explore between two exchanges.
So far we have understood how to change time frame, chart type (candle, line, bar etc.) and the type of exchanges. Now, we will discuss indicators and the drawing tool which is pretty much essential for analyzing a chart.
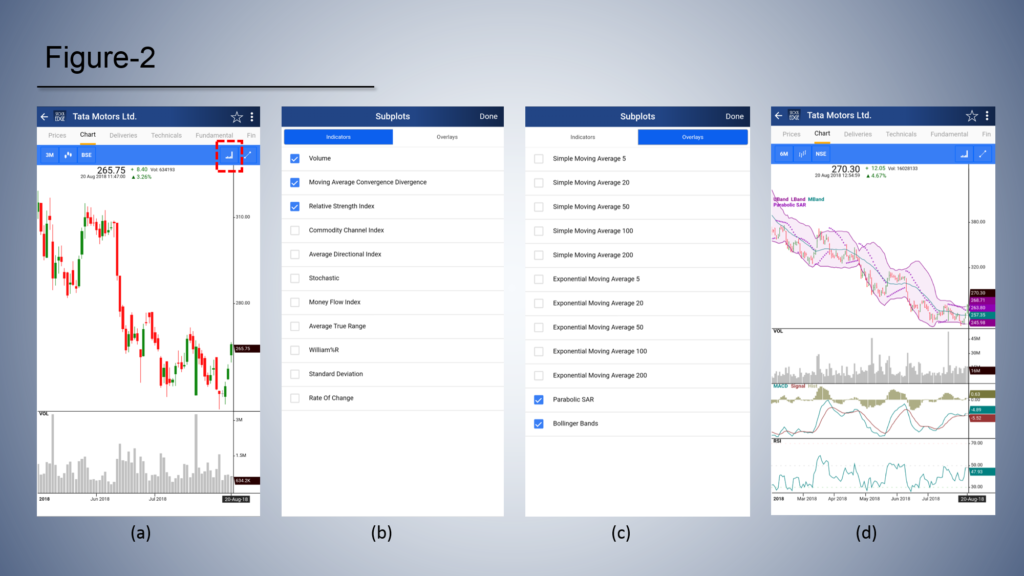
To select an indicator click on the subplots which shows both Indicators and Overlays (Fig- 2a)
In the indicator segment, we have eleven different indicators which are mostly used by the traders. As we know Indicators are plotted below the price, so any selection from this segment will be plotted below the price.
In this segment Indicators like Volume, RSI, MACD, etc. are available. For applying any indicator, we need to just tap on the indicator and once we are done with our selection we can press the ‘Done’ button. To delete an indicator from the chart we can go to the Subplots section again and tap on the pre-selected indicator (select the indicator, you want to delete) to deselect it.
In the overlay segment indicators are plotted directly on the price section. These indicators are popular as well as very much effective.
The procedure is the same as the indicator segment. We need to select an option to apply it on the chart.
The important point we need to remember is that for technical analysis it is very important to keep the chart clean so that we can interact with it easily and can understand the price action well. Due to this reason, we have restricted the indicator and overlay selection. A user can select up to 4 indicators and 3 overlays on the chart. We believe these are more than enough while analyzing a chart.
In Figure-2 (d) we have shared an image which is explaining how a chart looks when four subplots and three overlays are plotted on it.
Using Drawing Tool with Charts:
We know how important to draw a trend line, support line, resistance line in the chart for developing good trading practice and filtering our Entry and Exit decisions. For the user’s convenience, we have provided two important drawing tools.
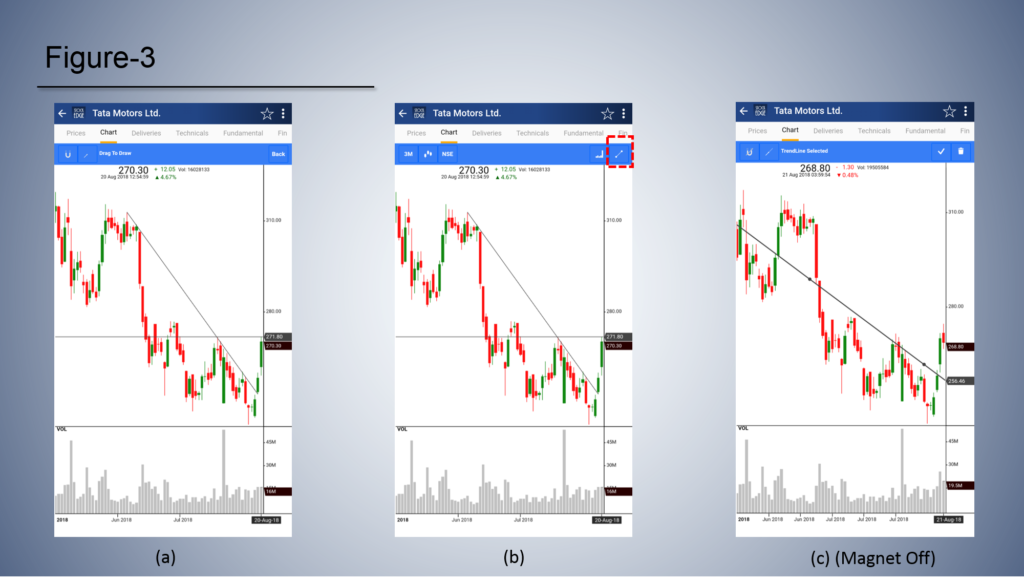
They are-
1. Magnet (Fig 3-a)
2. Free hand Trendline (Fig 3-b)
a. Horizontal trend line(with the extension on)
b. Trendline (with the extension off)
To ease your understanding we will first discuss the Trendline and then we will discuss the Magnet button.
Magnet:
Magnet is selected by default, once you click on the trendline button in the toolbar indicated in the fig 3b, you will find a customized trendline toolbar proving you with the information of the trendline to be drawn. Now you may draw a trendline anywhere in the chart itself. The point of the trendline will automatically snap to major points depending on the type of chart used and the position of your finger. Basically, this option helps to draw the lines more accurately and in an easy way.
Free Hand Trend line:
To draw a free-hand trend line all you need to do is to deselect the magnet icon in the trendline toolbar as indicated in fig 3 c. Now you are can move the points of your trendline anywhere within the chart. The points won’t automatically span to open, high, low, etc. like in magnet.
Crosshair:
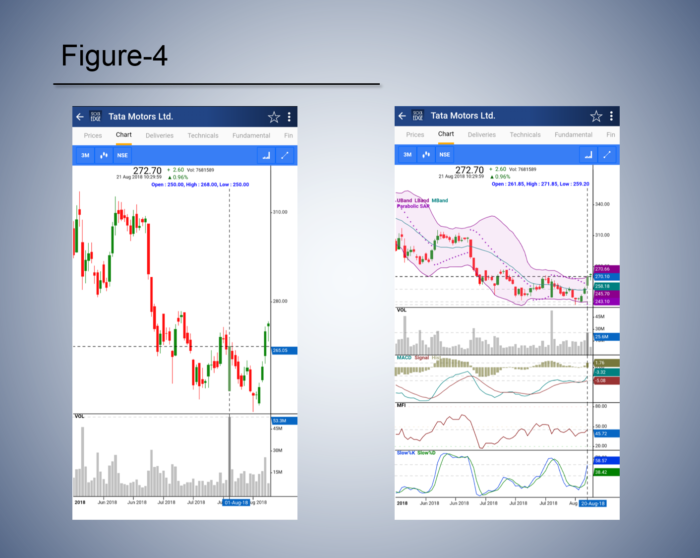
As you all know crosshair is an important tool for chart analysis. Crosshair helps to point out a particular price point and show us the corresponding price along with Open, High, Low, Close (OHLC) and date.
In the StockEdge application, you just need to tap on the candle or on the price bar to see their consecutive prices. The crosshair is normally not visible on the screen. Once any price point is tapped we get to see the crosshair and the details of that point.
Crosshair also shows the value of the applied indicators and overlays. When the indicators, overlays or both are applied in the chart we need to tap on the price bar or the candle to see the value of those indicators or overlays.
A user can open a chart by typing its name in the search button or can select the stocks button and then search the name of the stock to see its chart.
An important feature of this application is, when you are in the scan section and click on any stock, it takes you to an advanced chart page with pre-defined technical conditions as in the scan, the stock’s chart appears with that technical indicator automatically plotted.
To avail this feature, a user first needs to select or define some technical parameters from the Scans section (Home tab) and when the results appear one can explore their charts.
Advanced Edge Chart is a premium offering available to paid users, know more about the advanced offerings.
Get a comprehensive idea of advanced charts.






Can we save selected technical parameters on the chart by default so that we do not have to select the parameters again and again if we change company ticker?
Currently, we do not have that feature. Your feature request has been noted.
Sir ji mob pe kaun c aap pe chart dekna h
Download stockedge app https://www.stockedge.com/?download=1