StockEdge.com
  • Products
    • StockEdge Premium
    • StockEdge Pro
    • StockEdge Club
  • Stories
StockEdge Blog
  • Trending Stocks
  • Insights
  • Technical Analysis
  • Fundamental Analysis
  • StockEdge Tutorials
  • Mutual Fund
No Result
View All Result
  • Trending Stocks
  • Insights
  • Technical Analysis
  • Fundamental Analysis
  • StockEdge Tutorials
  • Mutual Fund
No Result
View All Result
StockEdge
Home StockEdge Version Updates
A banner of the stockedge app, version 3. 5, showing stock prices and financial data.

What’s new Version 3.5

StockEdge by StockEdge
November 18, 2023
Reading Time: 3 mins read
167
VIEWS
Share on FacebookShare on XShare On WhatsApp

Table of Contents

  • Additions in Free Version 3.5
    • Sector Analysis
    • Industry Analysis
    • Hierarchical view of Sectors and Industries
    • Draft Prospectus of IPO
  • Bottom Line

Good news! We are happy to announce that StockEdge has released version 3.5. In this version, StockEdge has brought many new features for the free users as well as for premium members. In this article let us discuss the new features in brief:

Additions in Free Version 3.5

In the 3.5 version of StockEdge, many new and useful features have been added which will help us in filtering fundamental sound stocks.

Sector Analysis

We have added few valuation tools in Sector feature like Market cap, P/E ratio, Debt-Equity ratio, RoE etc for filtering stocks based on these valuations parameters in any sector.  Given below is an example from Companies in the Agriculture Sector based on Price to Book Value.
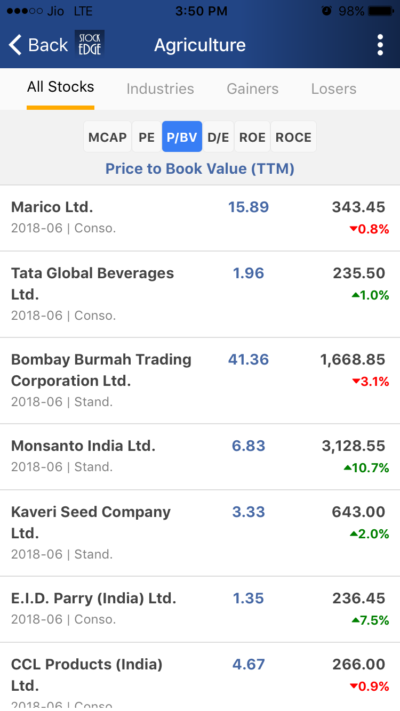
A screenshot of a list of agriculture stocks. The list is sorted by market capitalization and includes the stock names, prices, and percentage changes. The list includes stocks such as marico ltd. , tata global beverages ltd. , and kaveri seed company ltd.

Industry Analysis

We have added the same valuation tools in Sector feature like Market cap, P/E ratio, Debt-Equity ratio, RoE etc for filtering stocks based on these valuation parameters in any Industry. Given below is an example from Rubber Industry in Agriculture Sector based on Price to Earning Ratio.
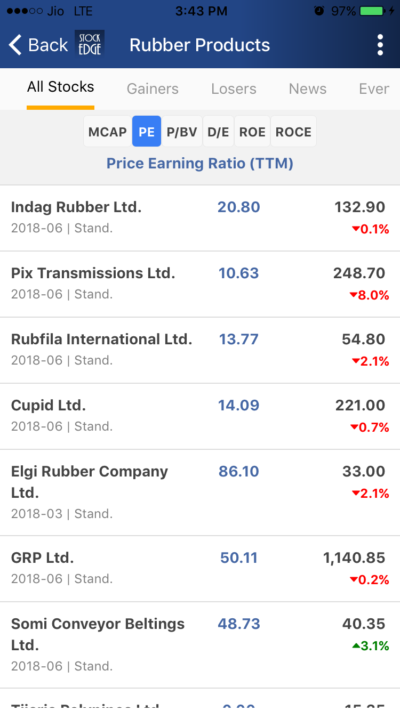
A screenshot of a list of rubber product companies and their stock prices. The list is displayed in a table format with columns for the company name, market capitalization, price-to-earnings ratio, dividend yield, and stock price. The table is sorted by stock price, with the highest prices at the top.

Hierarchical view of Sectors and Industries

This feature helps you to find the names of the various Industries in a particular sector which helps you to understand which industries belongs to which Sector and thus helps you to identify different Industry under same Sector.
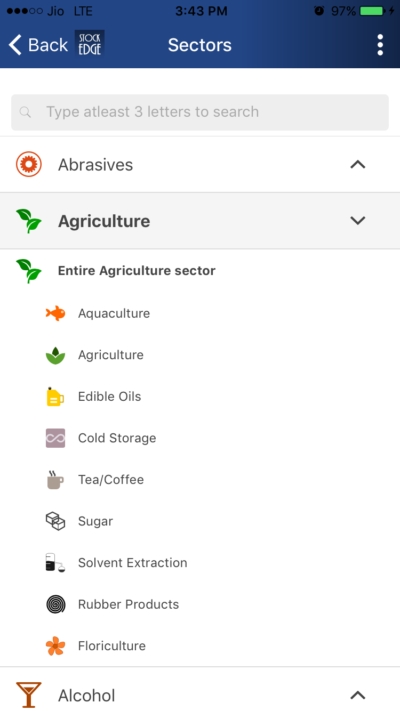
A list of sectors of diffrent sectors and their sub sectors id shown in stockedge app.

Draft Prospectus of IPO

We have added the red herring prospectus of the IPO in the IPO Objective section, to give you a detailed insight into the purpose and the working of the company coming out with an IPO. Thus this will help you take an informed decision before applying for the IPO.
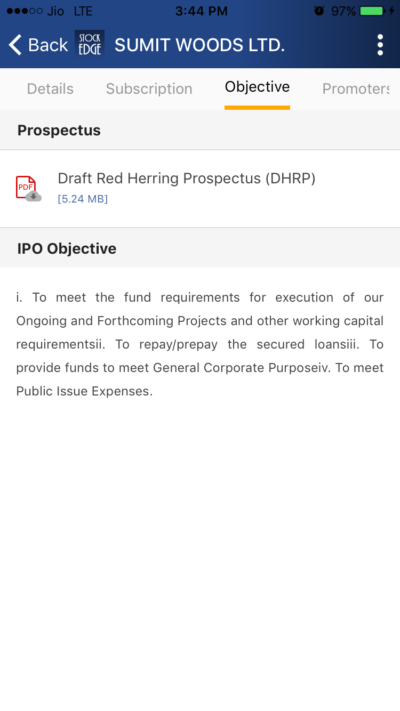
A screenshot taken from stockedge screen displaying a document titled “red herring prospectus (dhrp)” with text below it. The text below the title reads “ipo objective” and “public issue expenses

Bottom Line

These added features will help you take more informed decisions at a click of a button.  The fundamental indicators in the Industry and sectors will help you to track down information on any particular Industry or stock and help you take informed decisions.

ShareTweetSend
Open A Zero Brokerage Account In Kotak Open A Zero Brokerage Account In Kotak Open A Zero Brokerage Account In Kotak
Previous Post

How to use Bollinger Bands?

Next Post

Shareholding Pattern: Impacts, Institutional & Investors

StockEdge

StockEdge

StockEdge is a self-help Equity and Mutual Fund research tool. It empowers retail investors to identify investment opportunity with all the necessary data and analytics.

Next Post
Shareholding scan stockedge

Shareholding Pattern: Impacts, Institutional & Investors

Turnover scans stockedge

Use Sales Growth Ratio to Identify Good Companies

Stockedge solvency scan

Solvency Ratio: Definition, Formula & Scan

Comments 2

  1. Avatar of surbhi lohia Surbhi lohia says:
    7 years ago

    Thankyou for your feedback!!

  2. Avatar of branding branding says:
    6 years ago

    thanks for this post

Disclaimer

StockEdge (Kredent InfoEdge Pvt. Ltd.) is a SEBI-registered Research Analyst (RA) entity (SEBI Registration No: INH300007493). The information provided in this article is for educational and informational purposes only and should not be considered as an offer to buy or sell any securities or investment products.

The stocks, securities, and investment instruments mentioned herein are not recommendations under SEBI (Research Analysts) Regulations, 2014. Readers are advised to conduct their own due diligence and seek independent financial advice before making any investment decisions.

Investments in securities markets are subject to market risks. Please read all related documents carefully before investing. Investing in Equity Shares,
Derivatives, Mutual Funds, or other instruments carry inherent risks, including potential loss of capital. StockEdge (Kredent InfoEdge Pvt. Ltd.) does not provide any guarantee or assurance of returns on any investments. Past performance is not indicative of future performance.

Contact Us
  • Timing (Mon-Sat): 10 am to 7 pm
  • Sales: +919830994463
  • Support: +919830994402
  • Club Support: +916289906895
  • Affiliate: +917003567131
Recent Posts
Smarter portfolio
Don’t Just Diversify—Optimize: The Dezerv Way to Smarter Portfolios & Fairer Fees
3 PSU Stocks in India - Blog Cover Image
Top 3 PSU Stocks in India
Important Links
  • StockEdge.com
  • StockEdge Premium
  • StockEdge Pro
  • StockEdge Club
  • Compare Plans
An Initiative Of
Logo of KREDENT INFOEDGE with SEBI Registration no.

© 2025 Kredent InfoEdge Pvt Ltd.

Facebook-f Twitter Instagram Linkedin-in Youtube Pinterest-p Whatsapp Telegram

Get StockEdge App

No Result
View All Result
  • Home
  • Article Categories
    • Trending Stocks
    • Insights
    • Technical Analysis
    • Fundamental Analysis
    • StockEdge Tutorials
    • Mutual Fund
  • Stories
  • Products
    • StockEdge Premium
    • StockEdge Pro
    • StockEdge Club
  • Visit StockEdge.com

© 2024 Kredent InfoEdge Pvt Ltd.

Get 40% discount on SMART40