Table of Contents
Hello friends,
StockEdge is glad to Announce Version 4.4 with many new exciting free and premium features which will enhance your Stock research further.
What’s New
| 1. | Relative performance of stocks vis a via Index. |
| 2. | Relative Performance Scans. |
| 3. | Week returns in Gainers/Losers. |
| 4. | 20-day crossover SMA Scans. |
| 5. | 20-day crossover EMA Scans. |
| 6. | Bug fixes and Performance enhancement. |
1. Relative Performance of stocks vis a via Index.
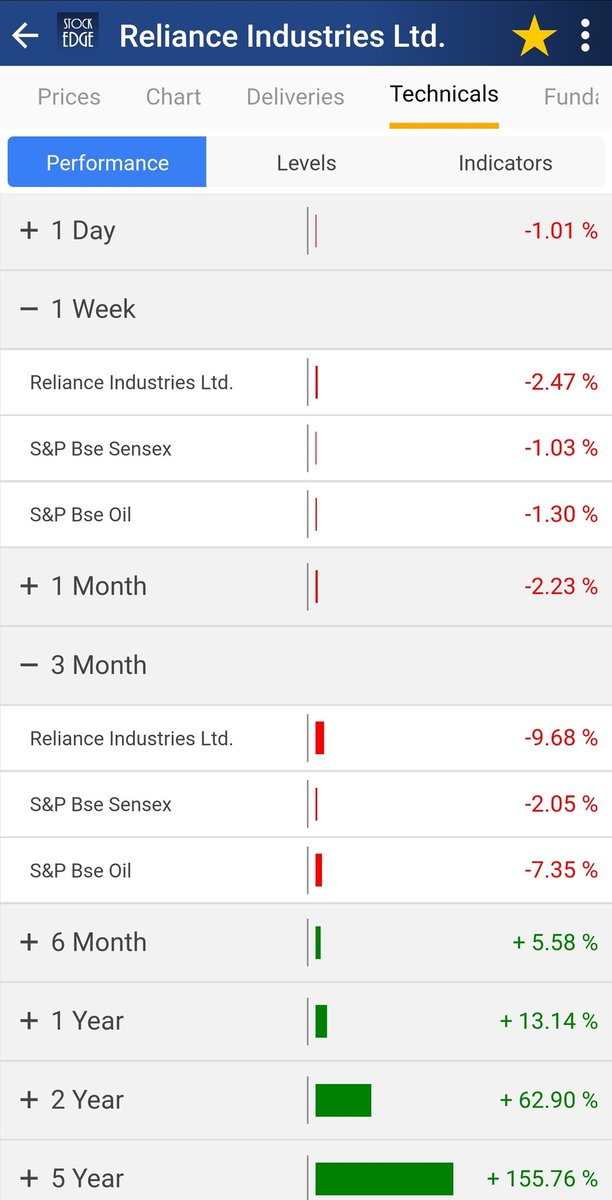
This feature will help you to compare your stock vis a via the Benchmark index and sectoral index over various time frames. Available to all the guest users.
2. Relative Performance Scans in StockEdge 4.4.

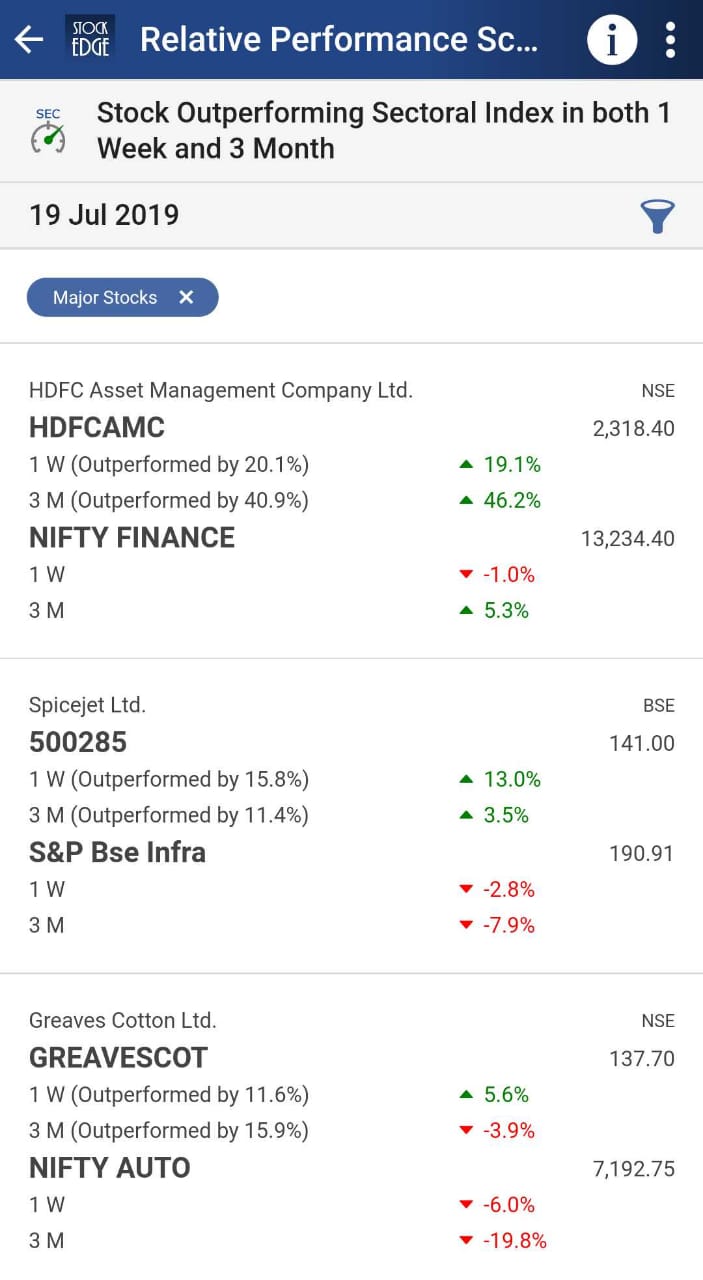
4 new scans have been added under Price Scans: (Premium feature)
- Stock Outperforming Benchmark Index is both 1 week and 3 month
- Stock Underperforming Benchmark Index is both 1 week and 3 month
- Stock Outperforming Sectoral Index is both 1 week and 3 month
- Stock Underperforming Sectoral Index is both 1 week and 3 month
These scans will help you identify stocks which outperform or underperform the benchmark Index and Sectoral Index Consistently over the period of 1 week and 3 months
3. 1 Week returns in Gainers/Losers.
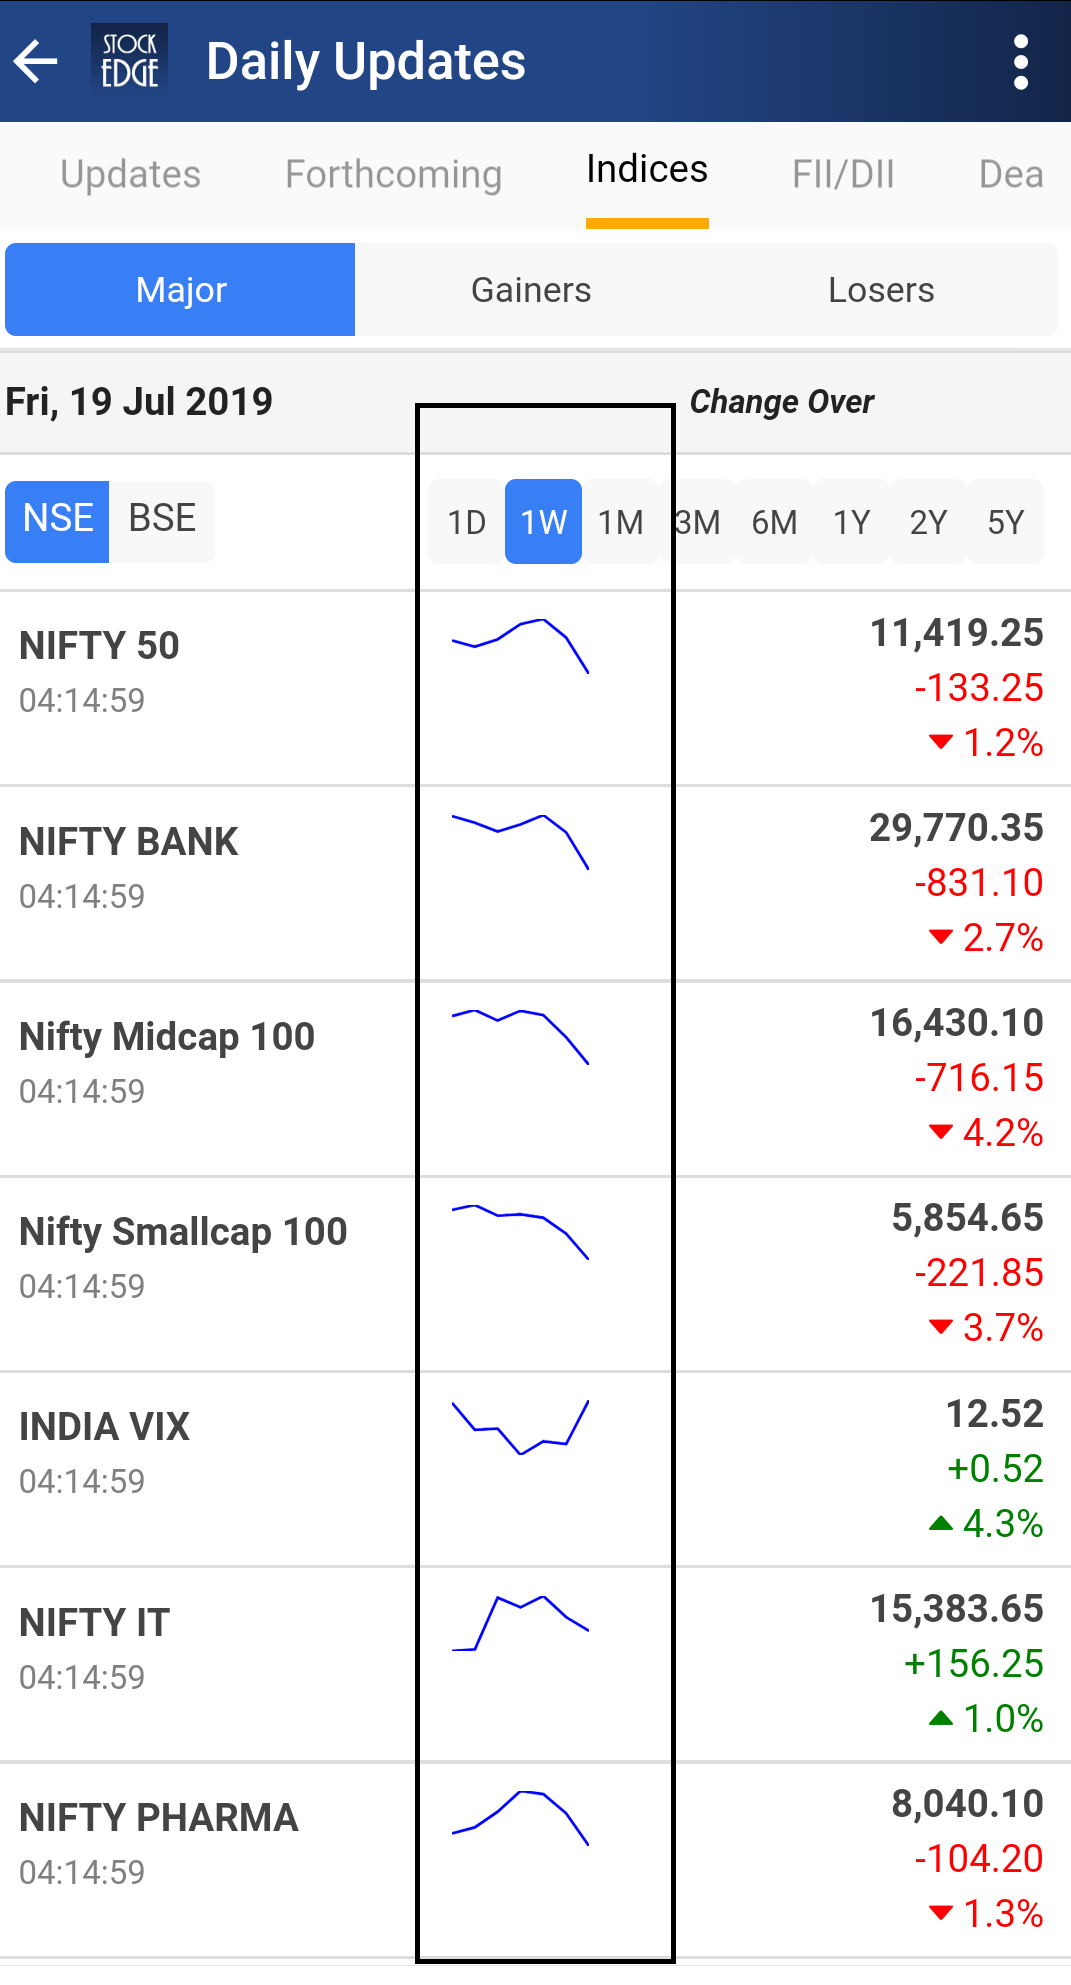
1 week time has been added along with other time frames in Indices, Sector, Industry, My Watchlist Gainers/Losers along with Sparkline chart. It has also been added in Price chart and Advance Edge chart. It is available to all the guest users.
4. 20-day crossover SMA Scans.
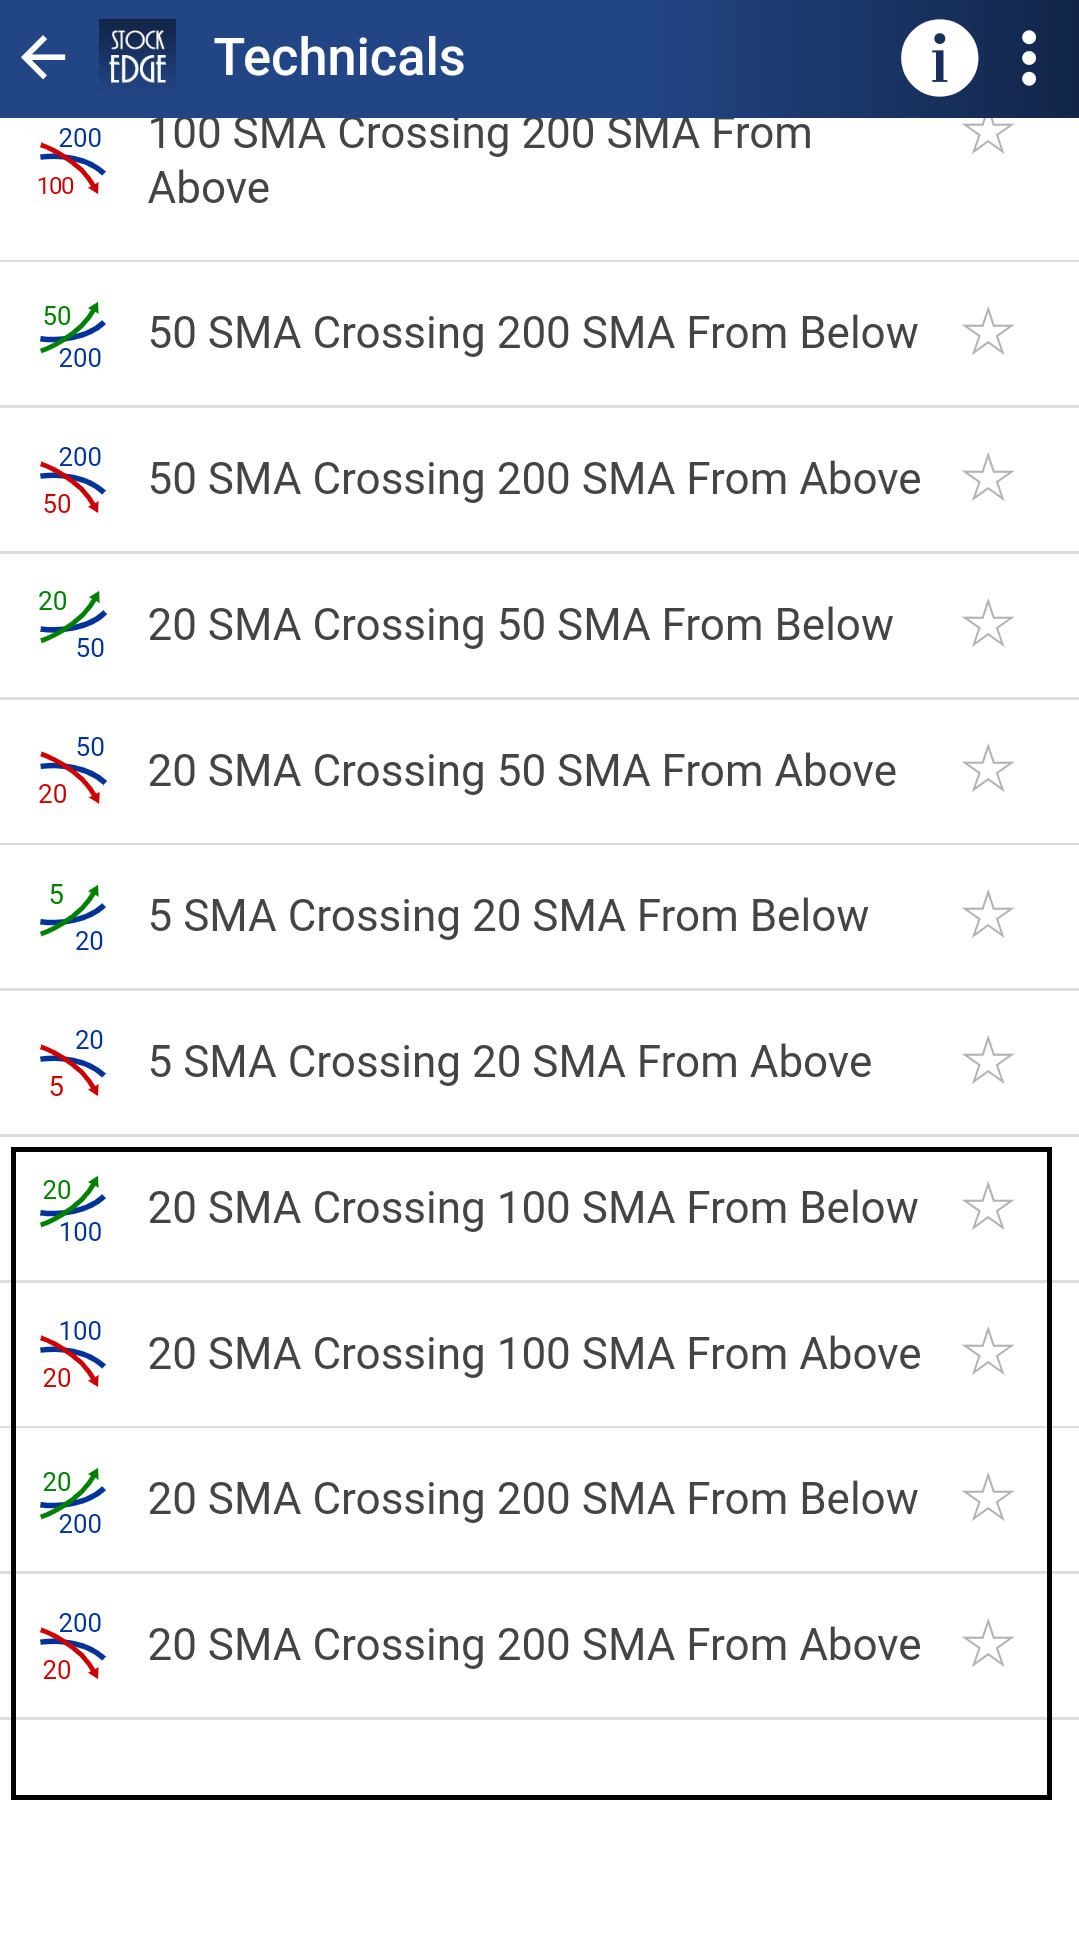
4 new 20-day crossover SMA Scans have been added for short term stock identification: (Free Feature)
- 20 SMA Crossing 100 SMA from Below
- 20 SMA Crossing 100 SMA from Above
- 20 SMA Crossing 200 SMA from Below
- 20 SMA Crossing 200 SMA from Above
5. 20-day crossover EMA Scans.
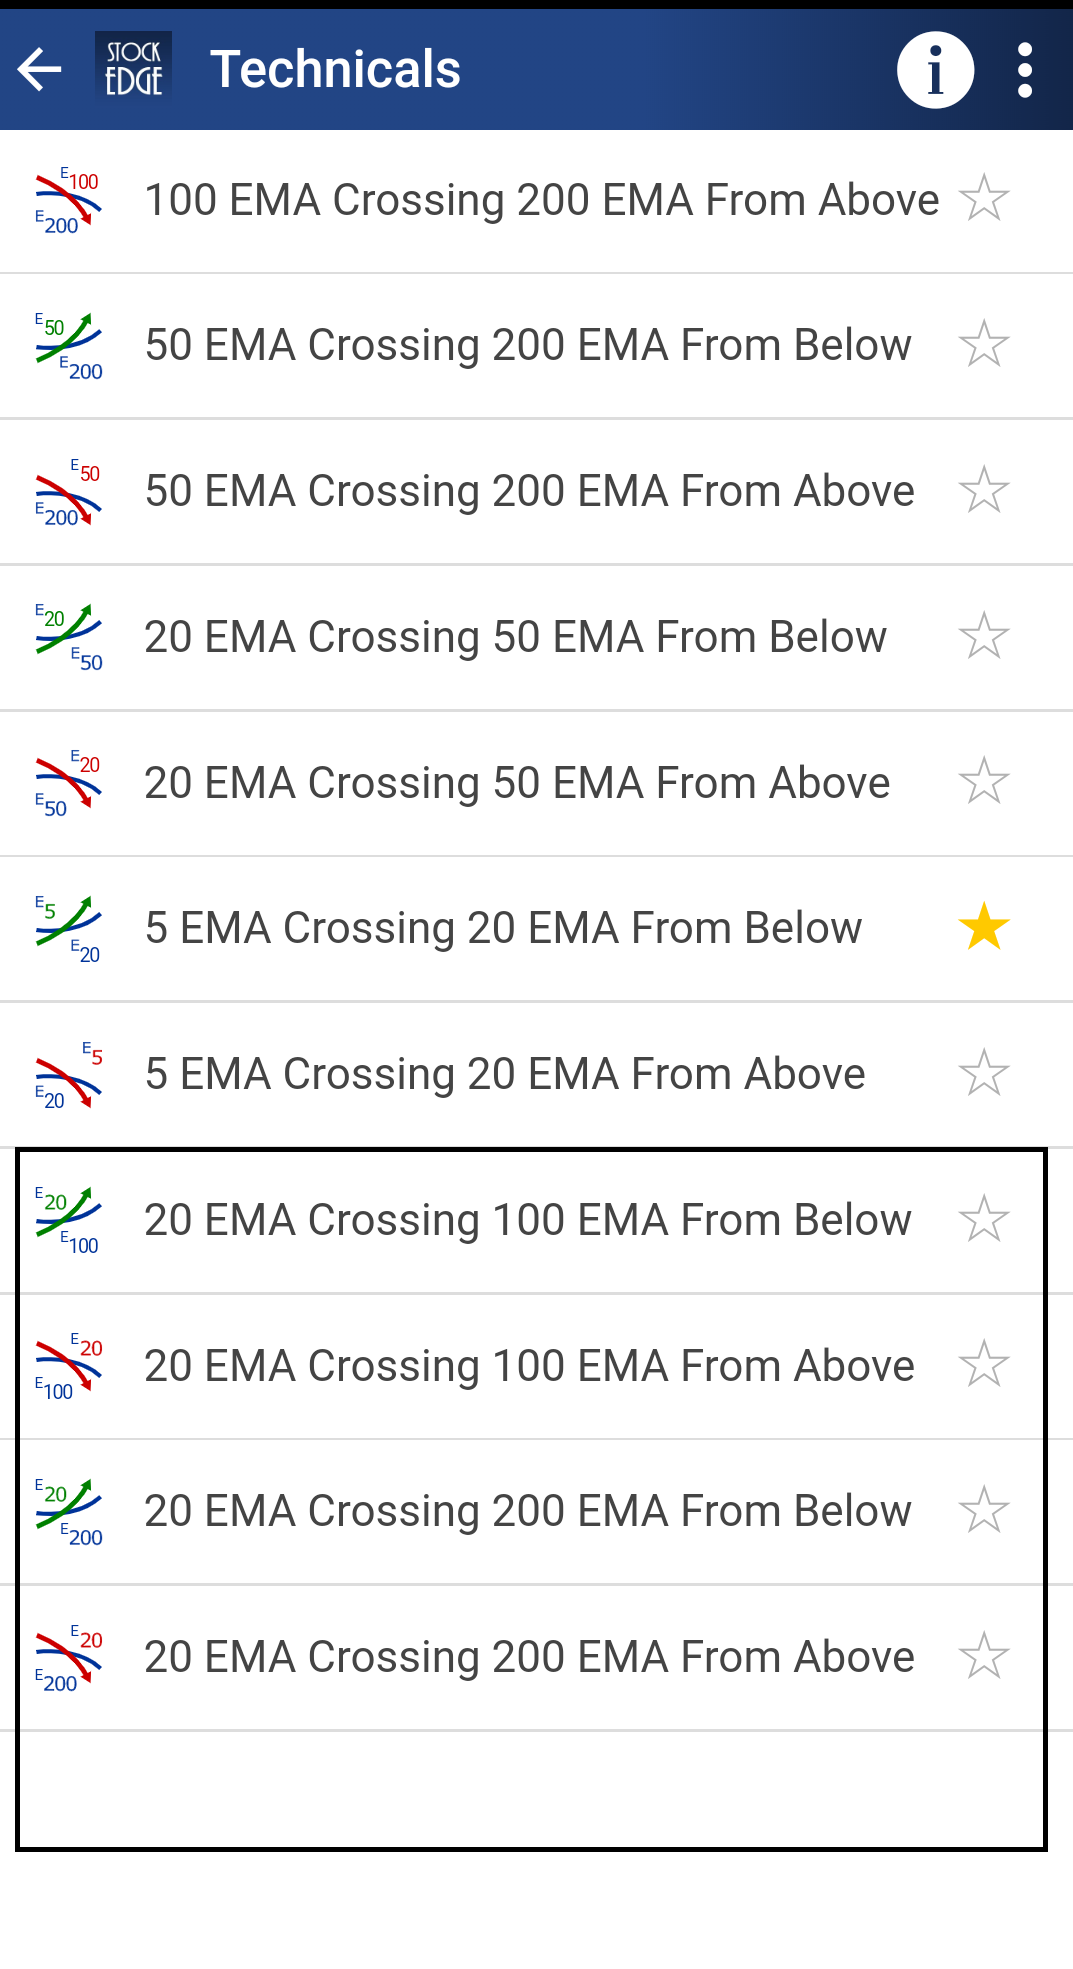
4 new 20-day crossover EMA Scans have been added for short term stock identification: (Premium Feature)
- 20 SMA Crossing 100 EMA from Below
- 20 SMA Crossing 100 EMA from Above
- 20 SMA Crossing 200 EMA from Below
- 20 SMA Crossing 200 EMA from Above
Bottomline
These added features will help you make more informed decisions at a click of a button. We hope you enjoy using these features and in case you wish to subscribe to Premium features click on the link given below.
Click here to know more. Become a Premium Member
Also, click on the youtube link to view video of Version 4.4


